-
弹光调制器是由弹光晶体和电光晶体组成的谐振器件,当其应用于傅里叶变换光谱仪时,具有测量速度快、光谱范围宽、抗震性能好等优点,可实现高速、瞬态光谱探测[1]。弹光调制器作为干涉仪的核心器件,其稳定性和调制深度将影响反演光谱的稳定性和光谱分辨率的准确度。目前,弹光晶体多采用多块串接法[2]、多次反射法[3-5]等提高两束光的光程差,以提高反演光谱的分辨率。但多块串接法一致性差,很难做到同步;多次反射法光能衰减明显,且弹光晶体在工作时因自身振动温度变化,引入自身谐振频率的漂移,降低了系统稳定性。
为了提高系统稳定性,参考文献[6]在分析弹光调制器工作模型的基础上,提出了温度补偿方法;参考文献[7-8]提出了基于数字锁相的频率跟踪技术;参考文献[9]提出了PEM-ATC,但是该方法仅降低了外界环境温度的影响,并不能减小弹光调制器自身温度升高引起的频率漂移。参考文献[10]提出了双闭环多参数驱动控制技术以降低温度的影响。
为了更好地分析弹光调制傅里叶变换光谱仪的稳定性影响因素,文中采用多次反射式弹光调制干涉仪、基于频率跟踪和幅度调制的驱动控制方法以及非线性的光谱重建方法搭建弹光调制傅里叶变换光谱仪。在分析弹光调制器热稳定因素的基础上,从频率漂移、幅值调节、光程差变化以及重建光谱等方面分析系统的稳定性。
-
在傅里叶变换光谱中,干涉图的最大光程差可反映重建光谱的分辨率。当入射光经弹光调制干涉仪产生干涉图的瞬态光程差为[11]:
$$L = \Delta n \cdot d = dn_0^3(\lambda )({{\text{π}} _{12}} - {{\text{π}} _{11}}){\delta _0}\sin ({\omega _0}t)$$ (1) 式中:d为通光路径;λ为入射光的波长;
${n_{0}{(\lambda )}}$ 为晶体在该波长下的折射率;δ0为最大调制应力;${{\text{π}} _{12}},{{\text{π}} _{11}}$ 为不同通光方向的应力弹光系数张量。由公式(1)可知,在入射光波长一定时,可采用多次反射提高通光路径d,或增加
$\Delta n$ 提高最大光程差。多次反射提高通光路径使入射光衰减严重。因此,在反射次数一定,通光路径d一定时,可通过增加$\Delta n$ 提高最大光程差。增加
$\Delta n$ ,则要求增加最大调制应力δ0。为了产生大的调制应力δ0,要求施加在弹光调制器的压电晶体上的驱动信号幅值要尽可能的大,同时使弹光调制器处于最佳谐振状态。当弹光调制器的谐振状态变差时,在相同的驱动应力下,产生的形变$\Delta n$ 减小。设弹光调制器的谐振频率为
${\omega _{\rm{r}}}$ 。当驱动信号幅值不变、频率$\omega = {\omega _{\rm{r}}}$ 时,弹光调制器将处于最佳谐振状态,弹光调制干涉仪将产生最大的相位延迟量;而当驱动信号频率偏离谐振频率${\omega _{\rm{r}}}$ 时,最大相位延迟量减小,从而降低重建光谱的分辨率。弹光调制器作为谐振器件,其工作时的热损耗功率
$P{}_{{\rm{th}}}^{}$ 较大,且为:$${P_{{\rm{th}}}} = VI\cos \phi = \dfrac{{{V^2}}}{{R[1 + {Q^2}{{(\omega /{\omega _{\rm{r}}} - {\omega _{\rm{r}}}/\omega )}^2}]}}$$ (2) 式中:
$V$ 为驱动电压幅值;$R$ 为弹光调制器的等效阻抗;$Q$ 为品质因数。弹光调制器为低阻尼器件,产生的热耗散一部分以热交换方式向周围环境扩散,另一部分引起自身温度升高。弹光调制器的频率温度系数近似为:
$$ {\omega _{\rm{r}}}(T) = {\omega _{\rm{r}}}^\prime + a\left( {T - {T_{{\rm{amb}}}}} \right) $$ (3) 式中:
${\omega _{\rm{r}}}{^{\prime}}$ 为弹光调制器初值固有频率;${T_{{\rm{amb}}}}$ 为初始温度;$a$ 为温度系数。将公式(3)与公式(2)联立,得到弹光调制器的频率漂移模型为:$$\dfrac{{{\rm{d}}{\omega _{\rm{r}}}}}{{{{d{\rm{t}}}}}} = \frac{a}{{2cR}}{\rm{*}}\dfrac{{V{{(\omega )}^2}}}{{1 + {Q^2}{{\left( {\dfrac{\omega }{{{\omega _{\rm{r}}}}} - \dfrac{{{\omega _{\rm{r}}}}}{\omega }} \right)}^2}}} - \dfrac{{({\omega _{\rm{r}}} - {\omega _{r'}})}}{{{\tau _{{\rm{th}}}}}}$$ (4) 式中:
${\tau _{{\rm{th}}}} = {R_{{\rm{th}}}} \cdot c$ 为热时间常数,$c$ 为比热容。从公式(4)可知,弹光调制器的频率漂移是与驱动电压、品质因数、谐振状态有关。且频率漂移率与驱动电压成正比、与品质因数呈反比关系。同时当PEM处于最佳谐振状态时,热耗散引起的频率漂移更严重。
弹光调制器的品质因数可表示为:
$$Q = {Q_1} \times {Q_2} \times \beta$$ (5) ${Q_1}$ 和${Q_2}$ 分别为弹光晶体和压电晶体的品质因数;$\beta $ 为常数,表征压电晶体与弹光晶体的传递效率。弹光晶体和压电晶体有不同方向的频率温度系数,温度升高将会引起各自的谐振频率向不同方向发生变化,使得${\omega _{\rm{r}}} \ne {\omega _{{\rm{r1}}}} \ne {\omega _{{\rm{r2}}}}$ 。这将导致弹光晶体和压电晶体的品质因数降低,从而减小光程差因子。为保证弹光调制干涉仪工作于最佳谐振状态,参考文献[12]研究了以数字锁相环为核心的驱动频率自跟踪调节方法,同时,结合重建光谱的分辨率含义和干涉图最大光程差检测理论,研究了驱动频率自跟踪和幅值调节的双闭环驱动控制技术。在该技术中已知流过压电石英驱动器的电流信号与驱动电压信号的相位差
$\varphi \left( \omega \right)$ 为:$$\varphi \left( \omega \right) = - {\rm{arctan}}\left({Q_1}\left(\dfrac{\omega }{{{\omega _{\rm{r}}}}} - \dfrac{{{\omega _{\rm{r}}}}}{\omega }\right) \right)$$ (6) 通过检测相位差
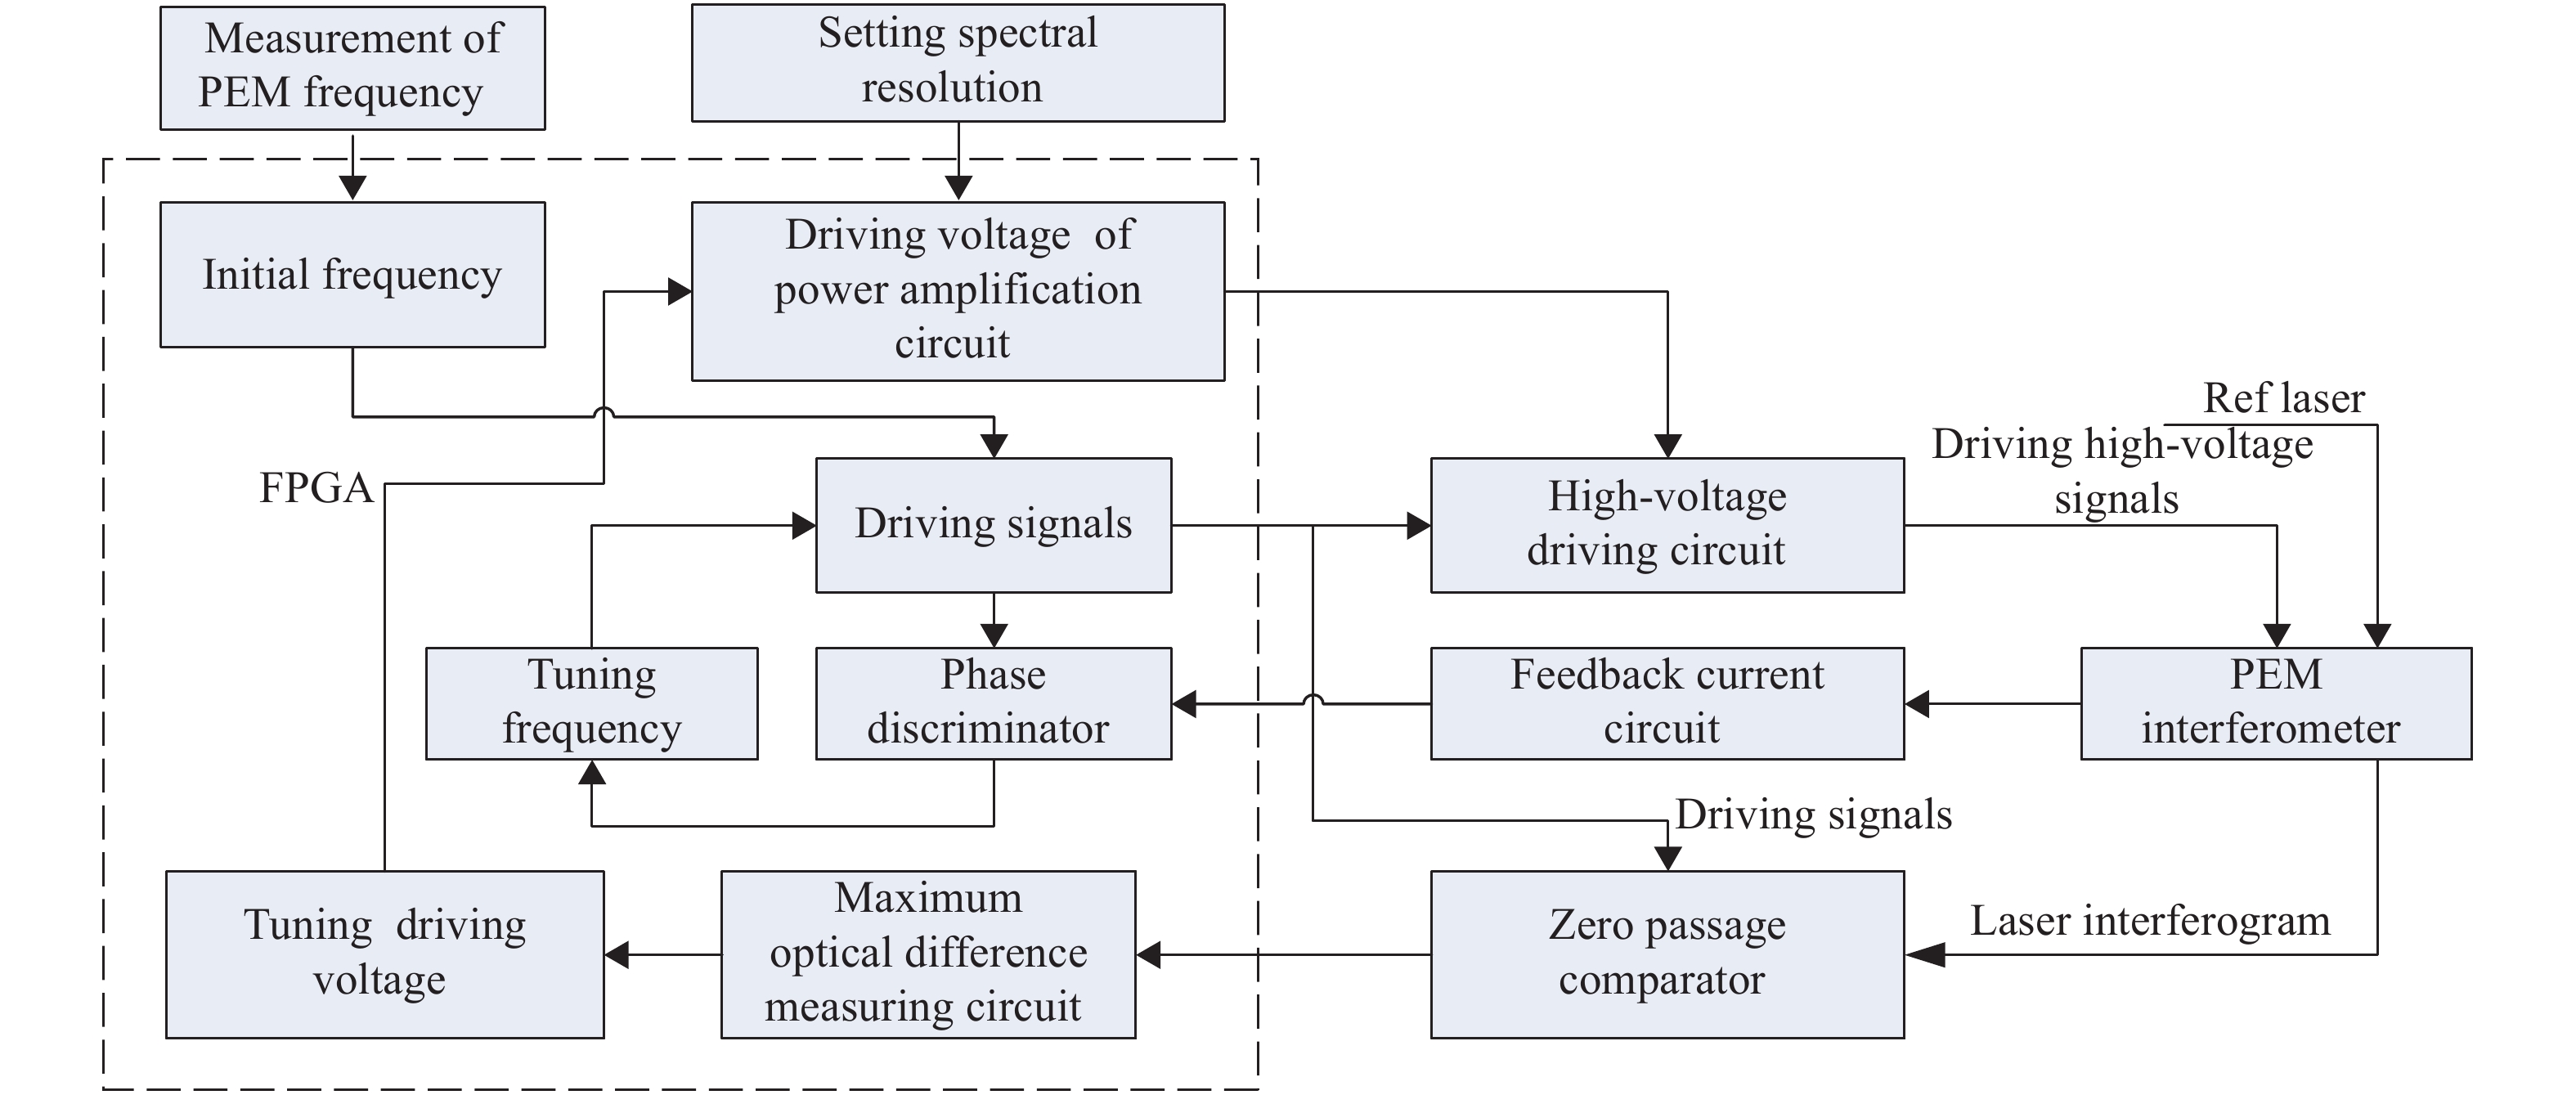
$\varphi \left( \omega \right)$ ,调节驱动信号的频率,使其能跟踪弹光调制器谐振频率的变化。同时,基于光谱分辨率的指标要求设定检测干涉图的最大光程差。将最大光程差的实际测量值与预定值进行比较,调节高压驱动电路的驱动电压,以维持干涉图最大光程差的稳定。建立的双闭环自适应驱动控制系统结构框图如图1所示。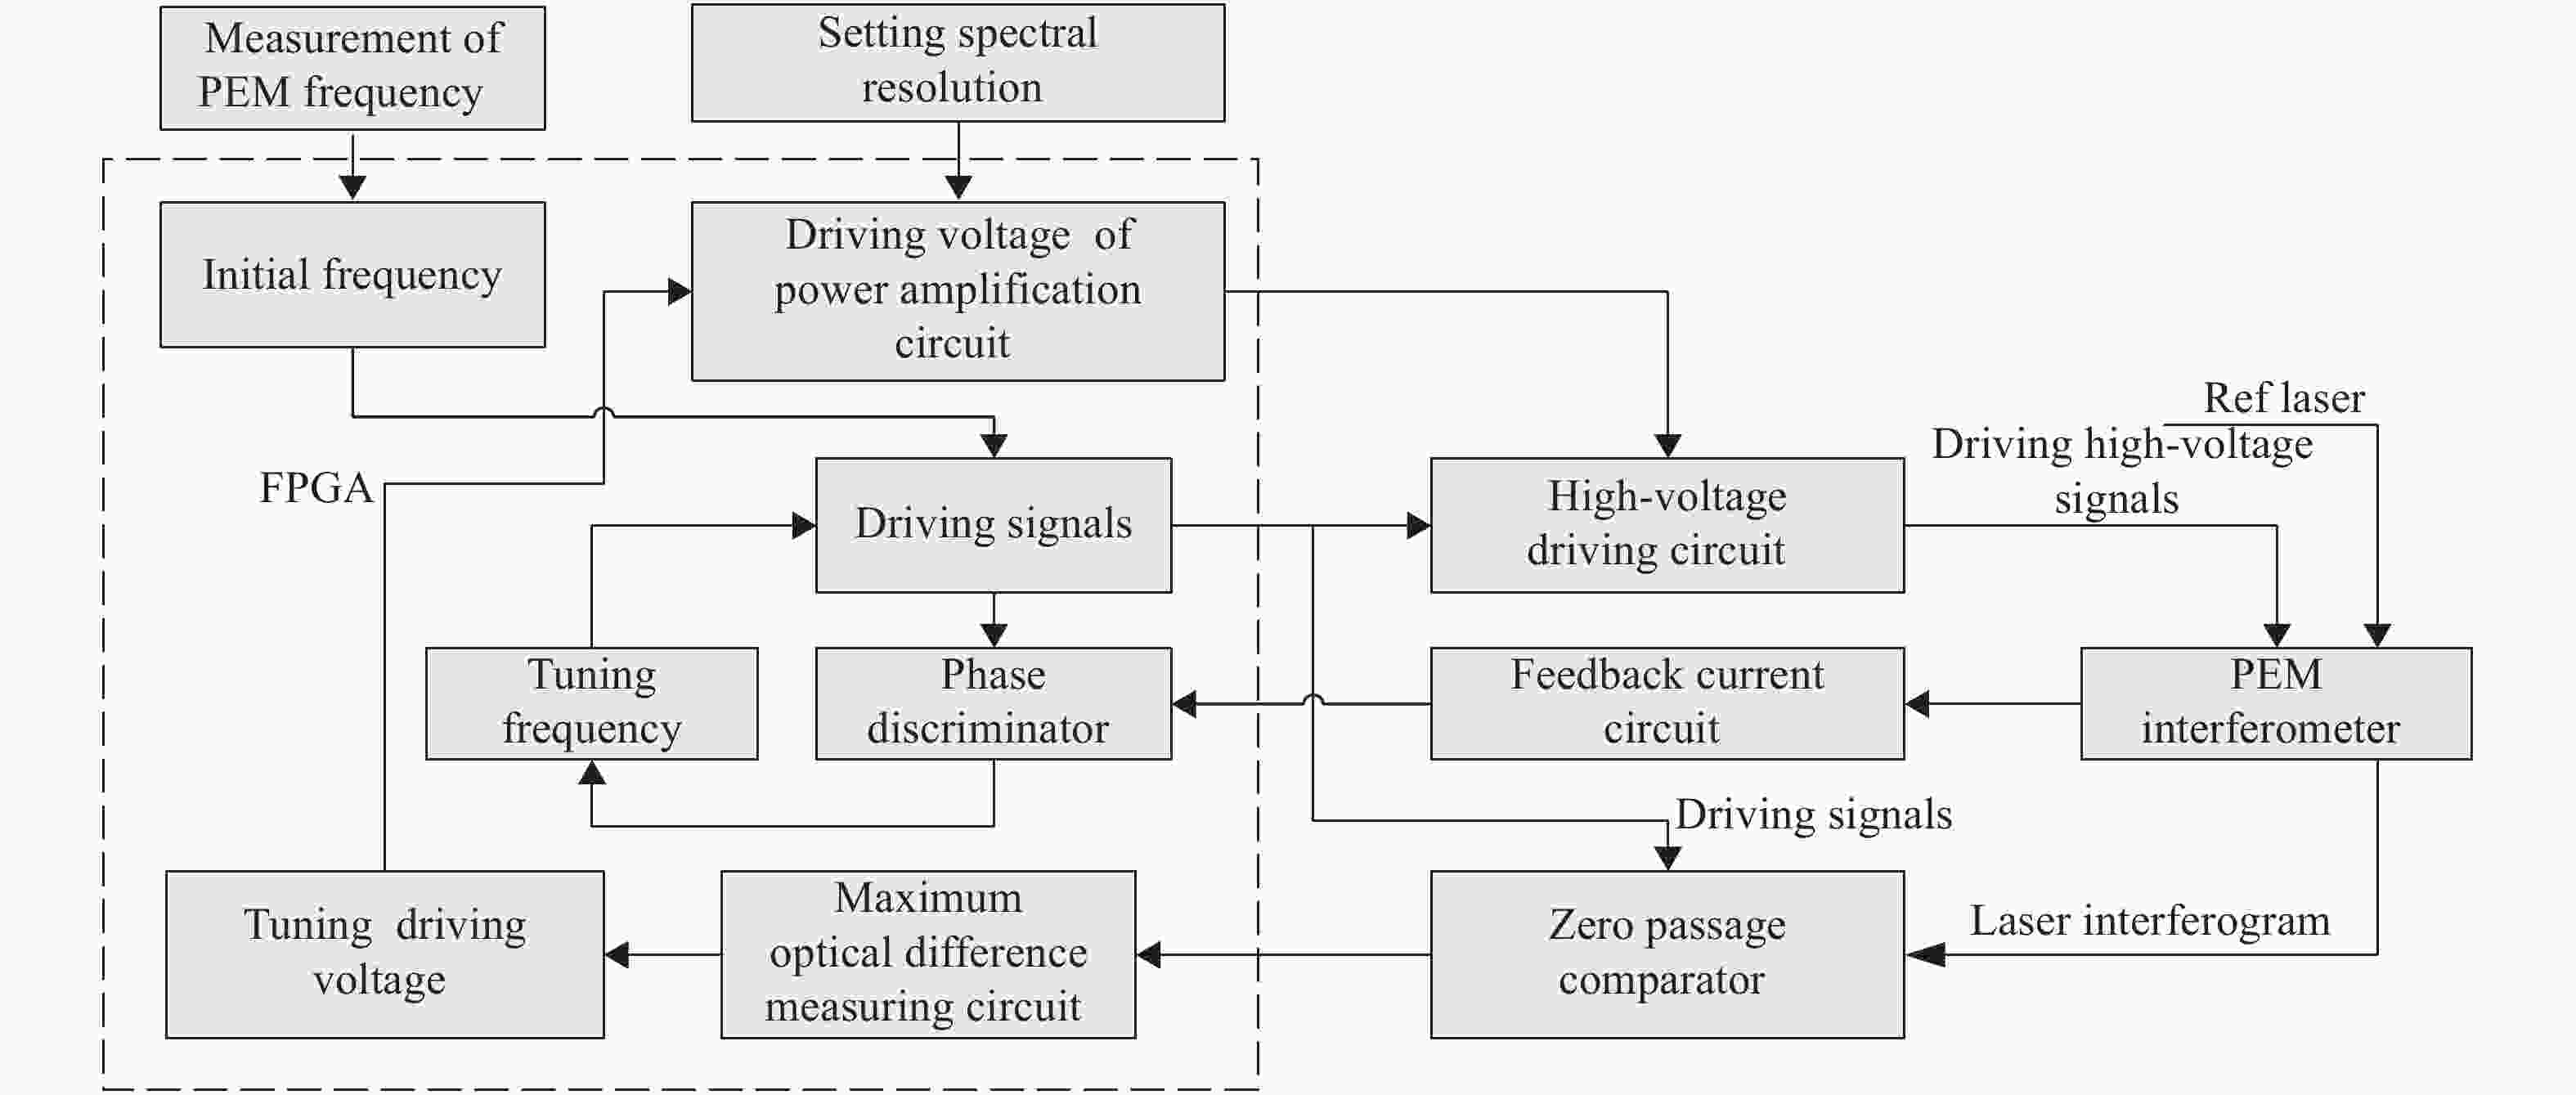
图 1 双闭环自适应驱动控制系统结构图
Figure 1. Chart of the double closed loop adaptive driving control system
由公式(1)可知,弹光调制干涉信号是非正弦变化,在采用等时间方式采样干涉信号时,采集的干涉信号不满足快速傅里叶变换算法的条件。因此,笔者所在课题组采用了非均匀快速傅里叶变换算法对干涉图进行光谱重建。已知离散傅里叶变换算法的频率分辨率
$\Delta f$ 与时域中干涉图的最大光程差呈反比。为了标定重建光谱,需实时检测干涉图的最大光程差,同时应尽可能维持此参数稳定。 -
为了分析弹光调制器的频率温漂对系统稳定性的影响,以及验证双闭环自适应驱动控制技术的有效性,文中基于课题组研制的多次反射式弹光调制器、驱动控制电路、高压功放电路、数据处理系统等,搭建了弹光调制傅里叶变换光谱仪测试平台,如图2所示。在该平台中,弹光调制器采用ZnSe晶体的谐振频率为50.448 kHz,参考激光为632.8 nm的激光器。

图 2 弹光调制傅里叶变换光谱仪测试平台
Figure 2. PEM-FTs test platform
-
在实验室环境温度约为21 ℃,连续3 h,每间隔10 min,通过测振仪对弹光调制器的谐振频率进行测量并采集。得到的谐振频率如图3所示。弹光调制器的初始调制频率为50.448 kHz。随着工作时间加长,PEM温度升高,谐振频率有衰减趋势,如图4所示。因此,为了使弹光调制器工作于最佳谐振状态,需要驱动信号的频率跟随弹光调制器谐振频率的变化进行调节。
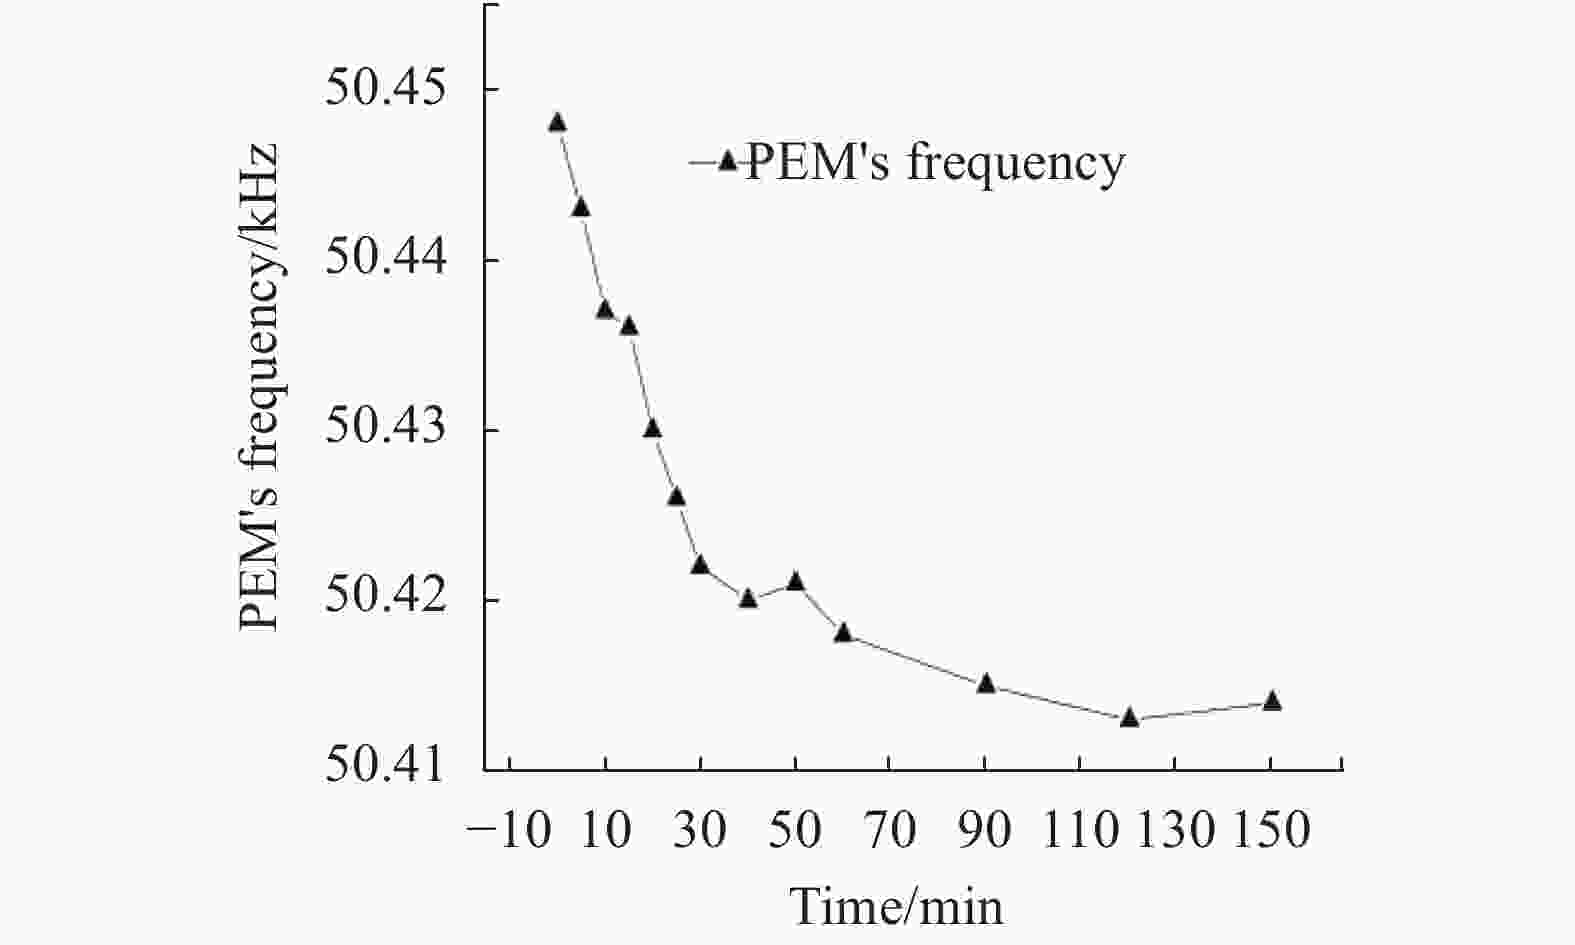
图 3 弹光调制器的谐振频率变化曲线
Figure 3. PEM resonant frequency drifting curve

图 4 带频率自动跟踪与固定频率实验效果图
Figure 4. Experimental figures of the auto tracking frequency method and fixed frequency method
-
基于公式(6),通过检测高压驱动电压
$V(\omega )$ 与流过弹光调制器的电流$I(\omega )$ 的相位差可判断弹光调制器的谐振状态。实验采用FPGA产生的驱动信号与PEM反馈电流信号测量相位差,以实现频率跟踪。图4是在环境温度为21 ℃时,采集的驱动电压、电流波形图以及激光干涉图。图4中的曲线A为FPGA输出的驱动信号波形;曲线B为高压驱动电压;曲线C为小光程差时的激光干涉图;曲线D为电流反馈曲线。图4(a)是初始时刻测量的波形图和激光干涉图,此时产生的最大光程差为5.695 μm,图4(b)是不带频率调节驱动控制器,经10 min后输出的激光干涉图,从图中可以看出此时的光程差已经减小为5.462 μm;图4(c)是驱动电路采用了锁相技术,对驱动频率进行调节后经过10 min后输出的激光干涉图。此时干涉图的最大光程差与初始时刻相比较略有减小,为5.615 μm。
-
当驱动信号的频率跟随弹光调制器的谐振频率调节时,将使弹光调制器处于较好的谐振状态。但是由参考文献[13]可知,弹光调制器的高压功放电路采用RLC电路,其谐振频率与驱动信号的谐振频率基本一致。但在驱动信号频率变化时将导致高压功放电路,在相同的驱动信号下产生的输出信号的幅值衰减,使弹光调制器的调制深度降低。因此,为了弥补高压功放输出电压的衰减,该设计以参考激光干涉图单周期过零计数的方式检测最大光程差[14-15],基于最大光程差的变化对高压驱动电压进行调节,实现干涉图最大光程差的稳定控制。图5是基于最大光程差调节的功放输出电压变化图。从图5可知,高压功放输出信号的幅值由1.75 kV增加到1.82 kV左右,并趋于稳定;为了验证系统的稳定性,对不同时刻的最大光程差参数进行检测,如图6和表1所示。图6中,曲线a为双闭环驱动控制时最大光程差变化曲线;曲线b为频率调节控制下的最大光程差变化曲线。
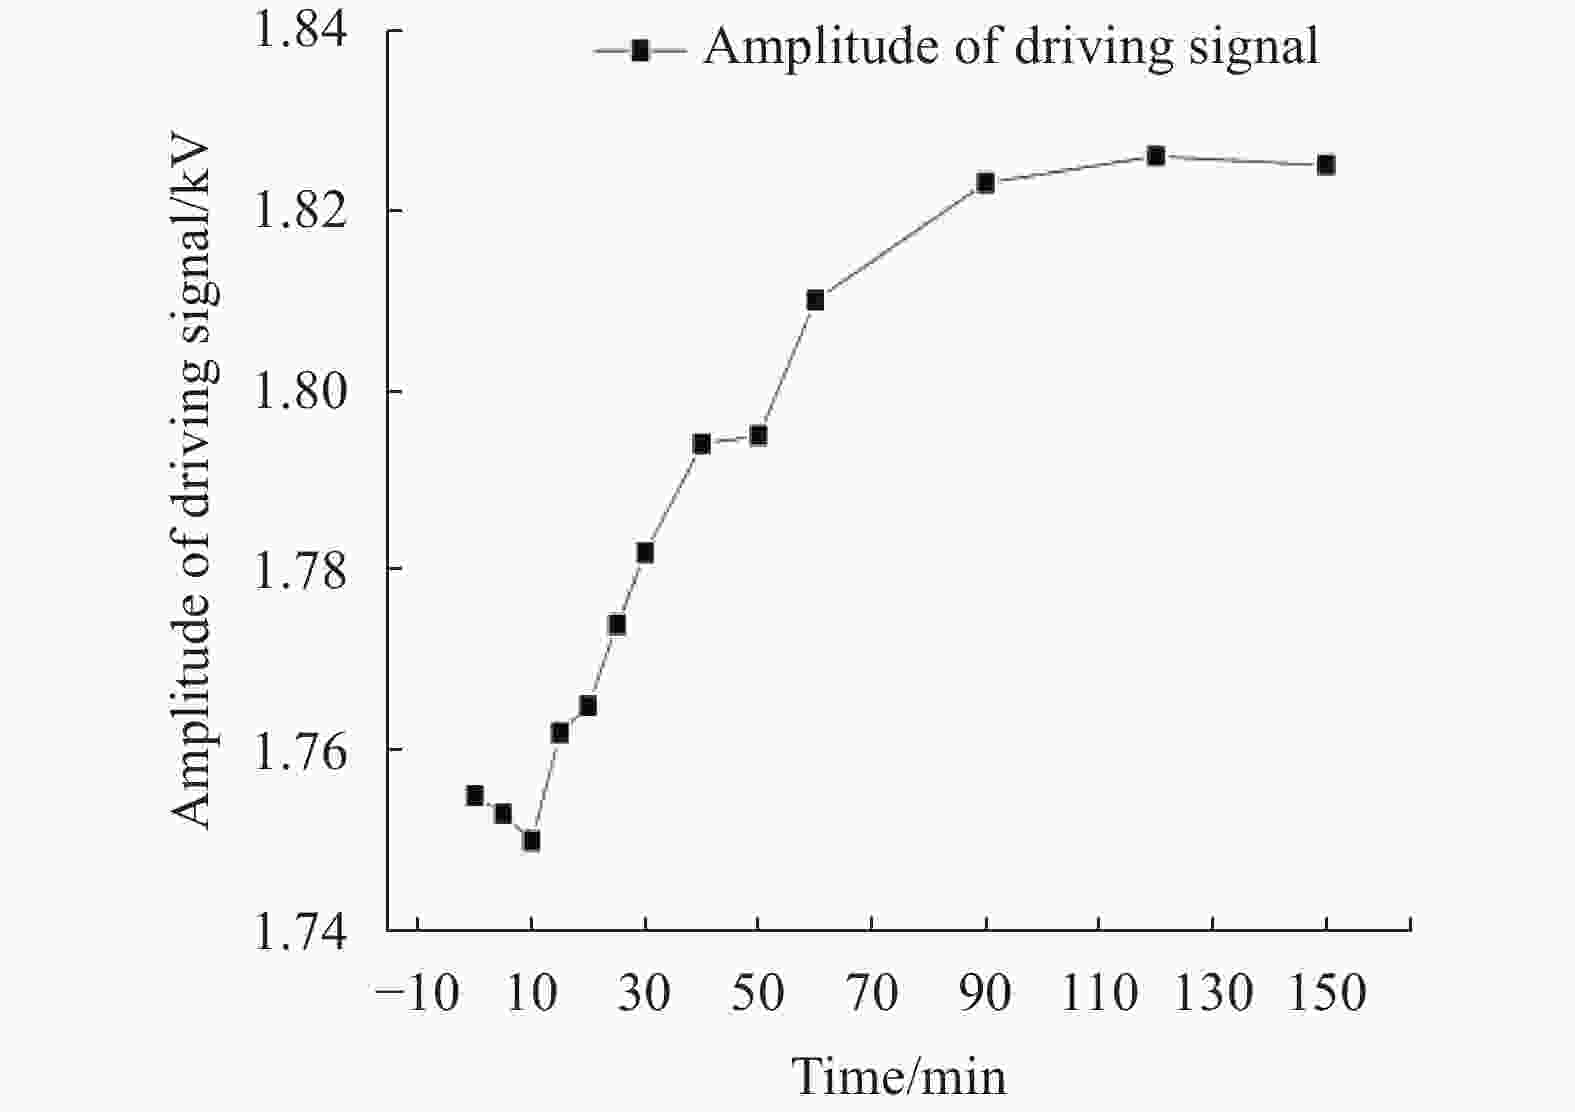
图 5 高压功放的输出信号
Figure 5. Output signal of high-voltage amplifier

图 6 不同驱动方法的最大光程差对比
Figure 6.
${L_{{\rm{MOPD}}}}$ comparison for different driving methods表 1 不同驱动方法、不同时间间隔的最大光程差对比
Table 1. Contrast of the maximum optical path difference with different driving methods and different intervals
Interval/min Double closed-loop driving controll Tuned frequency driv controlling Number of peak of laser interferogram Maximum optical path difference/μm Number of peak of laser interferogram Maximum optical path difference/μm 0 372 235.4 374 236.67 5 373 236.03 373 236.03 10 365 239.97 364 230.33 15 380 240.46 367 232.23 20 371 234.76 343 217.05 25 362 229.07 349 220.85 30 382 241.73 353 223.37 35 369 233.50 340 215.15 40 378 239.20 333 210.72 45 363 229.71 330 208.82 50 381 241.10 339 214.52 55 367 232.24 327 206.92 60 377 238.57 332 210.09 65 368 232.87 333 210.72 70 374 236.67 336 212.62 75 366 231.60 330 208.82 在图6中,曲线a表示仅采用频率跟踪技术时,最大光程差随着时间的变化曲线;曲线b表示采用双闭环驱动控制时,最大光程差随时间的变化曲线;根据曲线的变化趋势可以看出,采用双闭环驱动控制方法,很好地稳定了系统的最大光程差。
从表1可知,当采用双闭环驱动控制系统时,其驱动频率能跟踪谐振频率漂移进行调节,干涉图的最大光程差基本稳定在0.236 mm左右,最大光程差的精密度为3.3%;而仅采用频率调节驱动弹光调制器时,因谐振频率漂移,高压功放电路谐振状态改变,导致最大光程差有减小的趋势。
-
为了验证PEM-FTs的重建光谱的准确性,在实验中将不同波长的光汇聚后作为输入光,经光调制干涉仪产生干涉图。在系统中以808 nm激光作为参考激光,通过激光干涉图测量最大光程差参数。由参考文献[11]可知,离散傅里叶变换的横坐标各个频率点,应以该频率的静态折射率差为参数测量最大光程差,而不是以808 nm的参考波长的静态折射率,计算最大光程差。因此,需要对影响最大光程差参数的静态折射率进行校正。校正前后的光谱图如图7和表2所示。从表中可以看出,未校正重建光谱的误差比较大,当入射光为15 000 cm−1时,相对误差为6.2%,而校正后的相对误差为2.5%;且重建光谱随着波数的增加,误差也从0.05%增加到2.5%。

图 7 校正前后重建光谱图
Figure 7. Rebuilt spectrum before and after correction
表 2 不同波数的窄带光重建后的波数值
Table 2. Reconstructed wavenumber for narrowband lights with different wavenumbers
Wavenumber of the incident light Rebuilt spectrum without correction Rebuilt spectrum with correction 2 020 1 825 2 019 3 000 2 725 3 003 5 000 4 600 5 029 8 000 7 525 8 045 12 376 12 400 12 380 15 000 15 930 14 620 -
文中在研究弹光调制器谐振频率温漂模型的基础上,分析了弹光调制器谐振频率温漂特性,在采用弹光调制器驱动频率自调节的基础上;针对高压功放电路RLC谐振程度降低,输出电压幅值降低的问题,提出了基于参考激光干涉图最大光程差变化的驱动电压幅值调节方法,以实现弹光调制干涉信号的稳定控制和光谱重建。实验验证,在采用该双闭环驱动控制方法时,产生干涉图的最大光程差基本稳定在0.236 mm左右,最大光程差的精密度为3.3%;定标后的重建光谱的最大相对误差为2.5%,满足项目需求。
Study on frequency-drifting characteristics of photo-elastic modulator and stability of Fourier transform spectra
-
摘要: 弹光调制器作为高Q值的谐振器件,在高压谐振下,其谐振频率将随着自身温度升高漂移,影响了弹光调制干涉仪的稳定性和重建光谱的准确性。在建立弹光调制器振动模型和频率温漂模型的基础上,提出了基于频率跟踪和幅值调节的弹光调制器双闭环自适应驱动控制方法。在该方法中,采用数字锁相技术的频率自扫描方法实现驱动频率对弹光调制器谐振频率的跟踪;基于检测参考激光干涉图的最大光程差的变化调节驱动信号的幅值,以实现重建光谱的稳定控制,同时基于参考激光的最大光程差参数实现重建光谱的定标。在实验中该驱动控制方法应用到弹光调制傅里叶变换光谱仪中,实现了驱动频率对弹光调制器谐振频率的实时跟踪和高压功放电路的幅值调节,使得干涉图的最大光程差稳定在0.236 nm左右,其精密度为3.3%;重建光谱的最大相对误差为2.5%。此实验验证了该方法能有效稳定弹光调制傅里叶变换光谱仪的光谱分辨率。Abstract: Photo-elastic modulator (PEM) is a high-Q resonant device. When driven by a high voltage resonant signal, its resonant frequency will drift with its temperature change, and the stability of the interferometer and the accuracy of the rebuilt spectrum are affected. The vibration model and frequency- drifting model of the photo-elastic modulator were first established, and a frequency-tracking and adjustable-amplitude double closed-loop driving control method was proposed. In the method the digital phase-locking technique was adopted to track the changing resonant frequency of the photo-elastic modulator. Based on the change of the maximum optical path difference for the reference laser interferometer, the amplitude of the driving signal was adjusted to realize the stable control of the rebuilt spectrum. At the same time, the calibration of the reconstructed spectra was realized based on the maximum optical path difference. In the experiment the double closed-loop adaptive drive control method was applied to the driving control system of the photo-elastic modulated Fourier transform spectrometer (PEM-FTs), which realized the real-time tracking of the driving-frequency to the resonant frequency for PEM and the amplitude adjustment of the high-voltage amplifier. The maximum optical path difference of the interference diagram was stable at about 0.236 nm, and its precision was 3.3%. The maximum relative error of the reconstructed spectra was 2.5%. The experiment shows that the method can effectively stabilize the spectral resolution of the PEM-FTs.
-
图 1 双闭环自适应驱动控制系统结构图
Figure 1. Chart of the double closed loop adaptive driving control system
图 4 带频率自动跟踪与固定频率实验效果图
Figure 4. Experimental figures of the auto tracking frequency method and fixed frequency method
图 6 不同驱动方法的最大光程差对比
Figure 6.
${L_{{\rm{MOPD}}}}$ comparison for different driving methods表 1 不同驱动方法、不同时间间隔的最大光程差对比
Table 1. Contrast of the maximum optical path difference with different driving methods and different intervals
Interval/min Double closed-loop driving controll Tuned frequency driv controlling Number of peak of laser interferogram Maximum optical path difference/μm Number of peak of laser interferogram Maximum optical path difference/μm 0 372 235.4 374 236.67 5 373 236.03 373 236.03 10 365 239.97 364 230.33 15 380 240.46 367 232.23 20 371 234.76 343 217.05 25 362 229.07 349 220.85 30 382 241.73 353 223.37 35 369 233.50 340 215.15 40 378 239.20 333 210.72 45 363 229.71 330 208.82 50 381 241.10 339 214.52 55 367 232.24 327 206.92 60 377 238.57 332 210.09 65 368 232.87 333 210.72 70 374 236.67 336 212.62 75 366 231.60 330 208.82  下载: 导出CSV
表 2 不同波数的窄带光重建后的波数值
Table 2. Reconstructed wavenumber for narrowband lights with different wavenumbers
Wavenumber of the incident light Rebuilt spectrum without correction Rebuilt spectrum with correction 2 020 1 825 2 019 3 000 2 725 3 003 5 000 4 600 5 029 8 000 7 525 8 045 12 376 12 400 12 380 15 000 15 930 14 620
下载: 导出CSV
-
[1] Wang B, Jennifer L. Basic optical properties of the photoelastic modulator: Part I. Useful aperture and acceptance angle[C]//Polarization Science and Remote Sensing Ⅱ, SPIE, 2005, 5888: 1-8 [2] Buican T N. Multivariate PEM/FT spectrometry: intrinsic data fusion and applications for Ied and CB defense[C]//Proceedings for the Army Science Conference(26th), 2006: ADA481200. [3] Buican T N. High retardation–amplitude photoelastic modulator: US 7764415B2[P]. 2010-07-27. [4] Zhang Rui, Li Kewu, Chen Yuanyuan, et al. Ultra-high-speed spectro polarimeter based on photoelastic modulator [J]. Applied Optics, 2016, 55(30): 8426-8432. doi: 10.1364/AO.55.008426 [5] Hu C G, Sun L D, Li Y N, et al. Retardation correction for photoelastic modulator-based multi-channel reflectance difference spectroscopy [J]. Opt Soc, 2008, 25(6): 1240-1245. doi: 10.1364/JOSAA.25.001240 [6] Wang Baoliang, Wolf Jacob, Lakanen Bob. Basic optical properties of the photoelastic modulator part Ⅲ: Thermal properties[C]//Current Developments in Lens Design and Optical Engineering XⅢ, SPIE, 2012, 8486: 1-9. [7] Wang Yanchao, Wang Zhibin, Zhang Jilong, et al. Temperature compensation strategy and implementation for photoelectric modulation interferometer with large optical path difference [J]. Spectroscopy and Spectral Analysis, 2013, 33(5): 1429-1432. (in Chinese) [8] Chen Guangwei, An Yongquan, Wang Zhibin, et al. Self-tracking technology of photoelastic modulation frequency [J]. Opto-Electronic Engineering, 2015, 42(10): 21-26. (in Chinese) [9] Hirschy L, Wang B L, Wolf J, et al. Basic optical properties of the photo-elastic modulator part Ⅲ: Thermal properties[C]//SPIE, 2012, 8486: 848619. [10] Zhang M J, Jing N, Li K W, et al. Thermal stability control system of photo-elastic interferometer in the PEM –FTs [J]. Review of Scientific Instruments, 2018, 89: 013105. doi: 10.1063/1.5020714 [11] Hao Qian, Zhang Minjuan, Li Jinhua, et al. A calibration method for the photoelastic modulation Fourier transform spectrometer: China, ZL201710572176.8[P]. 2018-08-31. (in chinese) [12] Buican T N. Birefringence interferometers for ultra-high-speed FT spectrometry and hyperspectral imaging: I. Dynamic model of the resonant photo-elastic modulator [J]. Vibrational Spectroscopy, 2006, 42: 51-58. doi: 10.1016/j.vibspec.2006.04.011 [13] Zhang Minjuan, Wang Yanchao, Chen Youhua, et al. The drive circuit of the invert-phase serial photoelastic modulation interferometer: China, ZL201310211162.5[P]. 2016-01-20. (in Chinese) [14] Zhang Minjuan, Wang Zhibin, Li Xiao, et al. The stability and measuring technology of the maximum optical path difference of photo-elastic modulator interferograms [J]. Spectroscopy and Spectral Analysis, 2015, 35(5): 1436-1439. (in Chinese) [15] Wang Nan, Wang Yanchao, Zhang Minjuan, et al. A stability control method of photo-elastic modulator based on voltage compensation [J]. Laser & Infrared, 2020, 50(4): 419-424. (in Chinese) -

 点击查看大图
计量
- 文章访问数: 385
- HTML全文浏览量: 118
- PDF下载量: 31
- 被引次数: 0