


-
辐射测温在航空航天、冶金铸造等领域有大量应用,常用的是单波长或双波长辐射测温方法,测量准确度主要受目标发射率的影响[1]。为减小发射率影响,Reynolds首次提出了多波长测温原理,基于多个波长辐射信号,辅以目标发射率背景知识,计算出目标真温,可有效减小或消除发射率的影响。国外的Cashdolar和国内的戴景民等人对多波长点测温进行了大量研究,研制开发了点测温三波长、四波长、六波长辐射温测温仪,取得了很好的应用效果[2-3]。
随着面阵探测器技术的进步,以及工业应用中迫切需要进行多点面温度测量,多波长成像测温成为一个重要的研究方向[4-5]。早期主要是采用旋转滤光片和单个面阵探测器,实现扫描式多波长温场测量,对高动态温场测量存在局限性[6]。美国JPL实验室利用一种先进的四色量子阱探测器,来进行多波长温场成像测量[7];探测器每个像元可以输出四个波长的能量信号,假设目标发射率为非线性光谱发射率模型,可对动态目标温场进行四波长同步成像和测温,应用效果较好。但其中的四色多元红外面阵探测器难以购置,在国内尚未实现工程化。
在国内,为了实现多波长成像测温,大多采用可见光三色CCD实现多波长测温,假设目标光谱发射率模型为线性模型,称为三基色或谱色测温法[8]。在一定应用条件下,三基色法多波长成像测温可对特定测量目标进行较为准确的温场测量,主要优点是采用的原理简单、探测器件成本低等;主要缺点包括:(1)三基色法测温模型对非线性光谱发射率目标适用性较差;(2)探测的三个波段存在一定的带宽,探测波段存在重叠区,探测波段不满足严格独立条件,影响测温反演准确度;(3)测温的动态范围较窄,经常会出现红基色信号饱和而绿基色或蓝基色信号较低的情况。综上,三基色法是在国内四色面阵探测器无法工程化的前提下,进行多波长高温温场测量的一个权宜之计,非常有必要研究新的多波长成像测温方法。
提出了一种光阑处非等比例四色分光成像测温方法,可实现四波长同步成像探测和温场测量,阐述了其工作原理和测温模型。对多波长成像测温仪硬件和软件分别进行了设计,给出了测温仪标定的模型,利用激光加热方法对测温仪功能和测温准确度进行了验证测试。
-
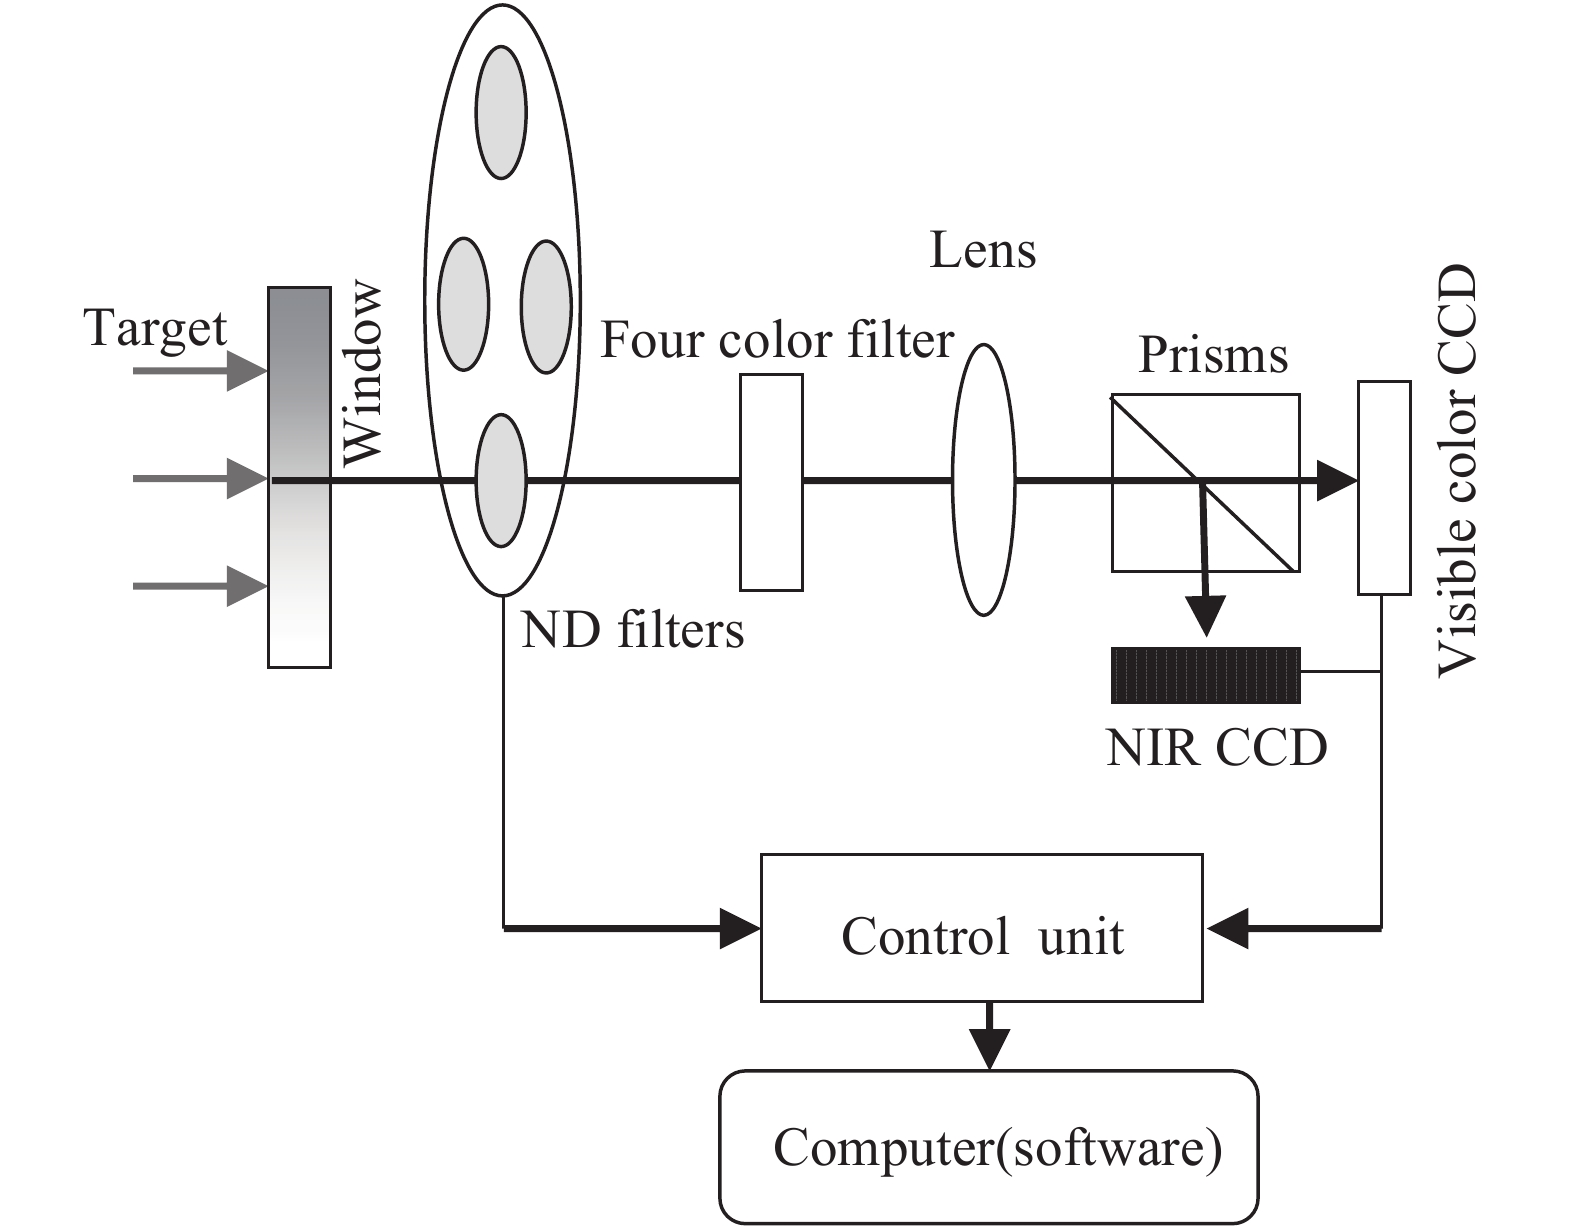
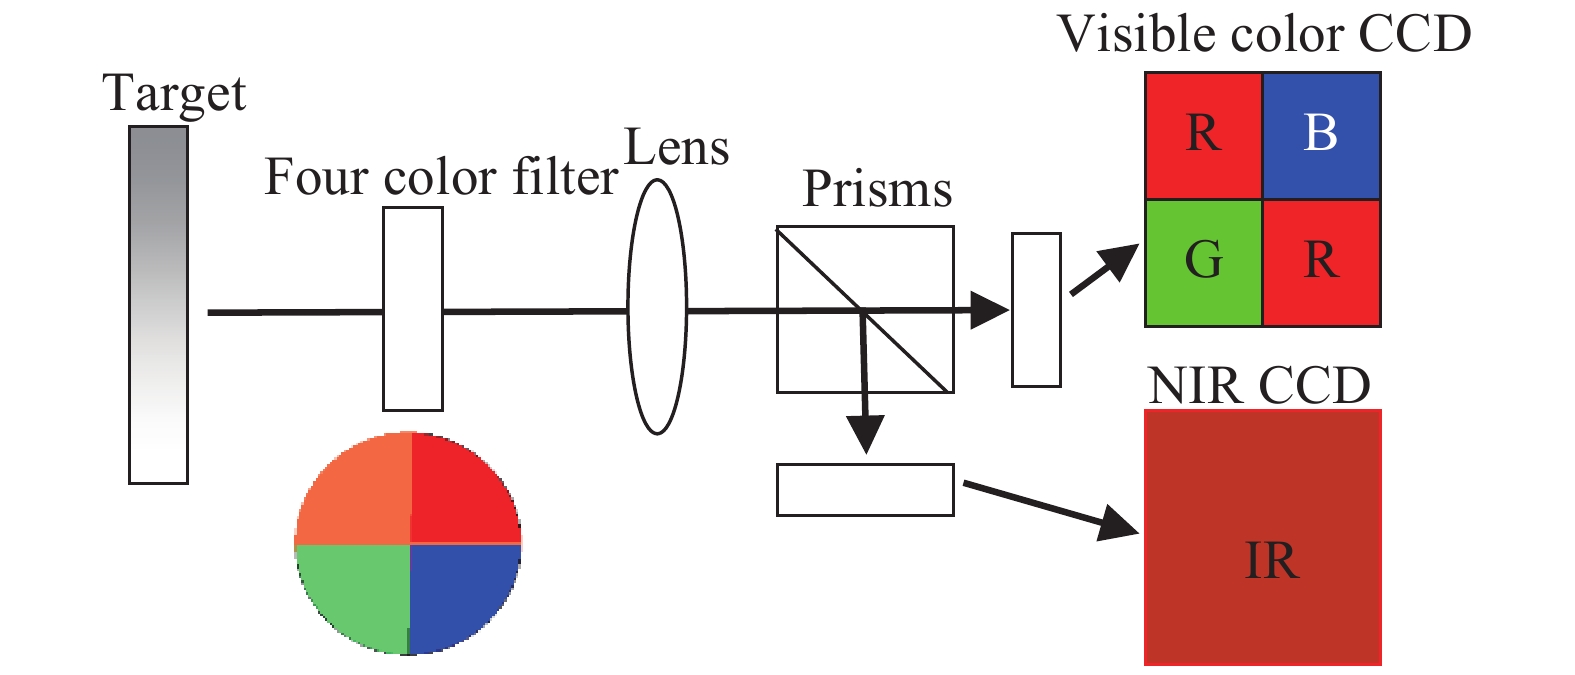
四波长探测成像的原理如图1所示。被测目标发出的辐射光线,在孔径光阑位置由四象限式四色滤光片滤光,形成包含四个窄带波段的目标光辐射,经过物镜镜头汇聚成像后,通过棱镜的无像差分光,分别汇聚在可见CCD和近红外CCD上,形成目标的可见彩色像和近红外图像,通过软件的图像融合,即形成了对辐射目标物体的四色探测成像。
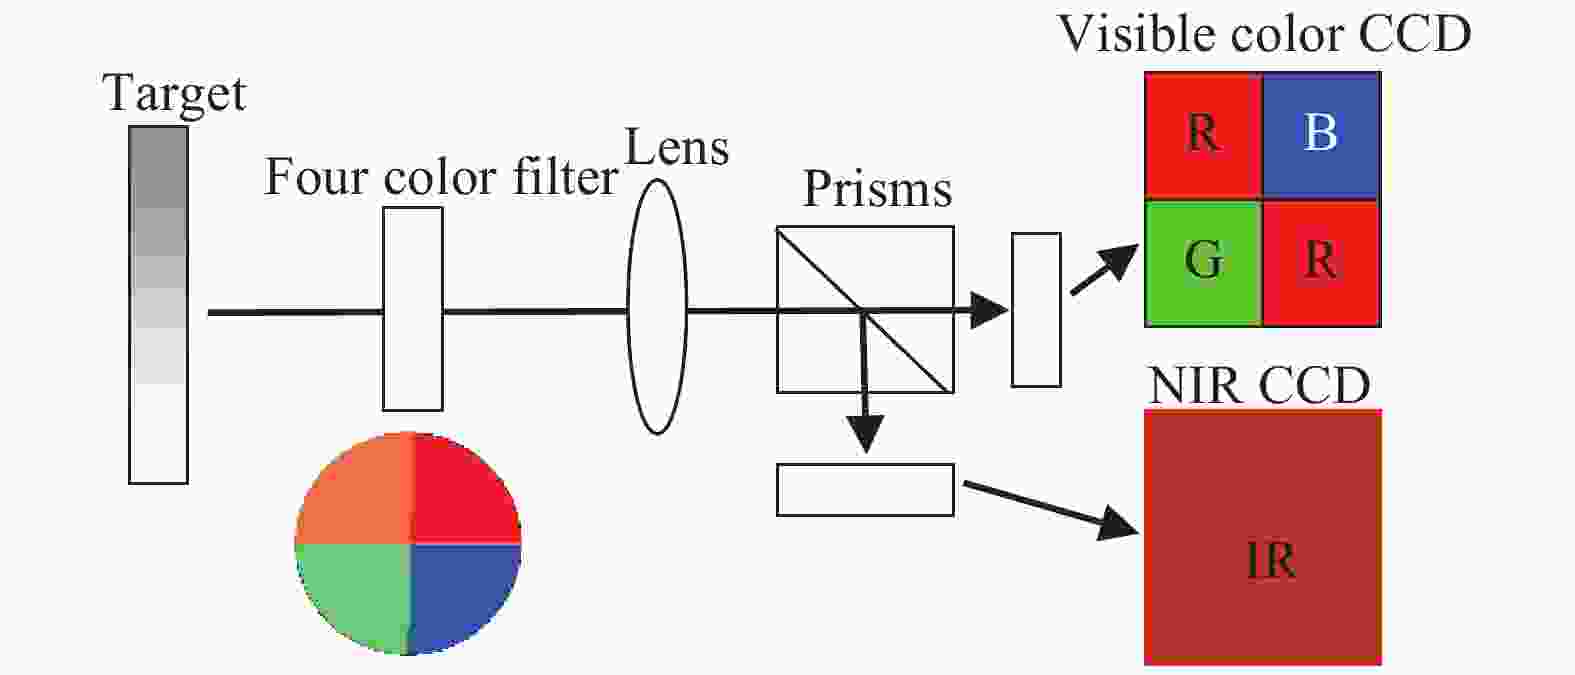
图 1 四波长探测成像原理
Figure 1. Four-wavelength detection imaging principle
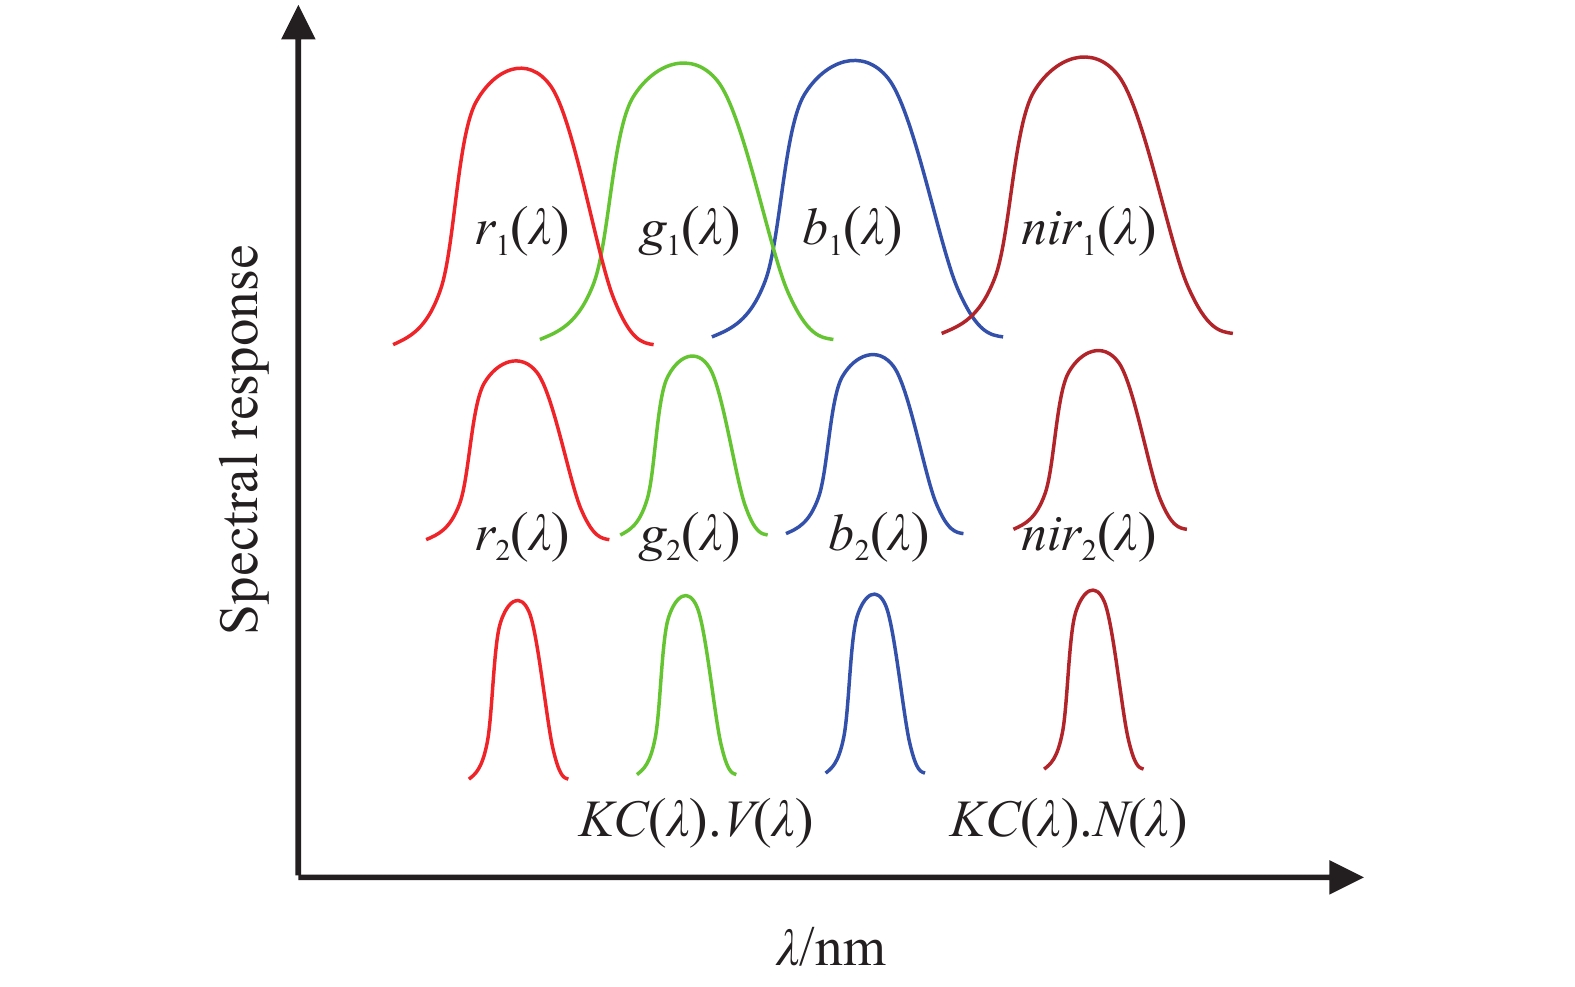
物镜镜头和分光棱镜的光谱透过函数曲线可认为在可见和近红外波段为一条平坦曲线,即两者的总光谱透过函数为一常数
$K$ ,四色滤光片的光谱透过函数设为$C(\lambda )$ ,则:$$ C(\lambda ) = {C_1}{r_1}(\lambda ) + {C_2}{g_1}(\lambda ) + {C_3}{b_1}(\lambda ) + {C_4}ni{r_1}(\lambda ) $$ (1) 式中:
${r_1}(\lambda )$ 、${g_1}(\lambda )$ 、${b_1}(\lambda )$ 、$ni{r_1}(\lambda )$ 分别为红光、绿光、蓝光和近红外波段的光谱透过函数(光谱透过函数曲线没有重叠区);${C_1}$ 、${C_2}$ 、${C_3}$ 、${C_4}$ 为常数。在可见CCD焦平面上,每个像元的光谱响应函数设为
$V(\lambda )$ ,则:$$ \begin{split} V(\lambda ) =& {V_1}{r_2}(\lambda ) + {V_2}{g_2}(\lambda ) + {V_3}{b_2}(\lambda ) + 0.ni{r_2}(\lambda ) =\\ &{V_1}{r_2}(\lambda ) + {V_2}{g_2}(\lambda ) + {V_3}{b_2}(\lambda ) \end{split} $$ (2) 式中:
${r_2}(\lambda )$ 、${g_2}(\lambda )$ 、${b_2}(\lambda )$ 分别为可见光CCD单个像元的红光、绿光、蓝光波段的光谱响应函数(光谱响应函数曲线有部分重叠区);${V_1}$ 、${V_2}$ 、${V_3}$ 为常数。在近红外CCD焦平面上,每个像元的光谱响应函数设为
$N(\lambda )$ ,则:$$N(\lambda ) = 0.{r_2}(\lambda ) + 0.{g_2}(\lambda ) + 0.{b_2}(\lambda ) + {V_4}ni{r_2}(\lambda ) = {V_4}ni{r_2}(\lambda )$$ (3) 式中:
$ni{r_2}(\lambda )$ 为近红外CCD单个像元的光谱响应函数;${V_4}$ 为常数。则多波长测温仪在可见光波段的光谱响应函数为
$KC(\lambda ).V(\lambda )$ ,在近红外波段的光谱响应函数为$KC(\lambda ).N(\lambda )$ ,如图2所示。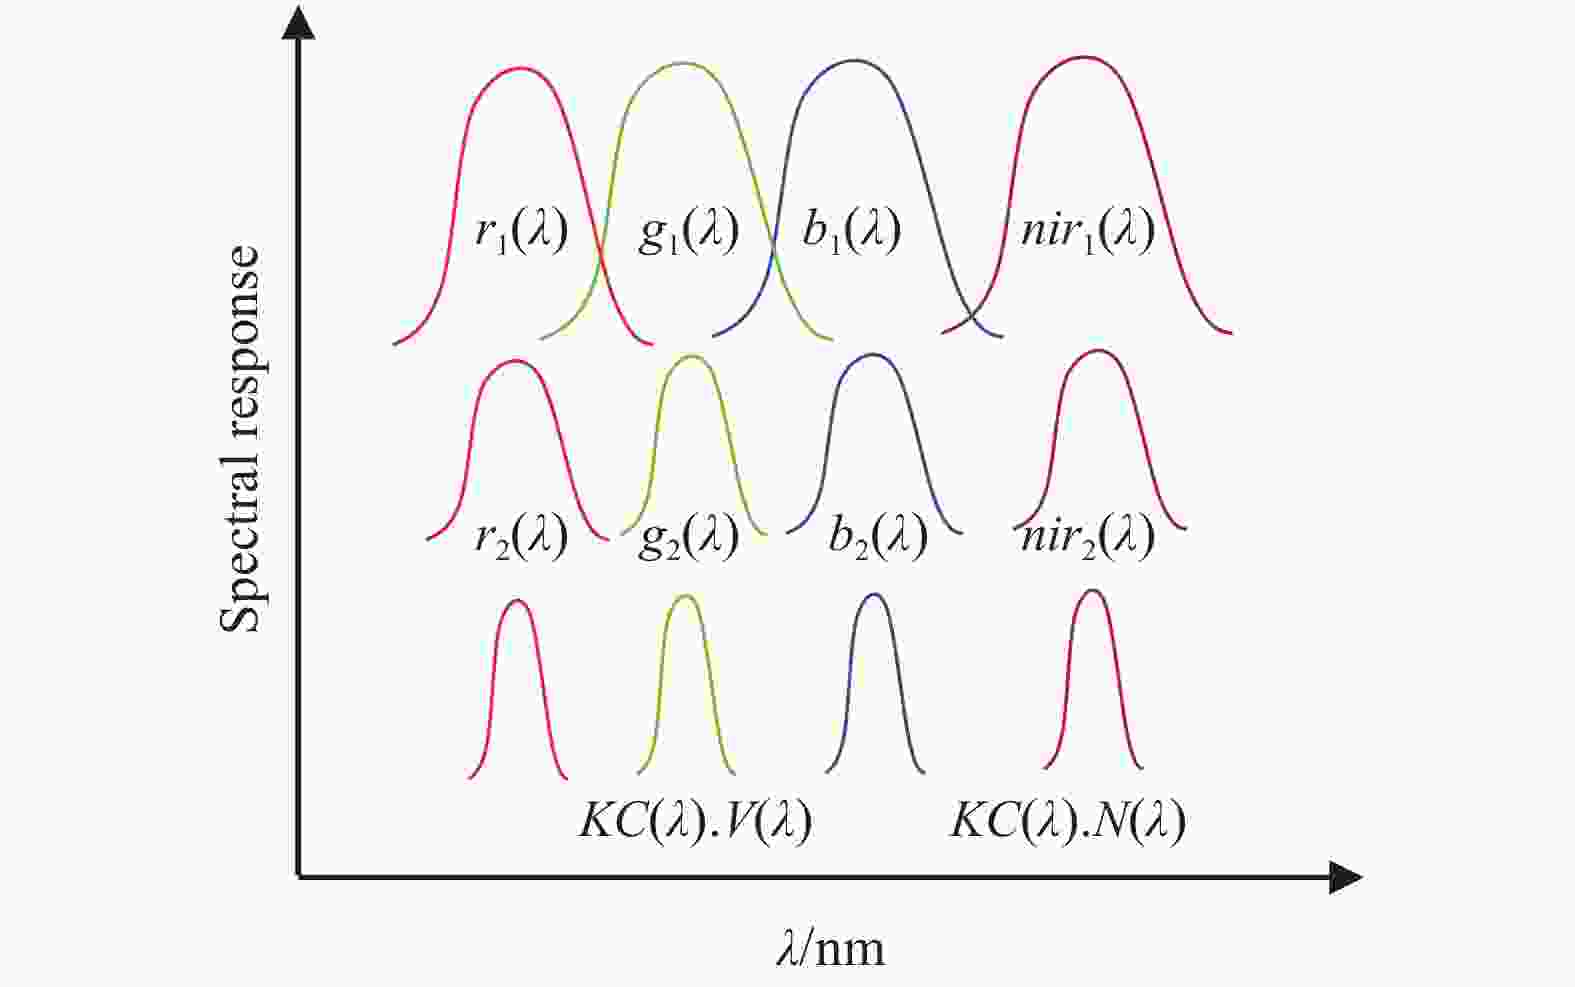
图 2 四波长成像测温仪光谱响应
Figure 2. Spectral response of four-wavelength imaging thermometer
从图2可看出经过光阑处的四色滤光,测温仪探测到的是四个近似于单个波长点输出的窄波段光谱图像,为四波长测温提供了独立不相关的四个谱段的空间分布光谱辐射信号。
-
多光谱辐射测温是通过测量目标多个光谱的辐射量值,利用发射率假设模型对发射率和温度进行求解,实现对目标温度场的测量,以下对四波长成像测温仪的测温模型进行了简要阐述。
四波长成像测温仪的每个像元的输出分为四个独立的光谱通道。
其中第
$i$ 个通道的输出信号可表示为:$${S_i} = {K_i} \cdot \varepsilon \left( {{\lambda _i},T} \right) \cdot {c_1} \cdot \lambda _i^{ - 5} \cdot {\left( {\exp \left( {{c_2}/\lambda T} \right) - 1} \right)^{ - 1}},i = 1,2, \cdots ,n$$ (4) 式中:
${K_i}$ 为该通道的几何因子,它与该波长下的光谱响应率及几何因素有关,可以通过标定得到;$\varepsilon \left( {{\lambda _i},T} \right)$ 为目标真实温度为$T$ 时的光谱发射率;${c_1}$ 和${c_2}$ 分别为第一和第二辐射常数;${\lambda _i}$ 为该通道的有效波长。为了简化处理,在短波波段用维恩公式来近似代替普朗克公式,则公式(4)可改写为:
$${S_i} = {K_i} \cdot \varepsilon \left( {{\lambda _i},T} \right) \cdot {c_1} \cdot \lambda _i^{ - 5} \cdot {\left( {\exp \left( {{c_2}/\lambda T} \right)} \right)^{ - 1}},i = 1,2, \cdots ,n$$ (5) 设每个通道输出信号对应一个亮温值
${T_i}$ ,则:$${S_i} = {K_i}M({T_i},{\lambda _i})$$ (6) 四波长测温仪有四个通道(RGB和NIR),四个通道就可以测得四个亮温值
${T_1}$ ,${T_2}$ …,${T_4}$ ,第$i$ 个通道测得的亮温${T_i}$ 与目标真温$T$ 之间的关系表达式为:$$ \frac{1}{T} = \frac{1}{{{T_i}}} = \frac{{{\lambda _i}\ln \varepsilon \left( {{\lambda _i},T} \right)}}{{{c_2}}},i = 1,2, \cdots ,n $$ (7) 这样,整个四波长测温仪共有四个方程,而未知数共有五个(四个光谱发射率和真温),无法求解。因此必须借助另一个假定方程。
对于四波长测温,采用如下非线性发射率假设模型:
$${\rm{ln}}\varepsilon {\rm{(}}{\lambda _i}{{,T)}} = {a_0} + {a_1}{\lambda _i} + {a_2}{\lambda _i}^2$$ (8) 式中:
${a_0}$ 、${a_1}$ 、${a_2}$ 为常数。采用如上的光谱发射率非线性模型能适应大部分被测目标,可有效减小线性光谱发射率模型假设所带来的误差。联立公式(7)和(8),建立四个方程,包括
${a_0}$ 、${a_1}$ 、${a_2}$ 和T四个未知数,通过代数方法可求解得到每个像元的真温T [9-10]。 -
四波长成像测温仪设计的参数要求见表1。
表 1 成像测温仪设计参数
Table 1. Imaging thermometer design parametes
Parameter Value Waveband/nm 400-900 Field of view/(°) 5±0.1 Frequency/Hz 30 Temperature range/℃ 800-2500 基于光阑处四色分光原理的多波长成像测温仪设计方案如图3所示。四波长成像测温仪主要由窗口、中性衰减片、四色滤光片、光学物镜镜头、可见/近红外集成传感器、测量控制单元及软件等部分组成。通过可见和红外复用的成像系统,经过多色分光后,由软件采集目标图像并进行图像融合和对准处理,提取出四个波长的单色成像图像,根据每个通道的信号质量(非饱和且在探测器线性响应区内),由软件智能选择相应的多波长测温算法,得到目标的真温温场分布。将测量主机放置在远端,即可远距离遥测得到目标的快速温场分布。

图 3 四波长成像测温仪设计方案
Figure 3. Design scheme of four-wavelength imaging thermometer
四色滤光片每个象限的中心波长设计与CCD响应光谱曲线中心波长相同,分别为460、533、605、800 nm,带宽约20 nm。CCD每个单色像元本身也有一个接收带宽,两者组合之后,每个单色通道的带宽约为10 nm,保证了四色成像的单色性和独立性。
-
光学镜头的设计图如图4所示,需要满足在四个波段消色差且在CCD的耐奎斯特频率处清晰成像等要求。物镜镜头成像视场角2
$\omega $ 设计为5°,CCD尺寸为4.76 mm×3.57 mm,对角线长度为5.95 mm,在CCD传感器上的半像高$y$ 为5.95/2=2.975 mm,则根据物像关系式:$${y^{}} = f \times {\rm{tan}}\omega $$ (9) 计算得到镜头的焦距设计为68.1387 mm。CCD像元尺寸为4.65 μm,耐奎斯特频率为1/(2×4.65 μm)=107.52 lp/mm,要求乃奎斯特频率处传递函数不低于0.2。
设计的光学镜头光学传递函数接近衍射极限,满足设计要求。镜头首先固定在内部套筒上,内部套筒与外部套筒用螺纹相结合,外部套筒用C接口与CCD相机接口连接,通过调整内部套筒的前后位置实现调焦。
图 4 光学物镜镜头设计图
Figure 4. Optical objective lens design drawing
-
四色滤光片主要是将目标辐射中其他波长辐射滤除,保留成像用四个波段辐射信号。由于在镜头光阑处进行滤色,为保证滤色性能,滤色片设计的尽量薄。考虑到测量的目标温度最低800 ℃,最高2500 ℃,假设目标为灰体,滤光片带宽为20 nm,选取目标温度为适中的1200 ℃,计算红外波段(605 nm)与蓝光波段(460 nm)的辐射能量比为:
$$ \begin{array}{l} {{{R}}_{{\rm{rb}}}} = \dfrac{{ \displaystyle\int_{0.595}^{0.615} {{{M(}}\lambda {\rm{,}}{{{T}}_{\rm{0}}}{\rm{)d}}\lambda } }}{{ \displaystyle\int_{0.450}^{0.470} {{{M(}}\lambda {\rm{,}}{{{T}}_{\rm{0}}}{\rm{)d}}\lambda } }} = \dfrac{{ \displaystyle\int_{0.595}^{0.615} {{{M(}}\lambda {\rm{,1\;200)d}}\lambda } }}{{ \displaystyle\int_{0.450}^{0.470} {{{M(}}\lambda {\rm{,1\;200)d}}\lambda } }} = 40.6 \end{array} $$ (10) 由公式(10)可知,测温仪红光波段信号远远高于蓝光波段信号,为保证探测器都处在最佳的线性输出区,保证测量的动态范围能覆盖更宽的温度范围,将滤光片设计成特殊的不等比透光型的滤光片,如图5所示。
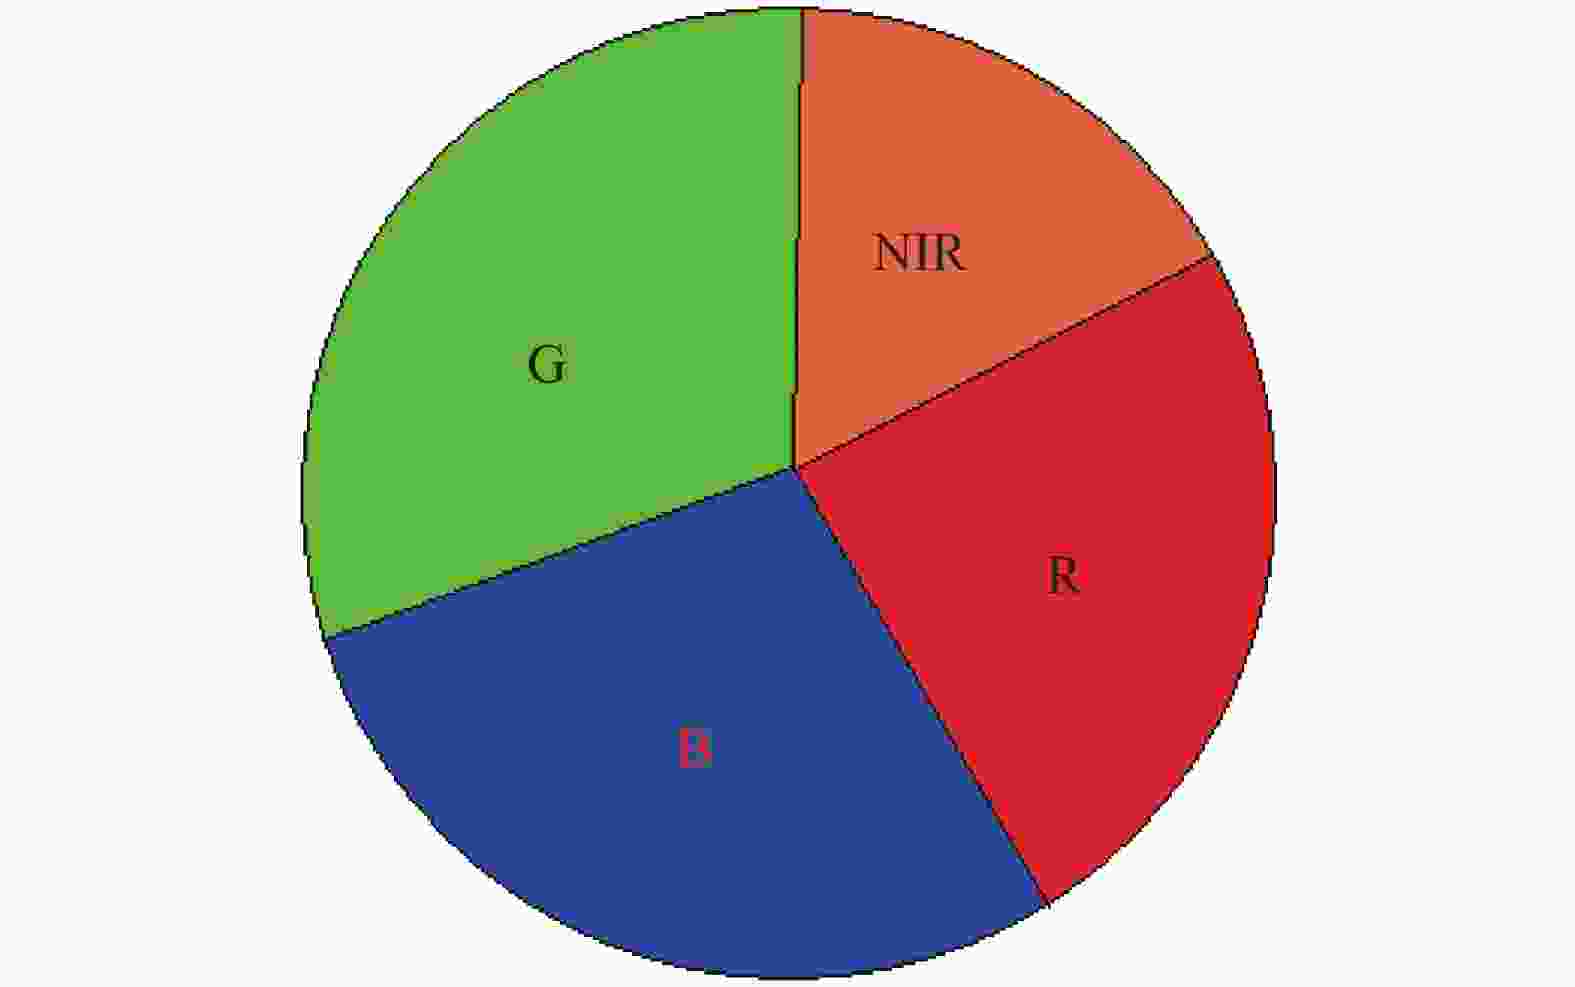
图 5 四色滤光片设计形式
Figure 5. Four-color filter design form
-
选用的CCD传感器是一款可见和近红外集成的CCD传感器,其工作光谱范围为可见光和近红外波段,每个波段的带宽较宽,约在70~110 nm范围内。
四色滤光片设计的中心波长与传感器的中心波长相同,与传感器耦合后,总的单色滤光带宽约为10 nm,可获得较为窄带的目标单色辐射,提高了多波长测温数据处理的准确度。
-
软件流程设计图如图6所示。软件功能模型包括测量控制、系统标定及算法模型等,结合硬件测量装置完成系统功能[11-12]。

图 6 四波长成像测温仪软件流程图
Figure 6. Software flow chart of four-wavelength imaging thermometer
软件界面包括可见光和近红外两个图像采集显示界面。
软件算法模型具备四个波长的多波长温度计算能力,同时还可根据各个通道信号值大小,智能选取高质量信号通道,进行三波长或双波长温度计算处理,通过最小二乘法拟合计算出目标真温和光谱发射率。
-
测温仪使用前需对每个通道光谱响应函数进行标定,以建立输出信号和测量通道辐射亮温之间的关系。选择黑体作为标定用标准辐射源,其光谱辐射亮度根据普朗克定律计算得到[13-14]。
调节标准黑体温度为
${T_i}$ ,由软件得到测温仪某个通道的输出灰度信号${V_{bb}}({T_i})$ ,根据普朗克公式计算出各温度的光谱辐射亮度${L_{\lambda bb}}({T_i})$ ,建立如下方程组:$$ \left\{ \begin{array}{l} {V_{bb}}({T_1}) = R(\lambda ){L_{\lambda bb}}({T_1}) + {V_\lambda }({T_e})\\ {V_{bb}}({T_2}) = R(\lambda ){L_{\lambda bb}}({T_2}) + {V_\lambda }({T_e})\\ \vdots \\ {V_{bb}}({T_n}) = R(\lambda ){L_{\lambda bb}}({T_n}) + {V_\lambda }({T_e}) \end{array} \right. $$ (11) 式中:
$R(\lambda )$ 、$V({T_e})$ 分别为测温仪单个光谱通道的光谱响应函数、零点输出信号,则:$$ R(\lambda ) = \frac{{\overline {{L_{\lambda bb}}({T_i}){V_{bb}}({T_i})} - \overline {{L_{\lambda bb}}({T_b}_i){V_{bb}}({T_i})} }}{{\overline {{L^2}_{\lambda bb}({T_i})} - {{\overline {{L_{\lambda bb}}({T_i})} }^2}}} $$ (12) $$ {V_\lambda }({T_e}) = \frac{{\overline {{L^2}_{\lambda bb}({T_i})} \overline {{V_{bb}}({T_i})} - \overline {{L_{\lambda bb}}(T)} \overline {{L_{\lambda bb}}({T_i}){V_{bb}}({T_i})} }}{{{L^2}_{\lambda bb}({T_i}) - {{\overline {{L_{\lambda bb}}({T_i})} }^2}}} $$ (13) 式中:
$\overline {{L_{\lambda bb}}({T_i})} $ 为各温度点黑体光谱辐射亮度的平均值;$\overline {{V_{bb}}({T_i})} $ 为各温度点测温仪某个通道输出信号的平均值。测量黑体在测温仪四个通道的输出信号,由上式依次计算出各通道的光谱响应函数。
-
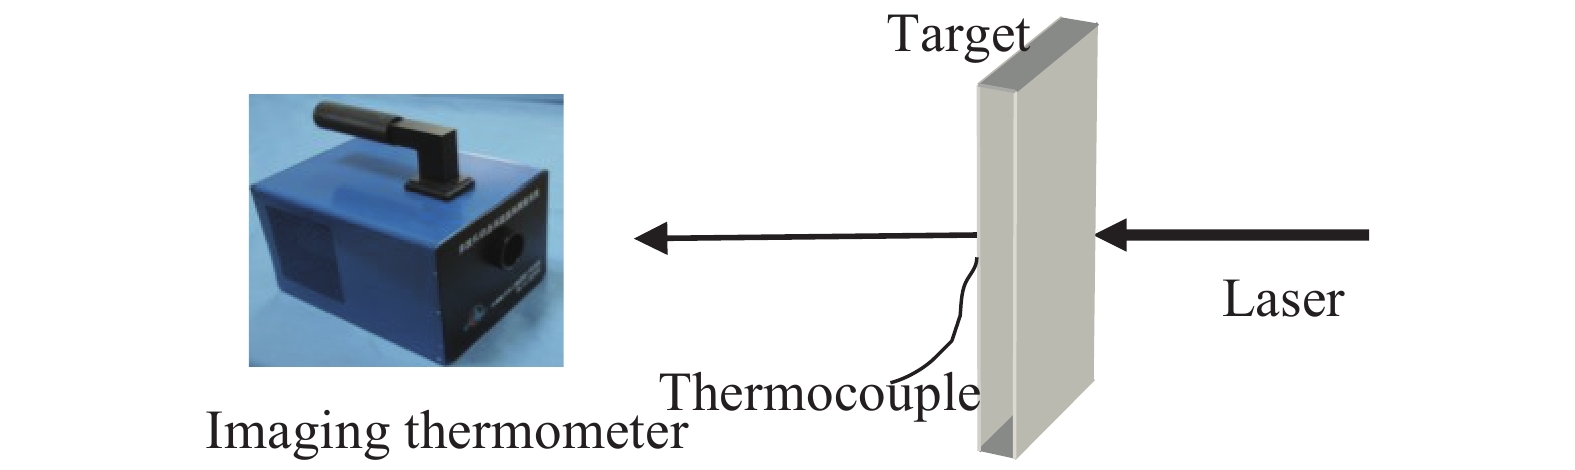
采用高精度热电偶和多波长成像测温仪对激光背面加热高温目标同时进行温度测量,以验证评估测温仪的测温准确度。测温仪用于与热电偶温度测量结果对比的数据为相同测试区域的平均温度,如图7所示。

图 7 成像测温仪高温测量试验原理
Figure 7. Principle of high temperature measurement experiment of imaging thermometer
试验过程中,成像测温仪采集到的目标可见光图像及近红外图像如图8所示。在图像处理过程中,首先根据图像特征信息将两幅图像对准;然后根据标定曲线将每个像素点的四个波长点的灰度数据变为亮温数据;最后由四个波长的亮温数据,根据算法模型得到被测目标的真实温度场。

图 8 目标可见光及近红外图像
Figure 8. Visible image and near infrared image of target
测温仪用于与热电偶测量结果的比较如图9所示。由图9可以看出,多波长成像测温仪与热电偶测量结果最大相差不超过1%,验证了成像测温仪设计原理的正确性。在测量过程中,四个通道输出都在探测器线性区内,较彩色CCD多波长测温具有更好的动态范围适应性。四个波段积分探测由内部时钟控制,快速温升过程中,各帧信号探测具有同步一致性,保证了测量准确度。
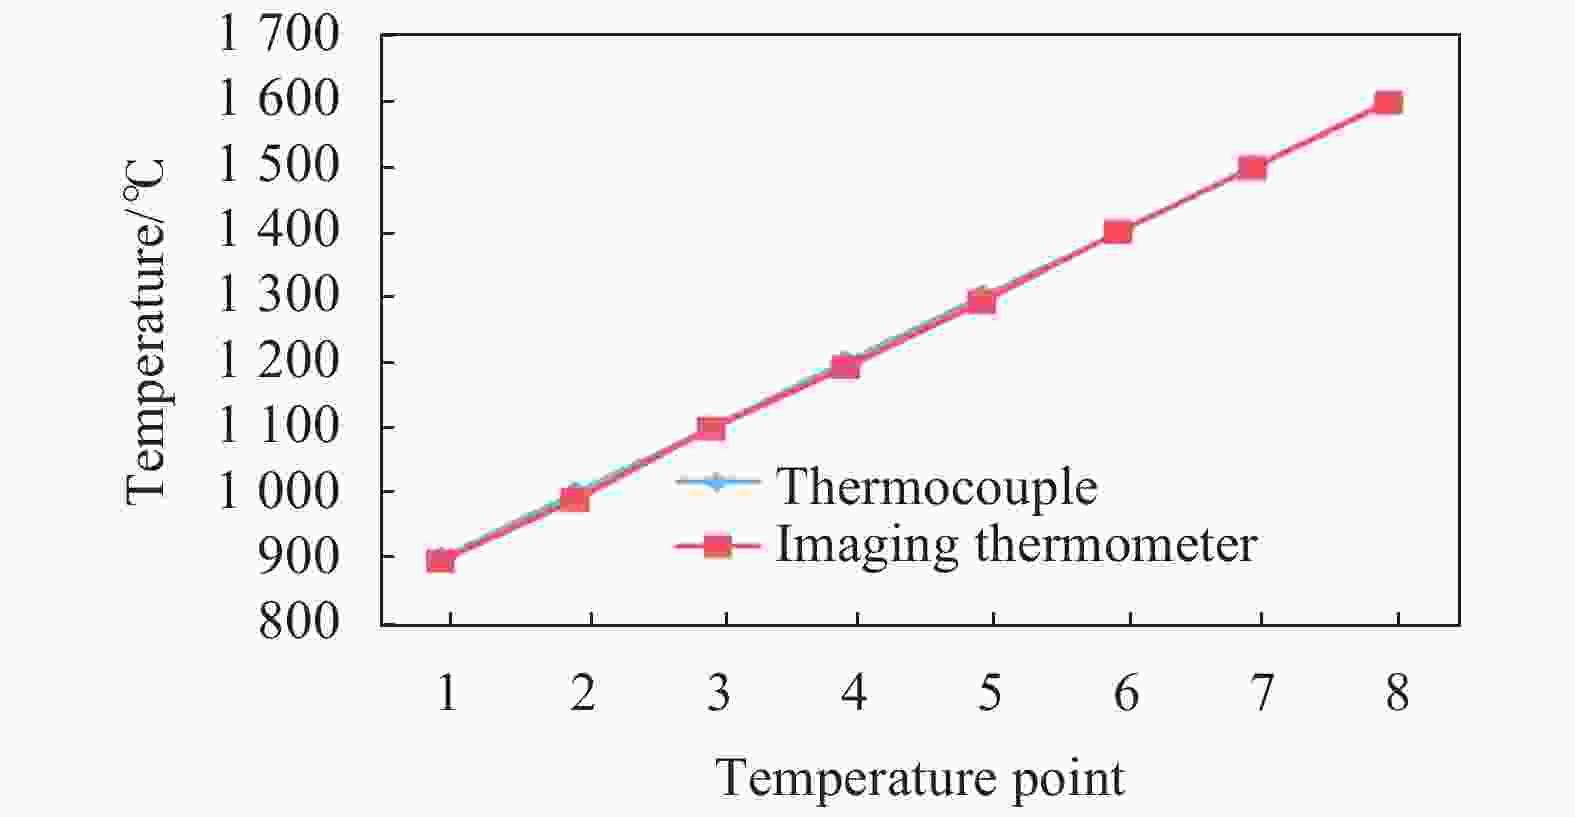
图 9 四波长测温仪与热电偶测试结果的比较
Figure 9. Comparison of test results between four-wavelength thermometer and thermocouple
-
针对彩色CCD多波长测温存在的不足,设计了一种光阑处四色分光的无扫描多波长测温仪。采用四色测温理论,建立了高温目标非线性发射率假设模型。单波段成像探测带宽由70 nm压缩到10 nm,实现四个窄带波长的单色同步成像,提高了多波长测温反演的准确度。通过非等比例四色滤光和中性衰减方法,动态范围可扩展到800~2500 ℃。编制了四波长测温软件,并采用标准高温黑体对测温仪每个通道光谱响应函数进行了标定。使用测温仪对激光背面加热目标进行温度测量,验证评估了测温准确度。通过高温温场的试验测试,与热电偶数据比对表明,四波长成像测温仪测温误差小于1%,满足大部分高温热试验温场测量的需求。研制的集成化成像测温仪,体积小便于携带,可以对各类固体目标高温温场进行测量,在热试验、铸造冶金等领域具有广泛的应用前景。
Non-scanning wide range multi-wavelength imaging temperature measurement technology
-
摘要: 多波长测温是一种先进的辐射测温技术,其原理是假定发射率光谱模型,利用测得的多波长辐射与波长发射率函数关系,求得目标的真温和发射率。多波长成像测温技术通过探测目标的多波长辐射图像信息,反演计算得到目标的温场分布。针对基于彩色CCD的多波长成像测温不能适应非线性光谱发射率模型、测温动态范围较窄等不足,提出了一种基于光阑处非等比例滤色分光的四波长无扫描成像测温方法,有效压缩了波段成像带宽,形成了四个窄波段的成像探测,适用于非线性光谱发射率模型目标宽动态范围温场测量。根据提出的测温方法研制了四波长成像测温仪。测温仪主要由窗口、中性衰减片、四色滤光片、光学物镜镜头、可见/近红外集成传感器、测量控制单元及软件等部分组成。测温仪软件由目标四个波长的单色成像图像,得到目标的真温温场分布。在激光加热条件下对800~2500 ℃目标高温温场进行了试验测试,测量结果与热电偶数据比对表明误差小于1%,具有较高的准确度和较好的动态范围适应性。Abstract: Multi-wavelength temperature measurement technology is an advanced radiation temperature measurement technology, which assumes a functional relationship between emissivity and spectrum. The measured multi-wavelength radiation signals and the function relationship between emissivity and spectral is used to obtain the true temperature and emissivity of the target. Multi-wavelength imaging temperature measurement technology detects the multi-wavelength radiation image information of the target and inversely calculates the temperature field distribution of the target. Aiming at the inadequacy of color CCD-based multi-wavelength imaging temperature measurement, such as adaptability of the nonlinear spectral emissivity model, and the narrow dynamic range of temperature measurement, and so on, a four-wavelength non-scanning imaging temperature measurement method based on non-equal ratio filter color splitting at the diaphragm was proposed. This method could effectively compress the band imaging bandwidth to form four narrow band imaging detections, and was suitable for wide dynamic range temperature field measurement of nonlinear spectral emissivity model targets. A four-wavelength imaging thermometer was developed according to the proposed temperature measurement method. The thermometer was mainly composed of a window, a neutral optical attenuator, a four-color filter, an optical objective lens, a visible/near infrared integrated sensor, a measurement control unit, and software. The real temperature distribution of the target was obtained according to the multi-wavelength warming algorithm by the thermometer software. The target high-temperature field (800-2500 ℃) was tested under laser heating conditions. The comparison between the measurement result and the thermocouple data shows that the error is less than 1%, and the method has higher accuracy and better dynamic range adaptability.
-
Key words:
- imaging temperature measurement /
- multi-wavelength /
- non-scanning /
- wide range
-
图 6 四波长成像测温仪软件流程图
Figure 6. Software flow chart of four-wavelength imaging thermometer
图 7 成像测温仪高温测量试验原理
Figure 7. Principle of high temperature measurement experiment of imaging thermometer
图 9 四波长测温仪与热电偶测试结果的比较
Figure 9. Comparison of test results between four-wavelength thermometer and thermocouple
表 1 成像测温仪设计参数
Table 1. Imaging thermometer design parametes
Parameter Value Waveband/nm 400-900 Field of view/(°) 5±0.1 Frequency/Hz 30 Temperature range/℃ 800-2500  下载: 导出CSV
-
[1] Wang Wenge. Survey of radiation thermometry [J]. Journal of Astronautic Metrology and Measurement, 2005, 25(4): 20-24. (in Chinese) [2] Zhang Lei, Chen Shaowu, Zhao Haichuan, et al. Multi-spectral temperature measuring system based on photoelectric detection [J]. Chinese Optics, 2019, 12(2): 289-293. (in Chinese) doi: 10.3788/co.20191202.0289 [3] Dai Jingmin. Theory and Practice of Multi-spectral Thermometry[M]. Beijing: Higher Education Press, 2002. (in Chinese) [4] Zhang Fucai, Sun Xiaogang, Xing Jian, et al. Research on reconstruction algorithm of two dimensional radiation temperature field using infrared multi-spectral line [J]. Infrared and Laser Engineering, 2016, 45(7): 0704003. (in Chinese) doi: 10.3788/irla201645.0704003 [5] Li Yunhong, Ma Rong, Zhang Heng, et al. Dual waveband colori-metric temperature accurate measurement technology [J]. Infrared and Laser Engineering, 2015, 44(1): 27-35. (in Chinese) [6] Christophe Rodiet, Benjamin Rémy, Alain Degiovanni, et al. Optimisation of wavelengths selection used for the multi-spectral temperature measurement by ordinary least squares method of surfaces exhibiting non-uniform emissivity [J]. Quantitative Infrared Thermography Journal, 2013, 10(2): 222-236. doi: 10.1080/17686733.2013.812816 [7] Smith Bandara, Sarath Gnapala, Daniel Wilson, et al. Multiple waveband temperature sensor [C]//Directed Energy Test & Evaluation Conference. NASA, 2006. [8] Cheng Xiaofang, Pan Qiqi, Cheng Ziqi. Radiation measurement for real temperature [J]. CIESC Journal, 2019, 70(S2): 8-14. (in Chinese) [9] Zhang Fucai, Sun Bojun, Sun Xiaogang. Multi wavelength true temperature inversion of single objective minimization method [J]. Infrared and Laser Engineering, 2019, 48(2): 0226002. (in Chinese) doi: 10.3788/IRLA201948.0226002 [10] Li Jimin, Jia Guorui, Qiu Xianfei. Correlation-wavelet method for separation of hyperspectral thermal infrared temperature and emissivity [J]. Optics and Precision Engineering, 2019, 27(8): 1737-1744. (in Chinese) doi: 10.3788/OPE.20192708.1737 [11] Zi Chongde, Li Yunqian, Zu Yongxiang, et al. Research on image alignment in multi-sensor spectral video imaging system [J]. Infrared and Laser Engineering, 2019, 48(6): 0603019. (in Chinese) doi: 10.3788/IRLA201948.0603019 [12] Lv Baolin, Tong Shoufeng, Xu Wei, et al. Non-uniformity correction of airborne infrared detection system based on inter-frame registration [J]. Chinese Optics, 2020, 13(5): 1124-1137. (in Chinese) doi: 10.37188/CO.2020-0109 [13] Song Xuyao, Duanmu Qingduo, Dong Wei, et al. Piecewise linear calibration of Fourier spectral measurement system responsivity based on the high temperature blackbody [J]. Infrared and Laser Engineering, 2019, 48(7): 0718002. (in Chinese) doi: 10.3788/IRLA201948.0718002 [14] Lu Qifeng, Xu Yishu, Wu Chunqiang, et al. Simulation analysis of error sensitivity factors in radiometric calibration of infrared hyperspectral interferometer [J]. Optics and Precision Engineering, 2020, 28(4): 867-877. (in Chinese) -

 点击查看大图
计量
- 文章访问数: 375
- HTML全文浏览量: 107
- PDF下载量: 76
- 被引次数: 0