下载:
下载:


-
随着信息时代的快速发展,普通单模光纤已逐渐无法满足光传输系统容量的需求。近年来,以多芯光纤、少模光纤等为主导的新型空分复用光纤以其独特的纤芯排列方式和模场特性,成为解决光传输网容量受限以及非线性效应等问题的良好光学元件[1-2]。光纤本身有如下几个重要的光学参数:折射率分布、几何结构和内应力分布等。这些参数的特征基本决定了光纤的光学性能。因此,在光纤使用前,对这些参数的测量就显得尤为重要。然而,空分复用光纤及其他特种光纤由于光纤内部结构特性与普通单模光纤不同,这就对光纤参数的测量系统提出了更高的要求。
对于光纤折射率分布的测量,主要分为轴向和横向测量。轴向测量需将光纤进行切割,该类技术开始于1975年Ikeda提出的端面反射法[3]。然而,反射法需要仪器具有很高的灵敏度来探测光纤端面微弱的反射光,否则难以得到准确的折射率测量结果。1981年,Young提出了近场折射法,基于这种技术, Fontaine发明了一种折射率剖面的测量仪[4]。不过,测量时需要对光纤样本进行精确的校准才能保证准确性。后来,Zhong提出了使用化学腐蚀结合原子力显微镜测量光纤折射率的方法。这是一种非光学的测量方法[5],测量精度可以达到纳米量级,但难点在于必须从光纤的腐蚀深度和速度来得到折射率分布。
另外一种横向测量技术,属于无损测量且拥有更高的分辨率,是目前折射率测量的主要方法。该类技术最早开始于1979年,Boggs和Presby提出使用横向干涉仪测量光纤剖面[6]。随后,Bachim又引入了断层扫描原理 [7],但需要在横向分辨率和测量准确性之间求折中,分辨率较低。为了提升分辨率,Yablon提出了一种色散Fourier变换光谱学技术来测量光纤的横截面折射率,属于干涉型测量方法[8],然而实际使用时需要通过移动光楔得到很多的干涉图样,测量过程复杂。
1998年,Barty提出了一种非干涉技术来测量光束横向穿过光纤后形成的相移,即QPM法。该方法利用强度传输方程来得到相移分布,具有很高的空间分辨率和准确性。2000年,Barty采用QPM技术结合计算机断层扫描技术[9],得到了双芯光纤的三维几何结构与二维折射率分布图,尤其对于芯间距的还原精度很高。不过,当时对于多层芯光纤的参数测量过程相对复杂,还需进一步优化。
而光纤应力分布的测量原理主要基于光弹性效应。光纤中残余应力会导致双折射产生,根据光弹效应,当光束横向穿过光纤时会产生一定的光延迟。通过测量光延迟的分布,就可以计算出光纤中残余应力的分布特性。
光延迟的测量方法研究最早开始于1982年,Chu和Whitbread首次提出了使用相位补偿法测量光延迟。随后,Colomb提出了使用偏振数字全息显微法对光延迟测量进行改进,需要得到两束参考光束和一横向穿过光纤的光束发生干涉后的强度分布图[10]。不过,该实验中需要用到许多个分光棱镜、玻片和起偏器来控制三束光的偏振态,操作相对复杂,测量时间较长。2006年,Montarou提出了可对较低光延迟进行准确测量的BKC法[11]。虽然BKC法的实验装置与双玻片补偿器法几乎相同,只是在使用过程中需对补偿器进行旋转,但不同点在于BKC法需要获取的是最小光强度分布,而非零光强度分布,因此,操作上更加简单,准确性更高,是目前较为普遍的测量光延迟量的方法。2009年,Hutsel利用BKC法结合计算机断层扫描技术技术,实现了光纤应力分布的测量,得到被测光纤应力的三维分布图。不过,该设备中的补偿器旋转装置需要精密设计,且对于旋转精度的要求较高,后续设计中仍需改进。
由于光纤应力与折射率之间存在一定的关系,二者的联合测量就显得尤为重要。2012年,Hutsel实现了光纤折射率和应力分布的联合测量[12],得到单模光纤的折射率分辨率约5×10⁻⁴量级,横截面平均轴向内应力为+4.70 MPa。不过,该装置对于特殊结构光纤的测量结果并不尽如人意。
而对于空分复用光纤参数的测量,由于多芯光纤的纤芯之间存在功率耦合,芯子之间的距离很近,出射端的光会在空间叠加,从而不能保证测量精度。因此,目前对于空分复用光纤及其他特种光纤的几何参数、折射率及应力分布的联合测量,国内外还没有成熟商用化的测量装置。
文中提出了一种基于QPM法、BKC法与机器视觉技术的多芯光纤综合参数测试系统,用于多芯光纤等特种光纤的光学参数综合测量。首先简单介绍了代表性的光纤折射率与内应力的测量方法,为测试系统的搭建奠定理论基础。接着,分析了QPM法与BKC法获得光纤折射率分布、几何结构与内应力分布的原理与流程。基于上述理论搭建测试系统并分别得到了多芯光纤的折射率分布与几何结构图、单模光纤的内应力分布图。与现有的光纤技术指标对比,相对折射率差的精度约5×10⁻⁴量级,证明了该系统测量结果的准确性。最后,总结全文,该系统可实现多模块、高空间分辨率的光纤参数快速准确测量,为多芯光纤在传输和传感等领域的应用提供重要的数据支撑。
-
在进行相移测量时,首先将待测光纤放置于载物台上,光源发出的光束传输方向为z 向,与待测光纤的径向垂直。待测光纤在x-y平面的方向为偏振器消光方向的45°。假设光束在待测光纤上的折射很小,光横向透过光纤的光强I和相移分布φ之间的关系可表示为[9]:
$$ - \frac{{2\pi }}{{\bar \lambda }}\frac{{\partial I}}{{\partial {z}}} = {\nabla _ \bot }.(I{\nabla _ \bot }\varphi ) $$ (1) 式中:
${\bar \lambda } $ 为光源的平均波长;$ {\nabla _ \bot } $ =$\dfrac{\partial }{\partial x}+\dfrac{\partial }{\partial y}$ 。当待测光纤处于焦点位置时,可通过CCD 相机得到焦点位置的光强分布图像;当待测光纤处于非焦点位置时,可以得到两幅非焦点位置的光强图像。再利用中心差分公式,可以近似得到光强在z向的微分${\partial I}/{\partial z}$ 。因此利用这三幅光强图像,对方程(1)进行数值求解,就可得到相移分布φ。若需得到光纤折射率的横向分布,则要在不同的θf角度(0≤θf<180o)对相移进行测量。以角度θf的光束通过待测光纤后的相移可以表示为[9]:$$ \varphi (x',{\theta _f}) = \frac{{2\pi }}{\lambda }\int\limits_{ - \infty }^\infty {\Delta n(x',y')} {\rm{d}}y' $$ (2) 式中:λ是光源的波长;
$ \Delta n(x',y') $ =$n\left( {{x'},{y'}} \right) - {n_{oil}}$ 为相对折射率差,公式(2)中的坐标关系如图1所示。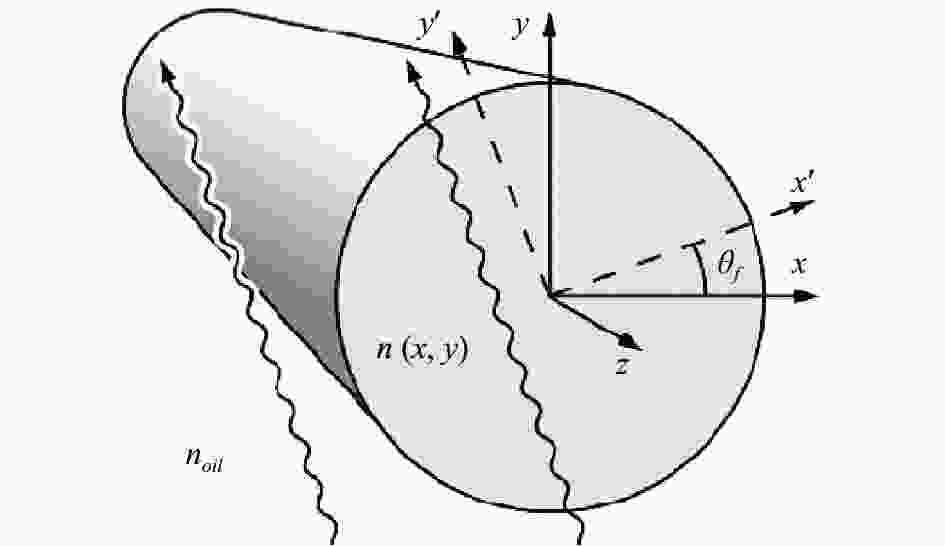
图 1 相移坐标关系图
Figure 1. The coordinate diagram of phase shift
由计算机断层扫描理论可知,相移分布的一维傅里叶变换Φ等于横向折射率分布的二维傅里叶变换ΔN (乘以2π/λ)的一个径向切片。定义s为空间角频率,那么计算机断层扫描理论可以描述为[9]:
$$ \varPhi (s,{\theta _f}) = \frac{{2\pi }}{\lambda }\Delta N(s\cos {\theta _f},s\sin {\theta _f}) $$ (3) 首先当θf=0时,对相移进行测量,测量完毕之后,待测光纤轴向旋转一定角度(一般为2°),重新聚焦并确认光纤位置,然后再对相移进行测量。因此,随着角度θf 从0增加到180°,可以得到89组相移数据。利用二维傅里叶反变换,光纤的横截面折射率分布可以表示为[9]:
$$ \Delta n(x',y') = \frac{\lambda }{{2\pi }}\int\limits_0^\pi {\left[ {\int\limits_{ - \infty }^\infty {\varPhi \left(s,{\theta _f}\right)\left| s \right|{{\rm e}^{i2\pi sx'}}{\rm{d}}s} } \right]} {\rm{d}}\theta $$ (4) 由公式(4)可知,通过测得的89组相移分布数据,就可得到待测光纤折射率的二维分布,结合多横截面的计算机断层扫描,即可得出待测光纤的折射率分布。值得注意的是,更大的旋转角度意味着测量时间的减少和精度的降低,而更小的旋转角度则相反。经重构算法优化,后续测试中笔者课题组将采用6°的旋转角,即旋转30次,可在确保精度的前提下进一步缩短测量时间。
对于光纤的几何结构重构,可通过定量相位显微法得到的折射率分布图,利用基于机器视觉的数字化图像处理方法,进一步获得光纤的几何结构,该方法可充分发挥计算机的图像处理优势,使得光纤几何结构图像的重构具有快速、准确的特点。
当使用补偿器法测量光纤内应力时,需要将补偿器插入光路中,补偿器的慢轴处于y方向。待测光纤所处坐标系如图2所示。透过待测光纤、补偿器、检偏器的光强由CCD相机捕获,得到光强图像。其光强可以表示为[11]:

图 2 内应力测量时光纤所处坐标系
Figure 2. The coordinate diagram of optical fiber when measuring the internal stress
$$ I{\text{ = }}\frac{{{\pi ^2}}}{{{\lambda ^2}}}{({R_s} \pm {R_c}\sin 2{\theta _c})^2} $$ (5) 式中:λ是光源的波长;Rs和Rc分别为待测光纤和补偿器与原始无待测光纤时光路的光程差;θc为补偿器从消光位置旋转过的角度。调整光路使得旋转补偿器对应CCD相机捕获的光强尽可能小,此时补偿器的角度为θc,min,公式(5)可简化为[11]:
$$ {R_{s}}{\text{ = }}\left| {{R_{c}}\sin 2{\theta _{c,\min }}} \right| $$ (6) 由于待测光纤在整个CCD相机视场内的应力分布可能是不均匀的,因此,对于视场内的每个像素点,当其达到强度最小时所对应的补偿器的角度θc,min 也不尽相同。为了更精确测量每个像素点的光程差,需要进行全视场光程差测量。其流程为:首先确定补偿器旋转角度的范围为θ1 ~θN,其选取原则是保证在这个角度范围之内,视场内的每个像素点均存在θc,min使得光强足够小;其次,补偿器从θ1开始旋转,每次以0.5°的幅度递增,直到旋转到θN,每旋转一个角度,CCD 相机就拍照一次并存储图像,供后续处理使用。需要指出的是,若θ1 ~θN的间隔范围过大,由于旋转次数增多,测试时间会显著增加。以笔者的经验来看,只要在任意的θ1 ~θN内实现光场的“明-暗-明”的变化,即可确定该范围,一般为30°左右。对于一次全视场测量,共获得N副光强图像,对某个像素点而言,通过该点光强度的多项式拟合算法,就可以计算得到该像素点的最小θc,min的值,从而得到该像素点的光程差。当θf从0旋转到180°时,就得到一组光程差分布数据,然后使用计算机断层扫描技术,可以得到轴向应力的分布图。
-
根据定量相位显微法与补偿器法的原理,笔者课题组搭建了多芯光纤综合参数测试系统,整体的框架以及系统装置分别如图3和图4所示。多芯光纤折射率、几何结构及内部应力测量模块之间相辅相成,由折射率测量模块,再通过图像处理技术可得到光纤的几何结构,而折射率测量模块与内应力测量模块光路系统大致相同,只需微调光路对光纤重新聚焦和添加补偿器即可。通过对折射率测量、几何结构测量和内应力测量三个模块的优化融合,综合外观、样机智能化等设计,并与人机交互界面相连,形成一体化设计,达到光纤折射率、几何结构与内应力分布的联合测量。

图 3 多芯光纤综合参数测试系统框架图
Figure 3. The framework diagram of multi-core fiber comprehensive parameter test system

图 4 多芯光纤综合参数测试系统装置图
Figure 4. The device diagram of multi-core fiber comprehensive parameter test system
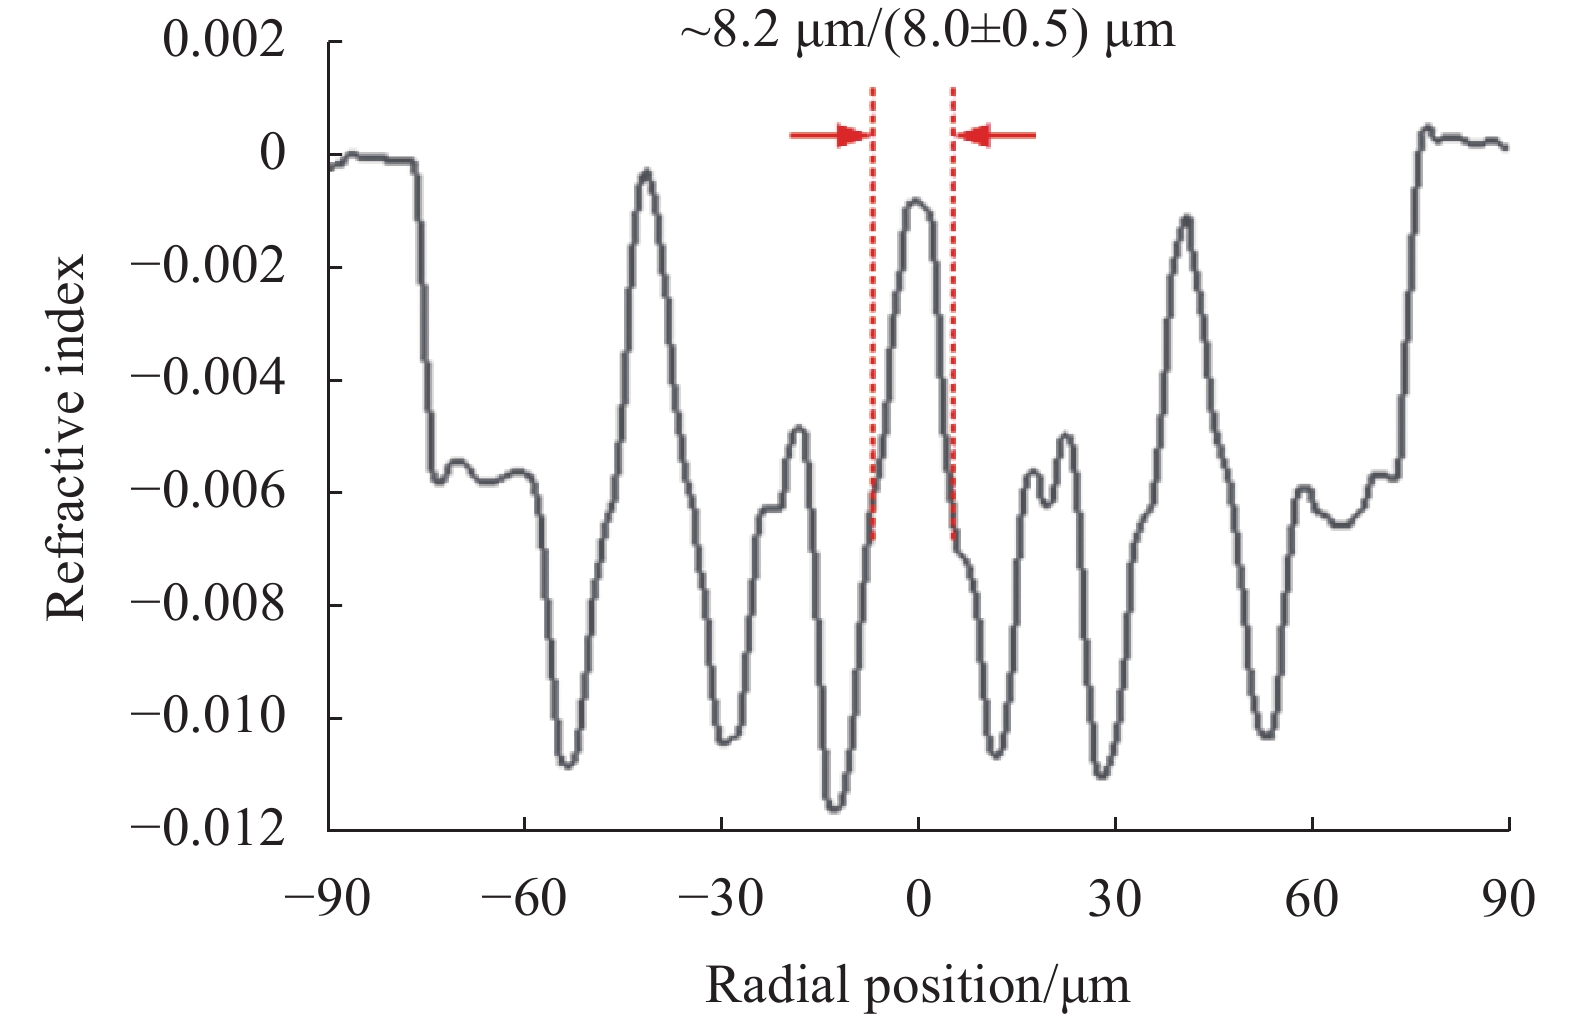
首先,笔者课题组选择长飞光纤光缆股份有限公司的多芯光纤产品,型号为MCF 7-42/150/250 (SM),并重构了该光纤的折射率分布与几何结构。这里简单给出该多芯光纤产品的技术指标:芯包折射率差为~0.5%,芯层直径为(8.0±0.5) μm,芯间距为(41.5±1.5) μm,包层直径(150±2) μm。对七芯光纤进行浸没匹配液的处理后,通过定量相位显微法对该光纤进行聚焦与正负弱离焦处理,得到相移图,后续通过光纤旋转,得到不同角度相位分布,数据处理重构后得到该光纤的折射率分布与几何结构图像,如图5和图6所示。其中,重构得到的该七芯光纤的芯包折射率差为~0.54%,芯层直径为~8.2 μm,芯间距为~43.2 μm,包层直径~151.8 μm。可以看出,该系统的测量结果与既有的光纤产品指标相比,相对折射率差的误差约为3.5×10⁻⁴,芯间距与芯包半径位置的误差分别约为±1.7 μm和±0.2 μm,小于3%。

图 5 七芯光纤折射率分布重构图
Figure 5. The reconstruction diagram of the refractive index profile of the seven-core fiber

图 6 七芯光纤几何结构重构图
Figure 6. The reconstruction diagram of the seven-core fiber geometry
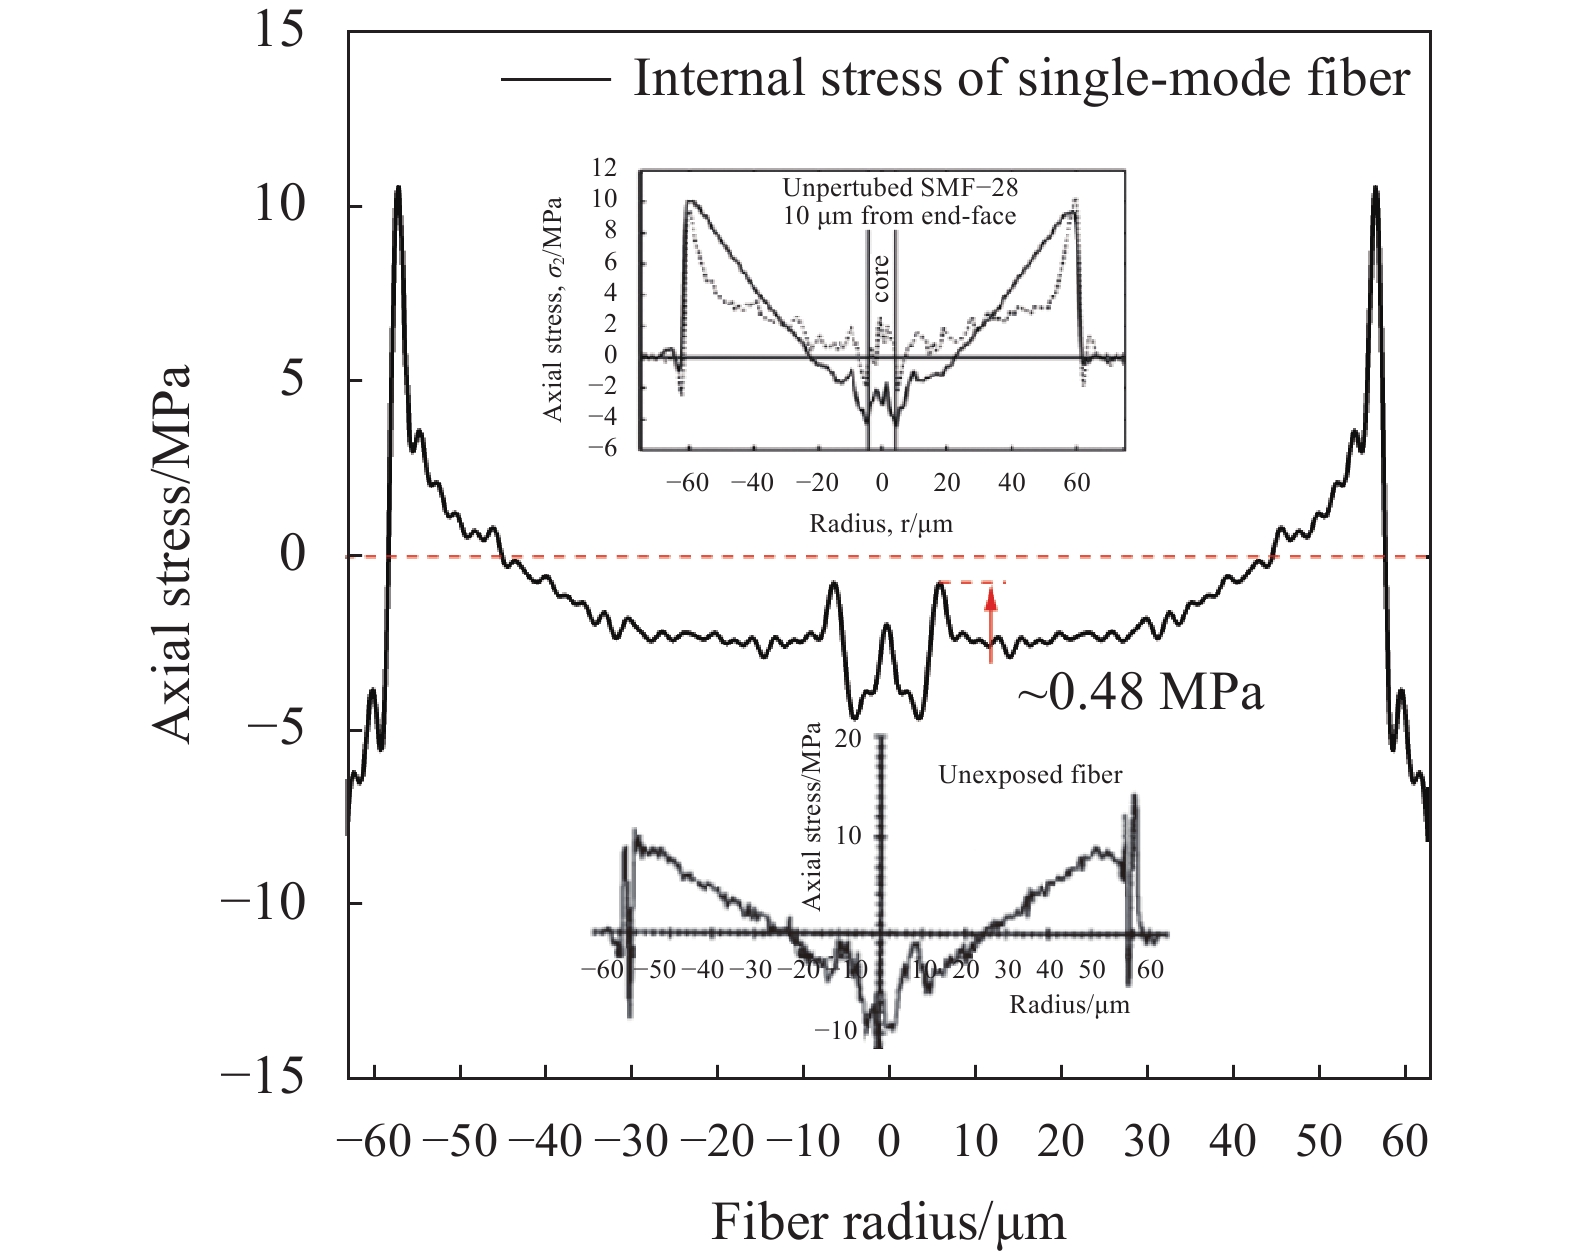
接着,笔者课题组以康宁SMF-28单模光纤为例,进行光纤内应力分布图像的重构。由于该单模光纤产品的技术指标中不含有内应力值这一项,因此在后续分析中,笔者课题组通过将该系统测量后重构得到的光纤内应力分布与其他方法获得的结果进行比较,以说明该系统的测量可靠性。需要指出的是,多芯光纤中某个纤芯区域的内应力分布不仅受到纤芯与包层分界处的影响,同时也来自周围其他纤芯单元的相互作用,因此其内应力分布表征相对复杂。另外,目前实验测量多芯光纤内应力分布的同类研究甚少,暂无可用于对比参考的多芯光纤内应力分布表征结论。综合考虑,文中选择单模光纤,对其进行内应力分布重构,并与现有技术进行对比分析。当单模光纤处于聚焦位置后,旋转补偿器使视野内处于“明-暗-明”的变化,确定区间后,在该区间内以固定值为间隔多次旋转补偿器,得到多组光强图像。由于单模光纤为圆对称结构,因此无需旋转光纤即可重构该光纤的内应力分布,数据处理后通过光程差计算得到单模光纤的应力值,如图7所示。其中,图7中的上下两张副图分别给出了以双玻片补偿法与半阴影法得到的该光纤内应力分布图,在横截面上的平均轴向内应力为~+4.50 MPa。而笔者课题组重构的该光纤纤芯区域的内应力分布形态与上述方法得到的基本一致,平均轴向内应力为~+4.35 MPa,测量分辨率约0.5 MPa,属于正常应力范围,可以认为实现了光纤内应力分布的良好表征。

图 7 单模光纤内应力分布重构图
Figure 7. The reconstruction diagram of the stress distribution in single-mode fiber
-
综上所述,基于定量相位显微法、补偿器法与机器视觉技术的多芯光纤综合参数测试系统可实现包括多芯光纤在内的特种光纤主要光学参数的快速准确测量。由于采用的定量相位显微法与补偿器法光路基本一致,仅使用一条光路即可完成多模块的光纤参数综合测试,具有操作简单,可延展性等优势。利用该系统获得了七芯光纤的折射率分布与几何结构,单模光纤的内应力分布图,结果表明与现有光纤技术参数相比,该系统获得的相对折射率差的精度约5×10⁻⁴量级,芯间距与芯包半径误差约3%,单模光纤内应力测量分辨率约0.5 MPa,证明了该系统测量结果的准确性,为多芯光纤在传输、放大、传感等多领域的应用提供了重要的数据支撑。
Reconstruction technology of refractive index and internal stress distribution of multi-core fibers (Invited)
-
摘要: 介绍了一种基于定量相位显微(Quantitative phase microscopy,QPM)法、Brace-Köhler补偿器(Brace-Köhler compensator,BKC)法与机器视觉技术的多芯光纤综合参数测试系统,并利用该系统获得了七芯光纤的折射率分布与几何结构,单模光纤的内应力分布图。采用横向测量方式的QPM法避免了截断光纤造成的损坏,采用改进的BKC法优化了光延迟量的获取方式,结合机器视觉技术,实现了多模块、高空间分辨率、快速准确的光纤参数测量,其中相对折射率差的精度约5×10⁻⁴量级,单模光纤内应力测量分辨率约0.5 MPa。通过与既有的光纤产品技术指标对比,证明了该系统具有测量准确性,测试结果为多芯光纤在传输和传感等多领域的应用提供了数据支撑。Abstract: A novel multi-core fiber comprehensive parameter test system based on quantitative phase microscopy method, Brace-Köhler compensator method and machine vision technology was introduced. In order to characterize the test capability of peoposed system, the refractive index distribution and geometric structure of a seven-core fiber from YOFC, and the internal stress distribution of a single-mode fiber from Corning were obtained by this system, respectively. According to the former research, the quantitative phase microscopy method using transverse measurement could avoid the performance damage caused by truncated optical fiber efficiently. The improved Brace-Köhler compensatormethod was used to optimize the acquisition to get the optical delay. Combined with the machine vision technology, the system realized multi-modules, high spatial resolution, fast and accurate fiber parameter measurement. After sample processing, program debugging and optimization, the experiment results show that the accuracy of relative refractive index differencein multicore fiber was about 5×10⁻⁴ magnitude and the internal stress measurement resolution of single-mode fiber wasabout 0.5 MPa. The comparison with the technicalindicators of existing optical fiber products proves that the system has measurement accuracy, and the test results provide data support for the application of multi-core fibers in multiple fields such as transmission and sensing.
-
Key words:
- multi-core fiber /
- quantitative phase microscopy /
- compensator method /
- machine vision /
- reconstruction
-
图 2 内应力测量时光纤所处坐标系
Figure 2. The coordinate diagram of optical fiber when measuring the internal stress
图 3 多芯光纤综合参数测试系统框架图
Figure 3. The framework diagram of multi-core fiber comprehensive parameter test system
图 4 多芯光纤综合参数测试系统装置图
Figure 4. The device diagram of multi-core fiber comprehensive parameter test system
图 5 七芯光纤折射率分布重构图
Figure 5. The reconstruction diagram of the refractive index profile of the seven-core fiber
-
[1] Matsui T, Yamada Y, Sagae Y, et al. Standard cladding diameter multi-core fiber technology[C]//Optical Fiber Communication Conference, 2021: Tu6B.4. [2] Xie Y, Pei L, Zheng J, et al. Impact analysis of a dense hole-assisted structure on crosstalk and bending loss in homogeneous few-mode multi-core fibers [J]. Optics Express, 2020, 28(16): 23806-23819. doi: 10.1364/OE.400461 [3] Ikeda M, Tateda M, Yoshikiyo H. Refractive index profile of a graded index fiber: Measurement by a reflection method [J]. Applied Optics, 1975, 14(4): 814-815. doi: 10.1364/AO.14.000814 [4] Young M. Optical fiber index profiles by the refracted-ray method (refracted near-field scanning) [J]. Applied Optics, 1981, 20(19): 3415-3422. doi: 10.1364/AO.20.003415 [5] Zhong Qian, Inniss D. Characterization of the lightguiding structure of optical fibers by atomic force microscopy [J]. Journal of Lightwave Technology, 1994, 12(9): 1517-1523. doi: 10.1109/50.320932 [6] Presby H M, Marcuse D, Astle H W, et al. Rapid automatic index profiling of whole-fiber samples: Part II [J]. Bell System Technical Journal, 1979, 58(4): 883-902. doi: 10.1002/j.1538-7305.1979.tb03326.x [7] Bachim B L, Gaylord T K. Microinterferometric optical phase tomography for measuring small, asymmetric refractive-index differences in the profiles of optical fibers and fiber devices [J]. Applied Optics, 2005, 44(3): 316-327. doi: 10.1364/ao.44.000316 [8] Yablon A D. Multi-wavelength optical fiber refractive index profiling by spatially resolved Fourier transform spectroscopy [J]. Journal of Lightwave Technology, 2010, 28(4): 360-364. doi: 10.1109/JLT.2009.2032071 [9] Barty A, Nugent K A, Roberts A, et al. Quantitative phase tomography [J]. Optics Communications, 2000, 175(4): 329-336. doi: 10.1016/S0030-4018(99)00726-9 [10] Colomb T, Dürr F, Cuche E, et al. Polarization microscopy by use of digital holography: Application to optical-fiber birefringence measurements [J]. Applied Optics, 2005, 44(21): 4461-4469. doi: 10.1364/AO.44.004461 [11] Montarou C C, Gaylord T K, Dachevski A I. Residual stress profiles in optical fibers determined by the two-waveplate-compensator method [J]. Optics Communications, 2006, 265(1): 29-32. doi: 10.1016/j.optcom.2006.02.046 [12] Hutsel M R, Gaylord T K. Concurrent three dimensional characterization of the refractive-index and residual-stress distributions in optical fibers [J]. Applied Optics, 2012, 51(22): 5442-5452. doi: 10.1364/AO.51.005442 -

 点击查看大图

计量
- 文章访问数: 352
- HTML全文浏览量: 113
- PDF下载量: 59
- 被引次数: 0