下载:
下载:
-
气溶胶可影响地气辐射能量收支,还可作为云凝结核影响水汽循环,因而对于全球气候变化具有重要影响[1-2]。由于不同类型气溶胶的性质差异显著[3],所以需要准确辨识气溶胶类型并掌握其时空分布特征。
海洋占地球表面的71%,获取海洋上空气溶胶类型的时空演变信息,对于认识全球气溶胶分布特征至关重要。卫星遥感是大范围同步获取气溶胶信息的主要技术手段,与以MODIS等为代表的被动光学遥感器相比,以CALIOP为代表的主动光学遥感器具有获取气溶胶垂直分布信息的技术优势,且观测不受光照等影响,具备全天时观测能力[4]。
目前,基于CALIOP卫星数据的气溶胶类型研究多集中于内陆[5-10],对于海上气溶胶类型的研究较少[11-12]。由于受到强烈的陆源影响,渤海、黄海气溶胶光学性质复杂多变[13-14],但目前针对该区域气溶胶类型的时空演变研究还不够系统深入,缺少全面准确的认识[15]。在此背景下,文中基于长时间序列(2006~2019年)的CALIOP卫星数据(version 4),采用最新的激光雷达气溶胶类型划分方法[3]开展研究,以期辨识渤海、黄海主导气溶胶类型,揭示各类型气溶胶的垂直分布特征,分析其长期演变趋势和季节差异特征。
-
CALIOP全称为“云-气溶胶正交偏振激光雷达” (Cloud-Aerosol Lidar with Orthogonal Polarization),搭载在CALIPSO(The Cloud-Aerosol Lidar and Infrared Pathfinder Satellite Observation)卫星上;该星于2006年发射[4,16],主要用于云和气溶胶的遥感观测。
从NASA (National Aeronautics and Space Administration)下载了2006年6月至2019年12月渤海、黄海海域全部的CALIOP二级产品数据(Vertical Feature Mask)[17],共计5916轨,研究区CALIOP观测轨迹如图1所示。重点针对8.2 km高度以下的气溶胶类型数据进行了分析,数据的垂向空间分辨率30 m。

图 1 研究区示意图(a)以及CALIOP轨迹(b)(黄、绿线分别为白天、夜晚轨迹)
Figure 1. (a) Schematic diagram of the study area and (b) CALIOP tracks (The yellow and green lines are day and night tracks, respectively)
根据CALIOP最新的V4版(version 4)气溶胶分类算法[3],气溶胶类型主要包括以下7种:清洁海洋型(Clean Marine)、沙尘型(Dust)、污染沙尘型(Polluted Dust)、污染大陆型(Polluted Continental/Smoke)、清洁大陆型(Clean Continental/background)、煤烟型(Elevated Smoke)、沙尘海洋型(Dusty Marine)。其中,沙尘海洋型是沙尘与海洋气溶胶混合的产物,污染沙尘型是沙尘与人类活动(生物质燃烧所产生的烟或城市污染等)所产生的气溶胶相混合的产物。
V4版的主要改进之处是:(1)新增了“沙尘海洋型”,以解决V3版本误分为“污染沙尘型”气溶胶的问题;(2)修订了清洁海洋型、沙尘型、清洁大陆型、煤烟型等气溶胶的激光雷达比[3]。
-
提取黄海、渤海上空高度0.28~8.17 km之间共264层CALIOP数据,进行气溶胶类型的时空分布统计。采用贝叶斯趋势分析方法(Bayesian trend analysis)进行不同类型气溶胶占比的长时间序列趋势分析[18]。
-
基于CALIOP数据,统计了研究区14年间(2006~2019年) 0.28~8.17 km高度范围内各类型气溶胶的出现频次,结果如图2所示。
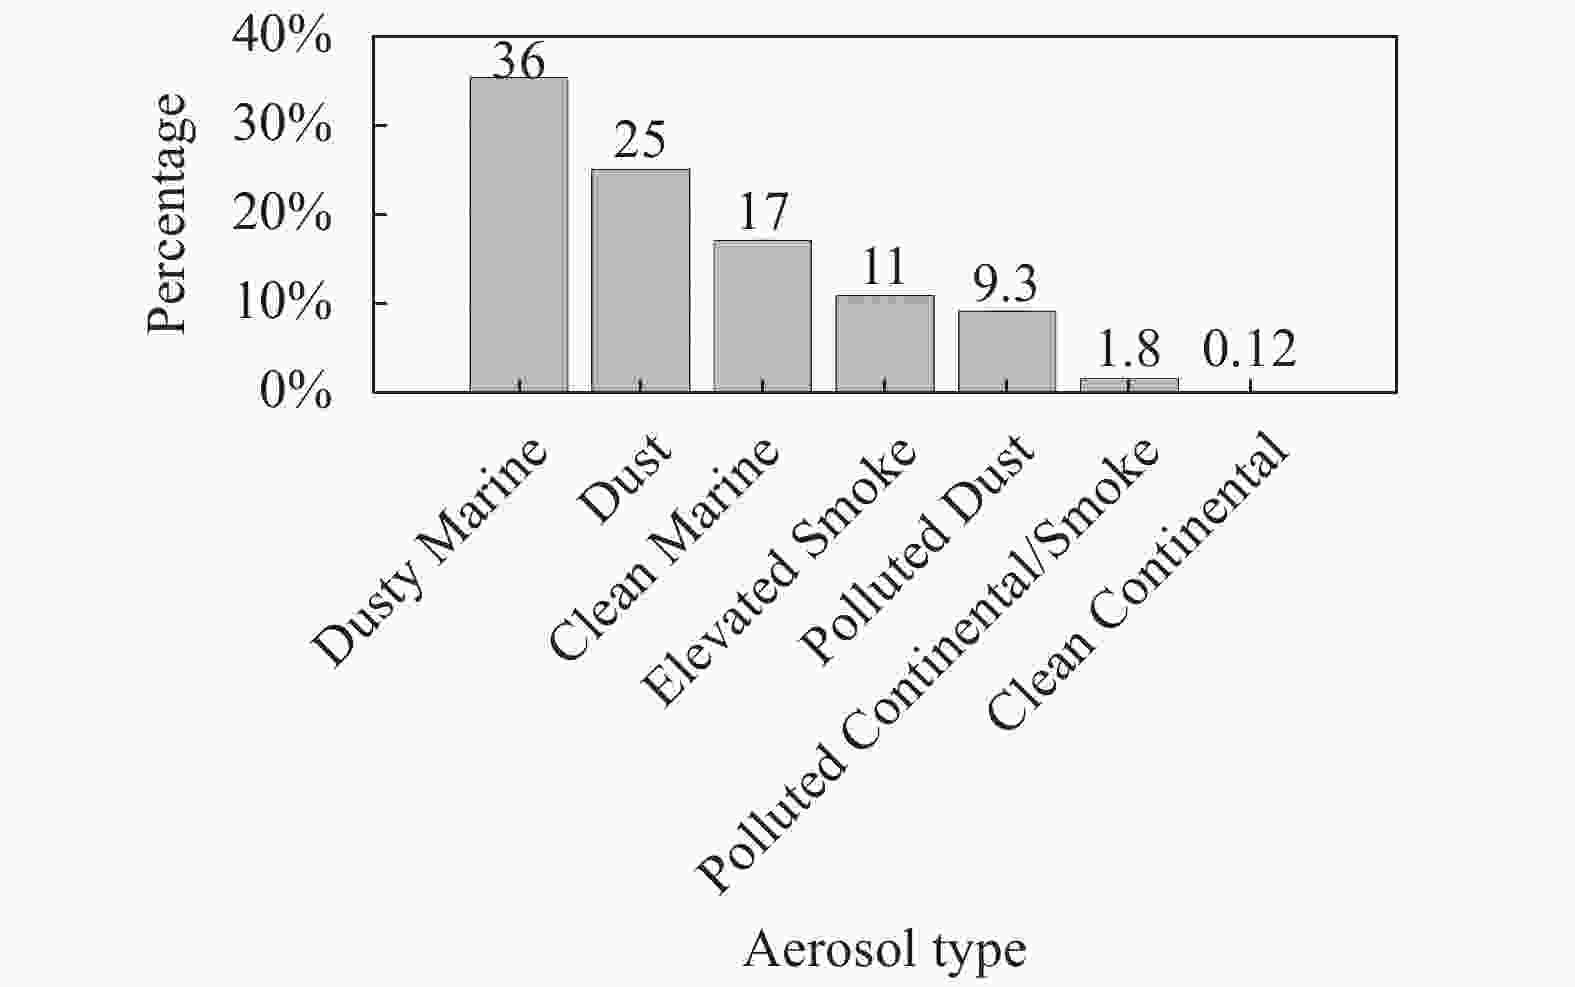
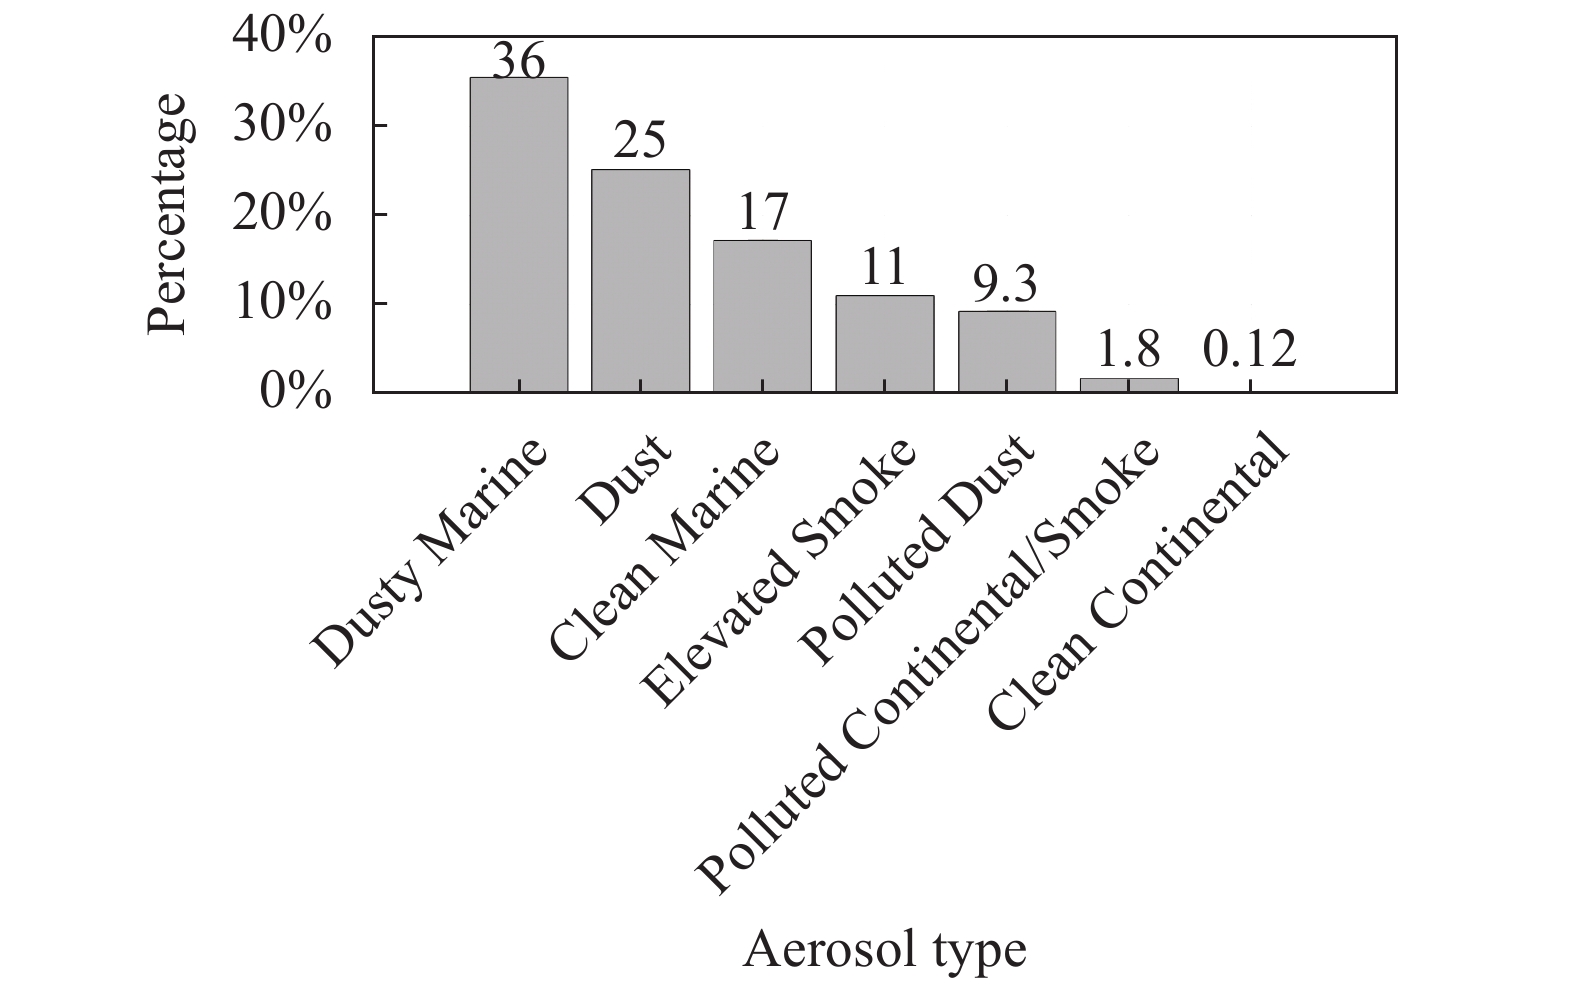
图 2 2006~2019年各类气溶胶出现频次占比
Figure 2. Percentage of various types of aerosols (2006-2019)
由图2可见,研究区Dusty Marine占比最高(36%),Dust次之 (25%),Clean Marine (17%)、Elevated Smoke (11%)和Polluted Dust (9%)也有一定出现频率,上述5种类型的气溶胶在研究区占主导,占比合计超97%;剩余的2种类型(Polluted Continental/Smoke和Clean Continental)气溶胶出现概率很低(<2%),可忽略不计。特别值得指出的是,与沙尘有关的3种气溶胶类型(Dusty Marine、Dust、Polluted Dust)占比合计约70%,这显示出陆源输送的沙尘对研究区的显著影响。
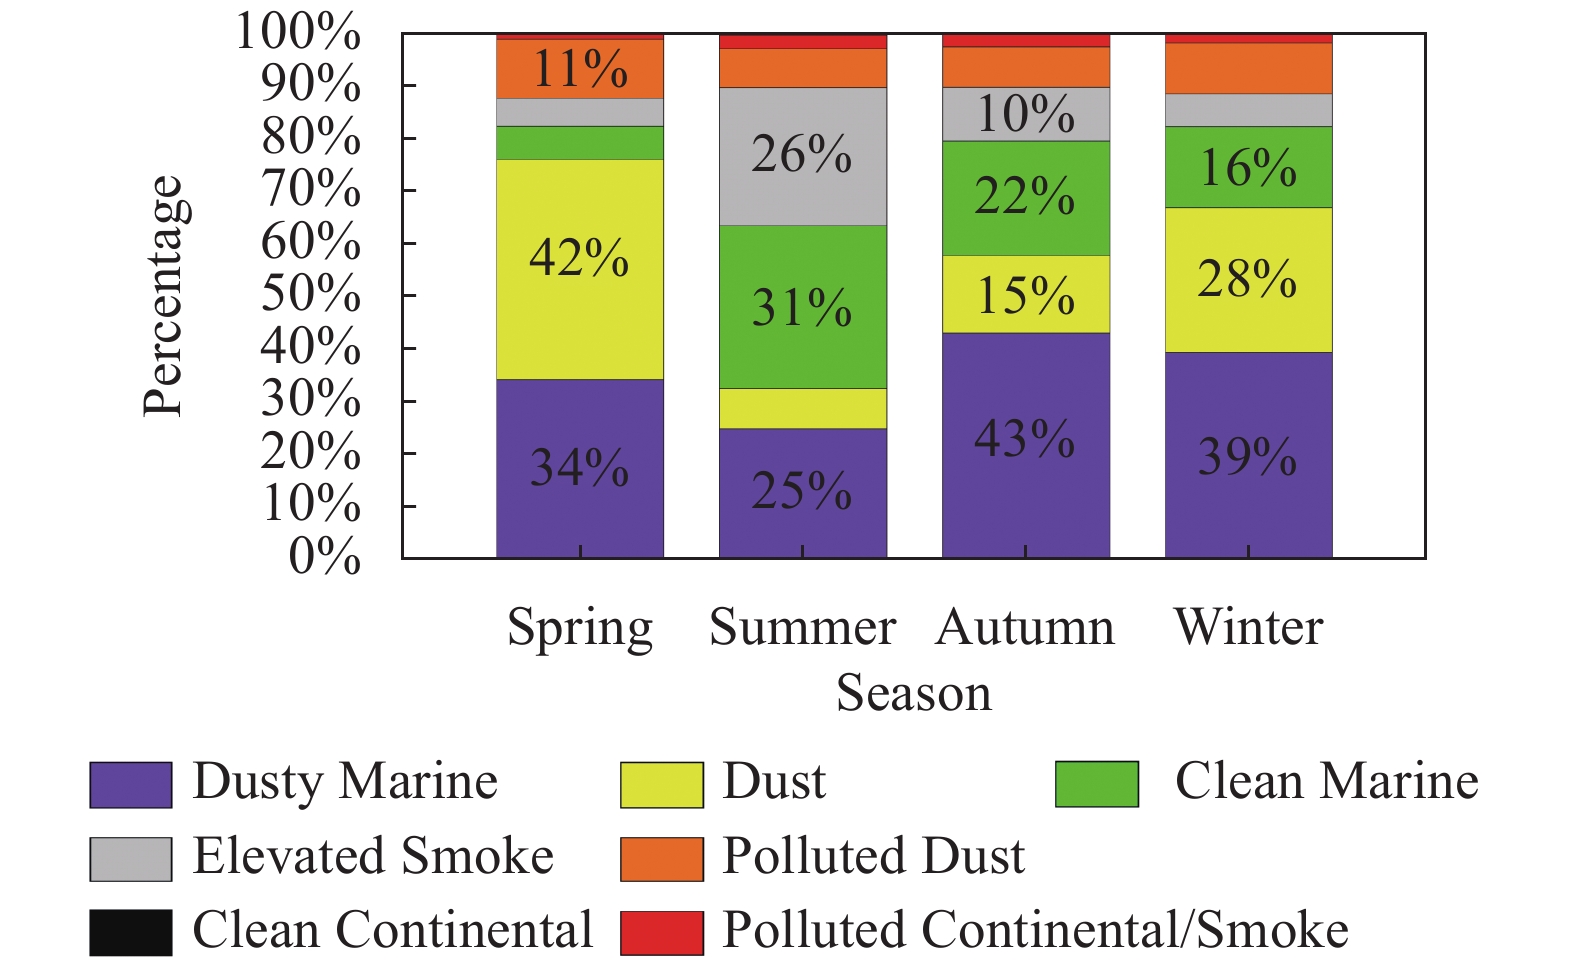
进一步对不同季节的数据进行分析发现(图3),各季节主导的气溶胶类型存在明显差异。春季Dust (42%)和Dusty Marine (34%)占主导,二者占比合计76%;夏季主导类型为Clean Marine (31%)、Elevated Smoke (26%)和Dusty Marine (25%),三者占比合计82%;秋季Dusty Marine (43%)占主导,Clean Marine(22%)和Dust (15%)次之,三者合计达80%;冬季Dusty Marine、Dust、Clean Marine占主导(占比依次为39%、28%和16%),三者合计83%。与沙尘有关的3种类型气溶胶占比之和,冬、春季均可达~80%,夏季最低(~40%),秋季居中(>65%)。
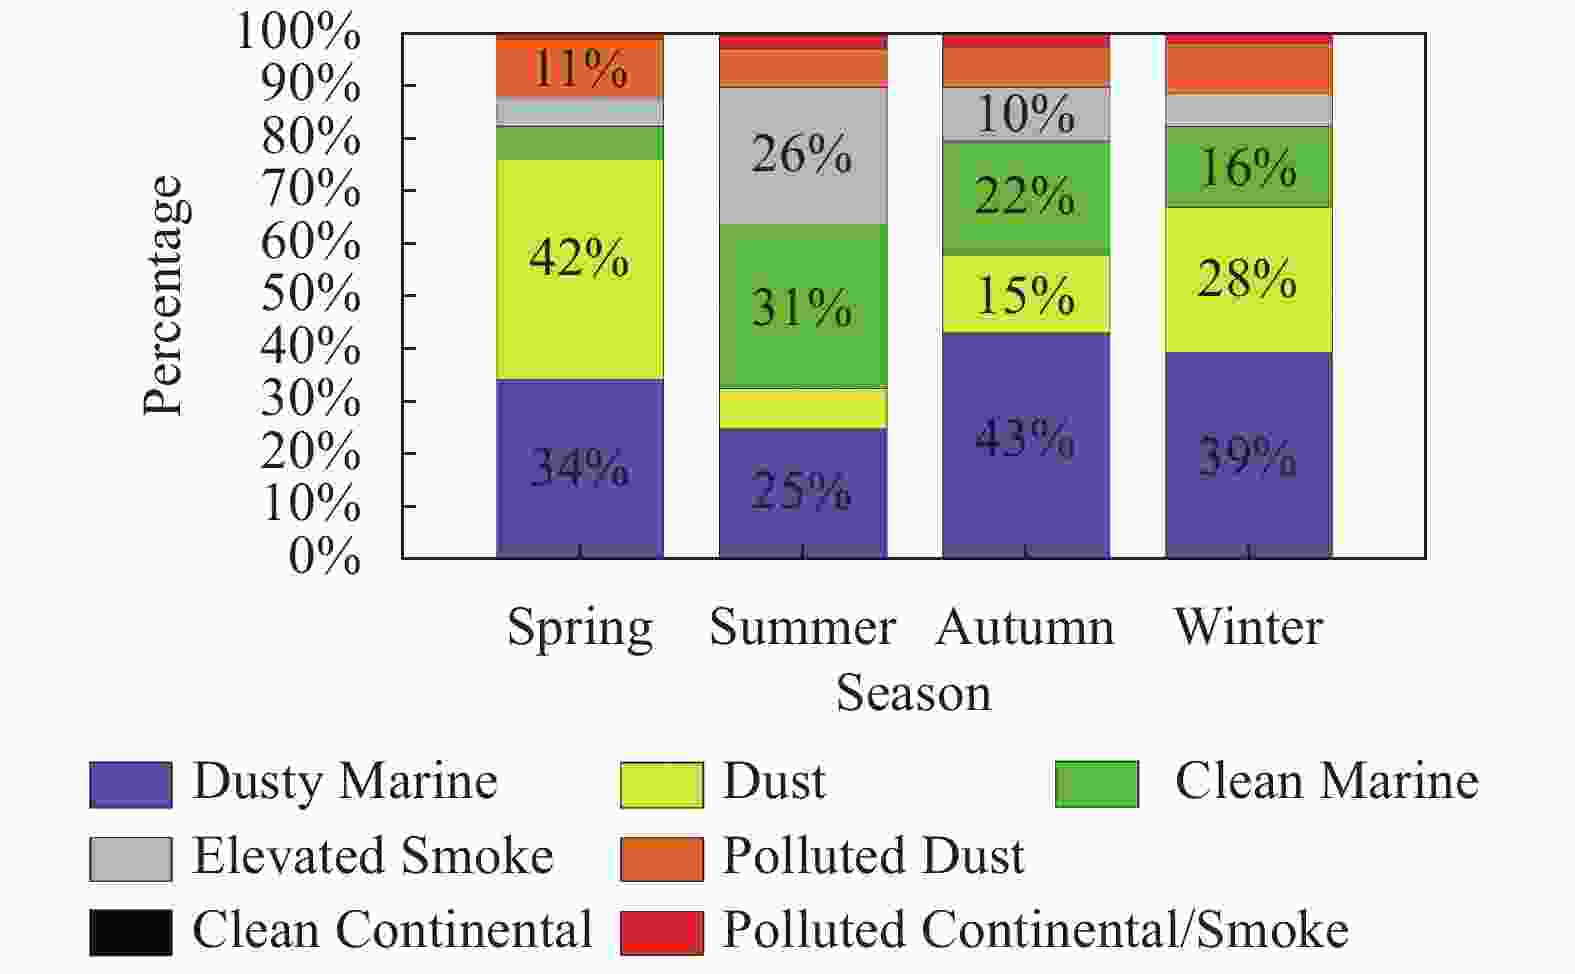
图 3 不同季节各类型气溶胶的占比
Figure 3. Percentage of various types of aerosols in different seasons
除Polluted Dust之外,其他类型气溶胶的占比大都具有较为明显的季节变化,其中:Dust是春季占主导的气溶胶类型(42%),而夏季占比则仅为8%;Clean Marine夏季占比大于30%,春季却仅为6%;Elevated Smoke夏季占比(26%)远高于春(5%)、冬(6%)季;Dusty Marine秋、冬季占比约40%,而夏季为25%。
-
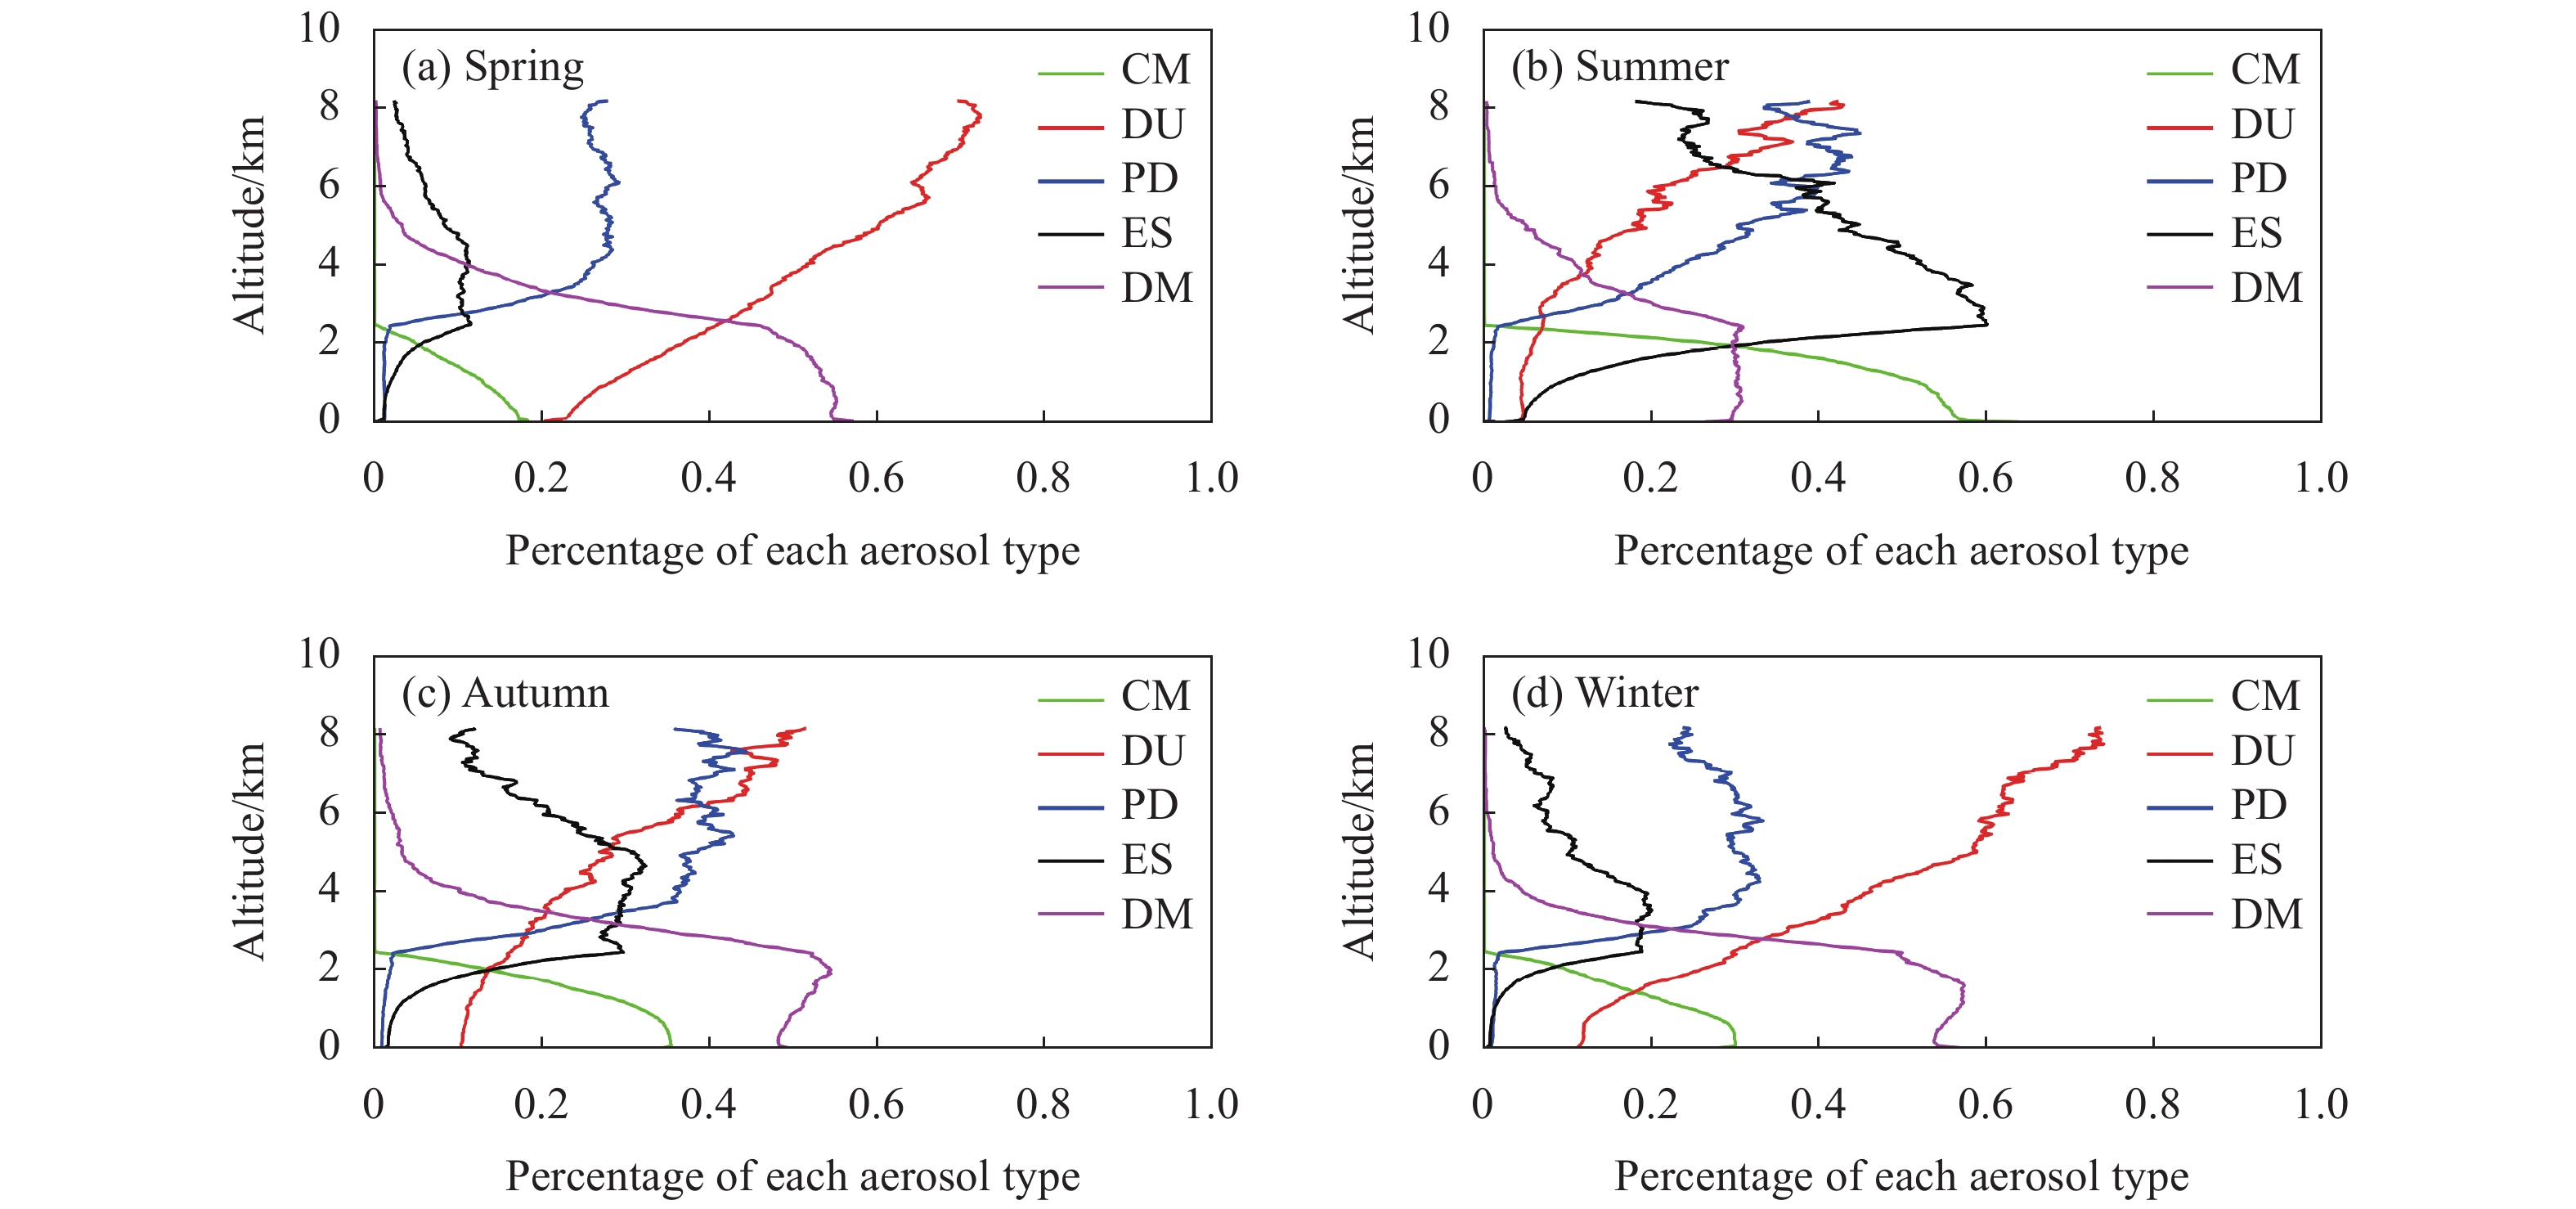
按不同高度逐层统计了各类型气溶胶出现频次(图4),以下针对研究区5种主要的气溶胶类型进行分析。
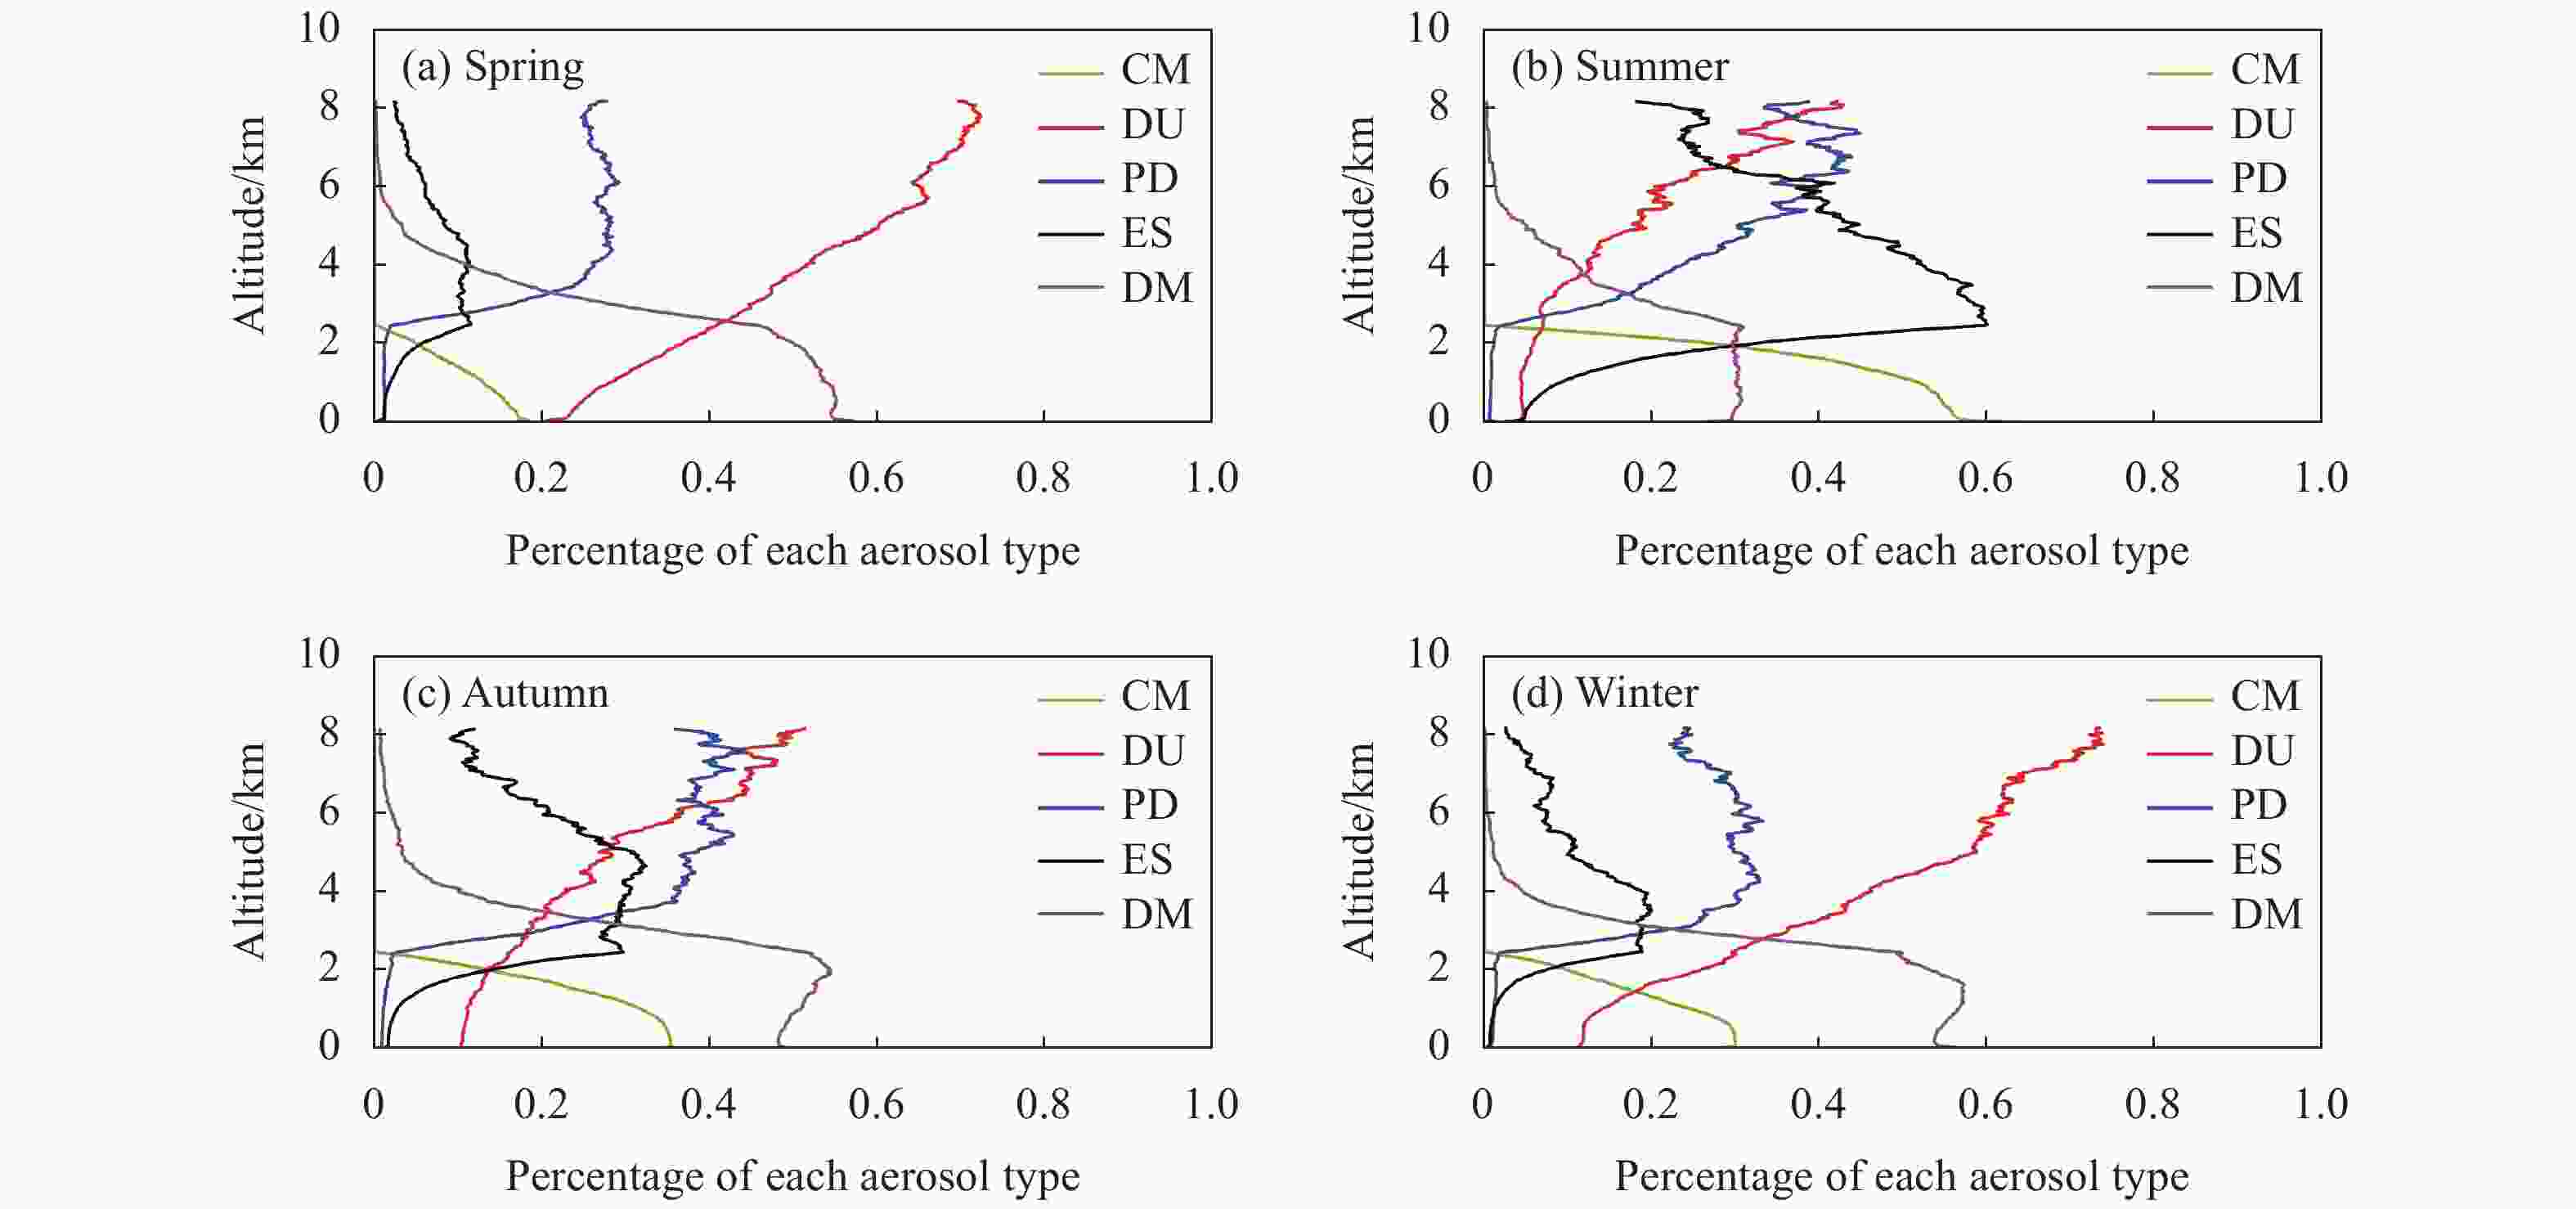
图 4 5种主要气溶胶类型占比的垂直分布
Figure 4. Vertical distribution of percentages of the 5 dominant aerosol types
由图4可见,Clean Marine(绿线)和Dusty Marine(紫线)主要分布在2.5 km以下,在高层大气中占比迅速降低。与之相反,Polluted Dust(蓝线)和Elevated Smoke(黑线)主要分布在2.5 km以上,其中,后者还是夏季2~6 km高度内占主导的气溶胶类型;Dust(红线)占比随高度增加而增大,且春、冬季的变化梯度明显高于夏、秋季。
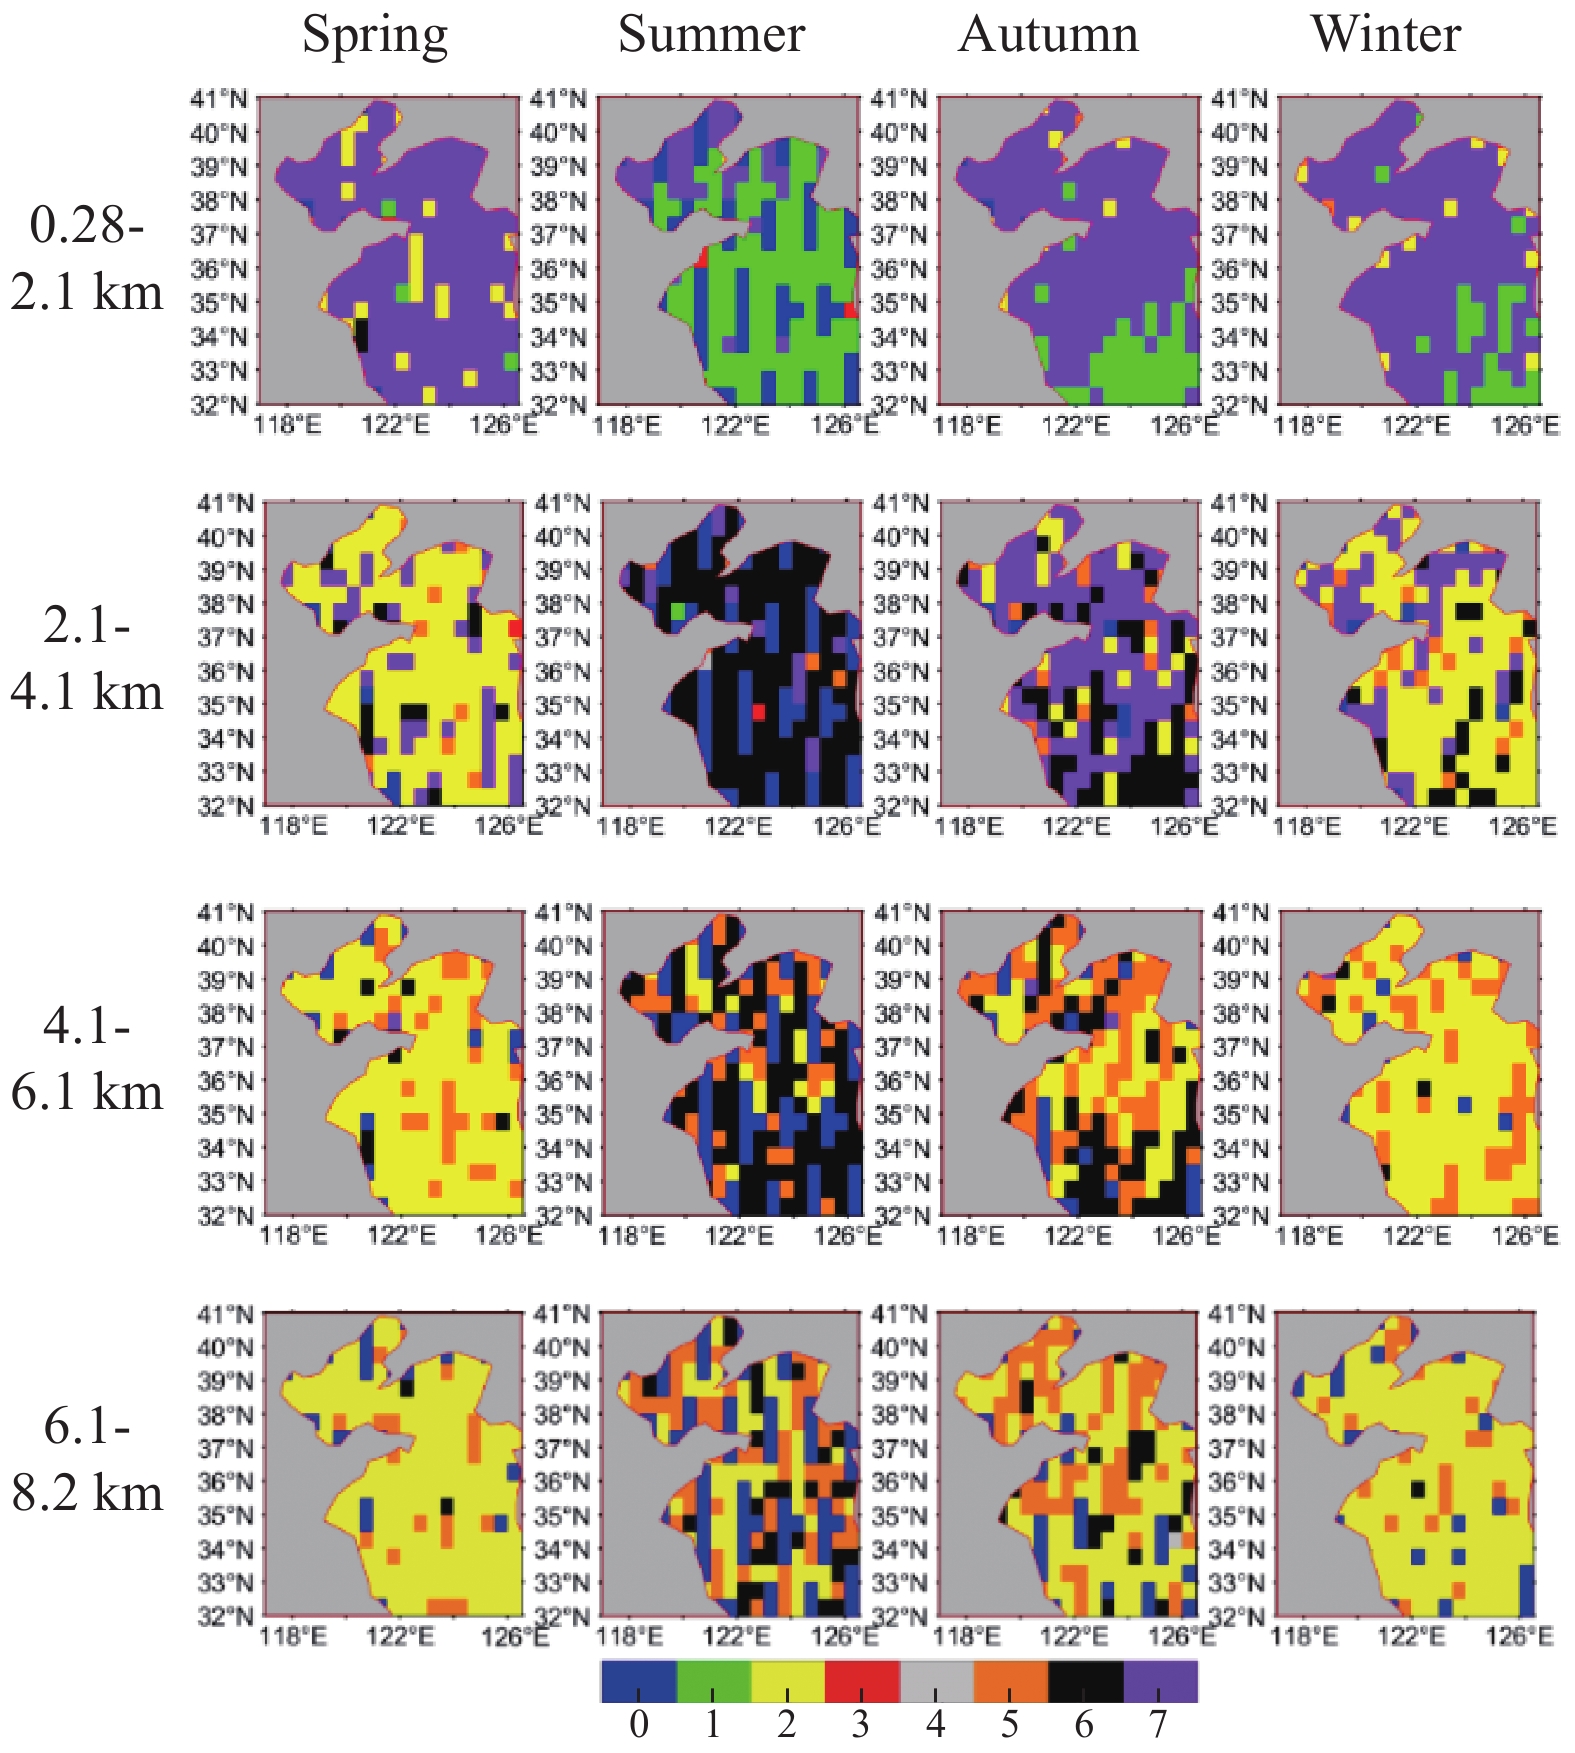
进一步把数据分为0.28~2.2 km、2.2~4.1 km、4.1~6 km和6~8.17 km 4层,分别统计各位置出现频次最高的气溶胶类型,结果见图5。

图 5 不同高度上的主导气溶胶类型(0=未确定;1=清洁海洋型;2=沙尘型;3=污染大陆/煤烟型;4=清洁大陆型;5=污染沙尘型;6=升高的煤烟型;7=沙尘海洋型)
Figure 5. Dominant aerosol types (0=Not Determined; 1=Clean Marine; 2=Dust; 3=Polluted Continental/Smoke; 4=Clean Continental; 5=Polluted Dust; 6=Elevated Smoke; 7=Dusty Marine)
(1)春季和冬季:各层大气气溶胶类型的水平分布格局较为一致,即2 km以上以Dust为主(黄色),2 km以下以Dusty Marine为主(紫色)。
(2)秋季:4 km以下以Dusty Marine为主(紫色),4 km以上以Dust (黄色)和Polluted Dust(棕色)为主。
(3)夏季最为复杂,底层大气(<2 km)在黄海以Clean Marine为主(绿色),渤海以Dusty Marine为主(紫色);2~4 km以Elevated Smoke 为主;4 km以上多种类型气溶胶并存。
-
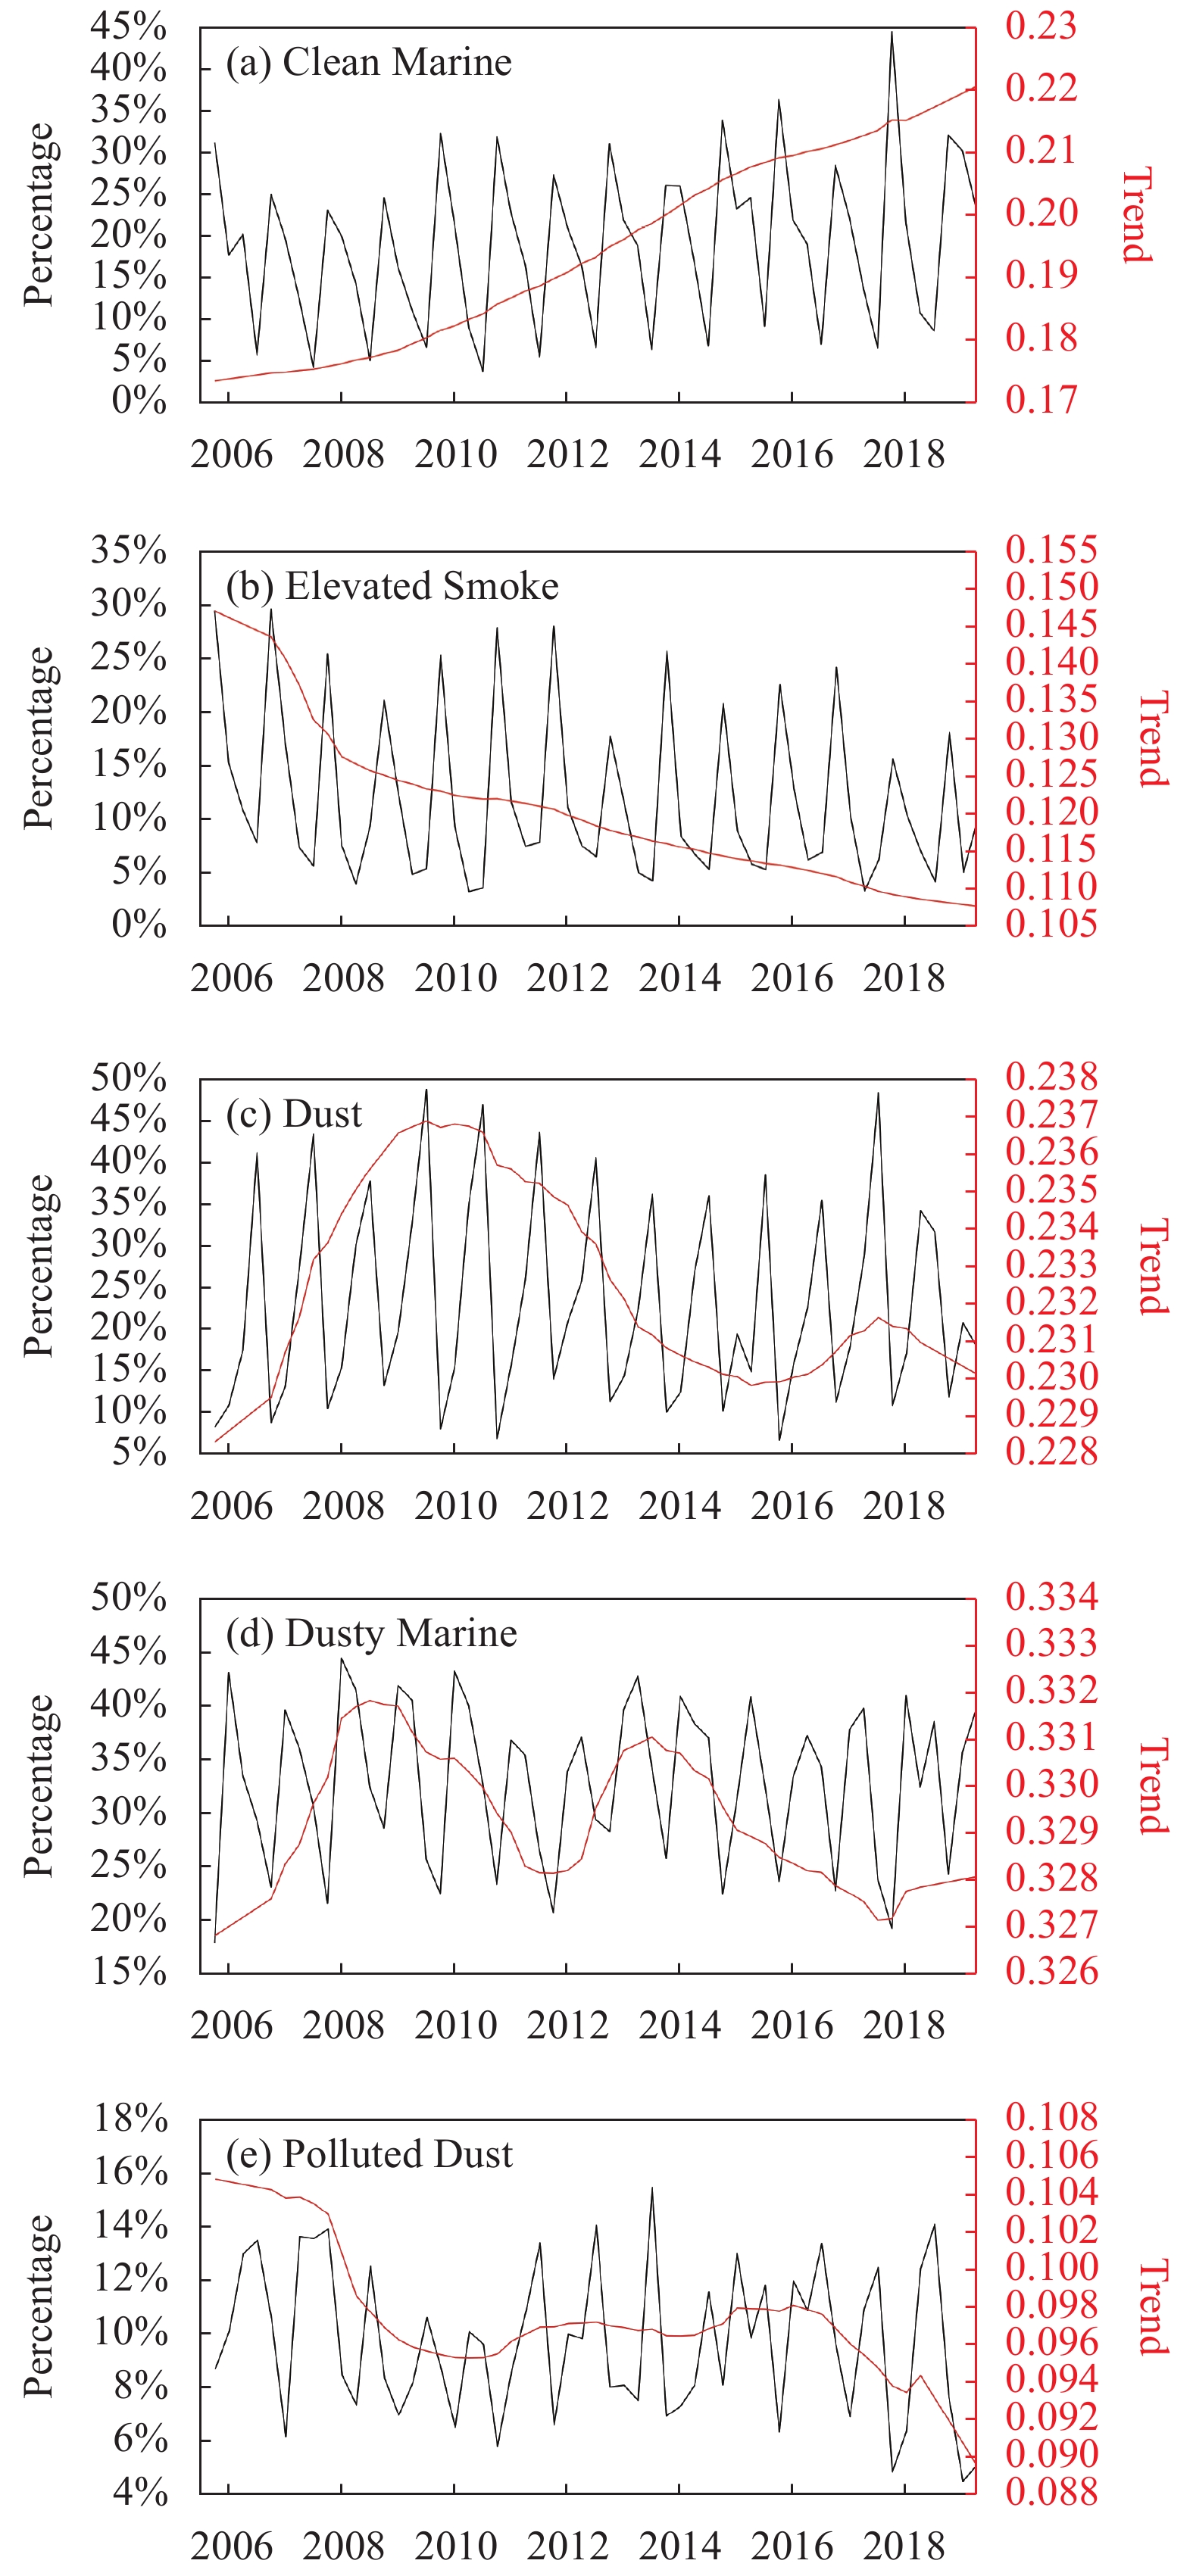
采用贝叶斯趋势分析方法,分析了2006~2019年研究区5种主要类型气溶胶占比的长期演变趋势。结果表明(图6),清洁海洋型气溶胶(Clean Marine)占比呈逐年递增的趋势,表征生物质燃烧的Elevated Smoke占比呈单调递减的趋势,与沙尘有关的 Dust 、Dusty Marine和Polluted Dust气溶胶呈无单调变化趋势。

图 6 2006~2019年不同类型气溶胶占比(黑线)的贝叶斯趋势分析结果(红线)
Figure 6. Bayesian trend analysis (red lines) of the percentages (black lines) of different types of aerosols from 2006 to 2019
-
渤海、黄海气溶胶类型的时空分布与其地理区位和大气环流形势密不可分。与沙尘有关的气溶胶类型占比近七成,清洁海洋型气溶胶占比不足两层(图2),这一结果表明,渤海、黄海气溶胶受到陆源物质特别是东亚沙尘输运的显著影响。亚洲是全球沙尘的四大源地之一,源自这里的沙尘颗粒可在13天之内经对流层环球一周[19],其沙尘总量的一半(约4亿吨)最终沉降至太平洋海域[20],而黄海是东亚沙尘长程输运最主要的影响海域[21-22]。春、秋、冬季,在西北风或北风作用下,陆源沙尘气溶胶均对研究区具有强烈影响(图5第1、3、4列);只有在夏季,研究区盛行南风[23]、陆源气溶胶影响在一年之中相对最小时,表征海洋特性的清洁海洋型气溶胶才成为研究区主导气溶胶类型(31%,图3)。
沙尘气溶胶(图4红线)和污染沙尘气溶胶(图4蓝线)集中分布在上层大气,这与沙尘主要通过高空远距离输运有关[13]。与之相反,沙尘海洋型气溶胶(图4粉线)主要分布在低层大气中,原因在于该类型气溶胶是由沙尘气溶胶与海洋气溶胶混合形成的,而海洋气溶胶主要分布在低层大气中(图4绿线)。
长期演变趋势分析显示,Dust气溶胶(图6(c))占比2006~2009年升高、2010~2016年单调递减,这与东亚陆源沙尘气溶胶的变化趋势基本一致[24-28]。
Elevated Smoke气溶胶主要是生物质燃烧的产物, 14年间研究区该类气溶胶占比逐年降低,这可能与中国大陆节能减排、空气污染治理密切相关。有研究表明,中国自2013年以来PM2.5年均减少30%~50%,SO2和CO也呈现单调下降的趋势[28]。
Elevated Smoke单调下降、清洁海洋型气溶胶占比稳定上升,这些结果可能预示着研究区气溶胶所受到的陆源影响在减弱。
Ren等[16]针对渤海、黄海、东海局部海域,基于CALIOP数据开展了气溶胶类型研究,由于其数据版本(V3版)与文中(V4版,即最新版)不同,所以相应研究结果的可比性不强。需要指出的是,与V3版相比,V4版最大的变化是增加了新的气溶胶类型Dusty Marine(在此前版本中被误分成了Polluted Dust),而该类型气溶胶是此研究区占比最高的(35%)。
-
采用14年(2006~2019年)的CALIOP星载激光雷达数据,基于最新的激光雷达气溶胶类型划分方法,研究了0.28~8.17 km高度范围内渤海、黄海气溶胶类型的时空演变特征。(1)从主导类型看,研究区占比由高到低的气溶胶类型依次为Dusty Marine (36%)、Dust (25%)、Clean Marine (17%)、Elevated Smoke (11%)和Polluted Dust (9%) (合计>97%)。与沙尘有关的3种气溶胶类型占比约70% (Dusty Marine、Dust、Polluted Dust),冬、春季该比例可达~80%。(2)从垂直分布看,各类型气溶胶具有较为鲜明的特点:Clean Marine和Dusty Marine主要分布在2.5 km高度以下;Polluted Dust和Elevated Smoke则主要分布在2.5 km以上;Dust占比随高度增加而增大。(3)从长期演变来看,14年间Elevated Smoke占比则逐年降低,Clean Marine占比逐年增加。文中的研究结果表明,渤海、黄海气溶胶受到陆源物质特别是东亚沙尘输运的显著影响,但陆源影响有减弱的趋势,星载激光雷达可为海上气溶胶的时空演变,特别是垂直分布和长期演变研究,提供不可或缺的重要数据源。
Spatiotemporal pattern of aerosol types over the Bohai and Yellow Seas observed by CALIOP
-
摘要:
采用14年(2006~2019年)的CALIOP星载激光雷达数据,基于最新的激光雷达气溶胶类型划分方法,辨识了0.28~8.17 km高度范围内渤海、黄海主导气溶胶类型,揭示了各类气溶胶的垂直分布特征,分析了其长期演变趋势和季节差异。研究发现:(1)受到东亚大陆特别是沙尘输运的显著影响,渤海、黄海主导气溶胶类型为沙尘海洋型(36%)、沙尘型(25%)、清洁海洋型(17%)、煤烟型(11%)和污染沙尘型(9%)(合计>97%),其中与沙尘有关的3种气溶胶类型占比合计近七成。(2)各类型气溶胶的垂直分布特点鲜明:清洁海洋型和沙尘海洋型气溶胶主要分布在2.5 km高度以下;污染沙尘型和煤烟型气溶胶则主要分布在2.5 km高度以上;沙尘型气溶胶占比随高度增加而增大。(3)从长期演变来看,14年间污染沙尘型气溶胶占比呈波动下降趋势,清洁海洋型气溶胶占比逐年增加,煤烟型气溶胶占比逐年降低。(4)各类型气溶胶的占比及垂直分布均具有明显的季节差异。
Abstract:Based on the 14 years(2006-2019) CALIOP data and up-to-date lidar aerosol classification method, the dominant aerosol types and the vertical distribution characteristics over the Bohai and Yellow Sea within the height range of 0.28-8.17 km were identified, and the long-term variability and seasonality were revealed. (1) The dominant aerosol types in the study area are Dusty Marine(36%), Dust(25%), Clean Marine(17%), Elevated Smoke(11%) and Polluted Dust(9%) (totally>97%), with the three types of aerosol related to dust accounting for about 70%. (2) The vertical distribution of various types of aerosols has distinct characteristics. Aerosols of Clean Marine and Dusty Marine are mainly found in the atmosphere with height below 2.5 km. Polluted Dust and Elevated Smoke are mainly above 2.5 km. The proportion of Dust aerosols increases with height. (3) In regards of the long-term variability, the percentages of Polluted Dust show a fluctuating descending trend during the past 14 years, whereas that of Clean Marine aerosol increases steadily, and that of Elevated Smoke decreases monotonously. (4) The proportion and vertical distribution of various types of aerosols exhibit obvious seasonal variability.
-
Key words:
- spaceborne Lidar /
- Bohai Sea /
- Yellow Sea /
- aerosol type /
- dust
-
图 1 研究区示意图(a)以及CALIOP轨迹(b)(黄、绿线分别为白天、夜晚轨迹)
Figure 1. (a) Schematic diagram of the study area and (b) CALIOP tracks (The yellow and green lines are day and night tracks, respectively)
图 2 2006~2019年各类气溶胶出现频次占比
Figure 2. Percentage of various types of aerosols (2006-2019)
图 3 不同季节各类型气溶胶的占比
Figure 3. Percentage of various types of aerosols in different seasons
图 4 5种主要气溶胶类型占比的垂直分布
Figure 4. Vertical distribution of percentages of the 5 dominant aerosol types
图 5 不同高度上的主导气溶胶类型(0=未确定;1=清洁海洋型;2=沙尘型;3=污染大陆/煤烟型;4=清洁大陆型;5=污染沙尘型;6=升高的煤烟型;7=沙尘海洋型)
Figure 5. Dominant aerosol types (0=Not Determined; 1=Clean Marine; 2=Dust; 3=Polluted Continental/Smoke; 4=Clean Continental; 5=Polluted Dust; 6=Elevated Smoke; 7=Dusty Marine)
-
[1] Huang L, Jiang J H, Tackett J L, et al. Seasonal and diurnal variations of aerosol extinction profile and type distribution from CALIPSO 5-year observations [J]. Journal of Geophysical Research: Atmospheres, 2013, 118: 4572-4596. doi: 10.1002/jgrd.50407 [2] Gao X X, Gui H L, Chen Y, et al. Spatiotemporal characteristics of aerosols and its effects on cloud and precipitation during summer over typical regions in China [J]. Journal of Meteorology and Environment, 2020, 36(1): 11-20. (in Chinese) [3] Kim M H, Omar A H, Tackett J L, et al. The CALIPSO version4 automated aerosol classification and lidar ratio selection algorithm [J]. Atmospheric Measurement Techniques, 2018, 11(11): 6107-6135. doi: 10.5194/amt-11-6107-2018 [4] Winker D M, Hunt W H, Mcgill M J. Initial performance assessment of CALIOP [J]. Geophysical Research Letters, 2007, 34(19): 228-262. [5] Han F, Xu J, Dang H Y,et al. Characteristic of vertical aerosol distribution over Jing-Jin-Ji area observed by CALIOP [J]. Environmental Engineering, 2017, 35(6): 108-113. (in Chinese) [6] Pan H, Wang M, Kumar K R, et al. Seasonal and vertical distributions of aerosol type extinction coefficients with an emphasis on the impact of dust aerosol on the microphysical properties of Cirrus over the Taklimakan Desert in Northwest China [J]. Atmospheric Environment, 2019, 203: 216-227. doi: 10.1016/j.atmosenv.2019.02.004 [7] Koffi B, Schulz M, Bréon F M, et al. Evaluation of the aerosol vertical distribution in global aerosol models through comparison against CALIOP measurements: AeroCom phase II results [J]. Journal of Geophysical Research: Atmospheres, 2016, 121(12): 7254-7283. doi: 10.1002/2015JD024639 [8] Sun Q, Fan X H, Xia X A. Observation and analysis of aerosol vertical distribution characteristics in north China plain [J]. Meteorological and Environmental Sciences, 2016, 39(1): 26-33. (in Chinese) [9] Yu C X, Deng X L, Shi C E, et al. The analysis of aerosol type and vertical distribution characteristics along Huaihe River based on CALIOP satellite measuring [J]. Acta Scientiae Circumstantiae, 2018, 38(4): 1317-1326. (in Chinese) [10] Mallet P E, Pujol O, Brioude J, et al. Marine aerosol distribution and variability over the pristine Southern Indian Ocean [J]. Atmospheric Environment, 2018, 182: 17-30. doi: 10.1016/j.atmosenv.2018.03.016 [11] Shan X L, Xu J, Li Y X, et al. Analysis of the origin of peak aerosol optical depth in spring time over the Gulf of Tonkin [J]. Journal of Environmental Sciences, 2016, 40: 129-137. doi: 10.1016/j.jes.2015.10.026 [12] Ji J B, Chen L Q, Wang J J, et al. Characters of the aerosol over the northwest Pacific and eastern China coastal area in autumn [J]. Journal of Applied Oceanography, 2016, 35(3): 339-347. (in Chinese) [13] Guo J, Lou M, Miao Y, et al. Trans Pacific transport of dust aerosol originated from East Asia: Insights gained from multiple observations and modeling [J]. Environmental Pollution, 2017, 230: 1030-1039. doi: 10.1016/j.envpol.2017.07.062 [14] Guo J, Zhang X, Cao C, et al. Monitoring haze episodes over Yellow Sea by combining multisensor measurements [J]. International Journal of Remote Sensing, 2010, 31(17-18): 4743-4755. [15] Ren W H, Song X Q, Wang F H. Spatiotemporal distribution of aerosols in East China Seas based on spaceborne lidar [J]. Infrared and Laser Engineering, 2018, 47(12): 1230002. (in Chinese) [16] Sun X M, Wan L, Wang H H. Sensitivity study on lidar detection of the depolarization ratio of water clouds [J]. Infrared and Laser Engineering, 2016, 45(9): 0906001. (in Chinese) doi: 10.3788/IRLA201645.0906001 [17] Winker D M, Tackett J L, Getzewich B J, et al. The global 3-D distribution of tropospheric aerosols as characterized by CALIOP [J]. Atmospheric Chemistry and Physics, 2013, 13(6): 3345-3361. doi: 10.5194/acp-13-3345-2013 [18] Zhao K, Wulder M, Hu T, et al. Detecting change-point, trend, and seasonality in satellite time series data to track abrupt changes and nonlinear dynamics: A Bayesian ensemble algorithm [J]. Remote Sensing of Environment, 2019, 232: 111181. doi: 10.1016/j.rse.2019.04.034 [19] Uno I, Eguchi K, Yumimoto K, et al. Asian dust transported one full circuit around the globe [J]. Nature Geoscience, 2009, 2(8): 557-560. doi: 10.1038/ngeo583 [20] Duce R A, Liss P S, Merrill, J T, et al. The atmospheric input of trace species to the world ocean [J]. Global Biogeochemical Cycles, 1991, 5(3): 193-259. doi: 10.1029/91GB01778 [21] Wang H, Shi G Y, Teruo A, et al. Radiative forcing due to dust aerosol over east Asia-north Pacific region during spring, 2001 [J]. Chinese Science Bulletin, 2004, 20: 2212-2219. [22] Zhang K, Gao H W. The characteristics of Asian-dust storms during 2000–2002: From the source to the sea [J]. Atmospheric Environment, 2007, 41(39): 9136-9145. doi: 10.1016/j.atmosenv.2007.08.007 [23] Wu M L, Cheng Y, Wang Y, et al. The temporal and spatial characters of gale in the northern coast of the Yellow Sea and the Bohai Sea, China [J]. Journal of Meteorology and Environment, 2012, 28(6): 65-71. (in Chinese) [24] Chin M T, Diehl Q, Tan, J, et al. Multi-decadal aerosol variations from 1980 to 2009: A perspective from observations and a global model [J]. Atmospheric Chemistry and Physics, 2014, 14(7): 3657-3690. doi: 10.5194/acp-14-3657-2014 [25] Kurosaki Y, Shinoda M, Mikami M. What caused a recent increase in dust outbreaks over East Asia? [J]. Geophysical Research Letters, 2011, 38(11): L11702. [26] Kang L, Huang, J, Chen, S, et al. Long-term trends of dust ev ents over Tibetan Plateau during 1961-2010 [J]. Atmospheric Environment, 2016, 125: 188-198. doi: 10.1016/j.atmosenv.2015.10.085 [27] Wang R, Liu B, Li H, et al. Variation of strong dust storm events in Northern China during 1978-2007 [J]. Atmospheric Research, 2017, 183: 166-172. doi: 10.1016/j.atmosres.2016.09.002 [28] Zhai S, Jacob D J, Wang X, et al. Fine particulate matter (PM2.5) trends in China, 2013–2018: separating contributions from anthropogenic emissions and meteorology [J]. Atmospheric Chemistry and Physics, 2019, 19(16): 11031-11041. doi: 10.5194/acp-19-11031-2019 -

 点击查看大图
计量
- 文章访问数: 547
- HTML全文浏览量: 202
- 被引次数: 0