


-
由于红外目标检测有着广泛的应用价值以及重要的研究价值,红外目标检测在计算机视觉领域受到了极大地关注。其在地面目标检测[1]、数字仪表读数[2]、绝缘子检测[3]和红外制导系统[4]等民用和军用领域有着广泛的应用。其中,红外舰船目标检测在海上救援、海上军事活动等方面都具有十分重要的意义。尽管大多数物体检测模型在各种检测任务中有出色的效果,但在红外图像的目标检测中仍存在受环境影响干扰大,纹理细节特征不足等问题。
红外目标检测算法分为传统红外目标检测算法和基于深度学习的红外目标检测算法。传统目标检测算法依赖基于图像特性的建模,通过建模将目标与背景分离,其在红外船舶检测方面有着广泛的应用。例如:莫文英[5]等人提出一种双通道图像分离结合局部灰度动态范围显著映射算法进行舰船目标检测。李林[6]等人提出了一种基于时间波动特征和空间结构特征的新方法,用于密集太阳光场景下的红外船舶检测。传统算法易于工程化,但是需要对不同场景建立相应的模型,泛化性较差。
目前,主流的基于深度学习的目标检测算法可以分为两大类:两阶段算法和一阶段算法。其中,两阶段的代表算法有R-CNN[7]和Faster R-CNN[8]。两阶段目标检测算法的流程分别为候选区域提取、候选区域的分类和候选区域的回归,相较于一阶段算法检测速度较慢。一阶段的代表算法有SSD[9]、RetinaNet[10]和YOLO[11-12]系列。这类算法又被称为基于回归目标分析的目标检测算法,其将目标检测过程转化为目标位置和类别信息的回归问题。随着基于深度学习的目标检测算法的迅速发展,其也被越来越多地使用在船舶目标检测算法方面,Jing Ye等[13]提出一种CAA-YOLO来缓解小型红外目标的纹理细节严重不足,信噪比低等问题。Liyuan Li等[14]基于YOLOv5算法提出一种CYSDM检测算法用于热红外遥感图像的船舶检测。Lize Miao等[15]提出了一种CBAM-Yolov5算法,将注意力模块嵌入网络用于检测船舶目标。王文杰等[16]提出一种基于YOLOv5的改进算法用于嵌入式船舶检测,其在算法中引入了SE模块以及替换了激活函数。但是无论是一阶段算法还是两阶段算法,基于矩形框的边框回归都是目标检测中一个重要的过程,回归过程的好坏会直接影响算法对目标对象定位结果的精度。文献[17]将IoU作为边界框回归损失函数优化边框回归过程,在真实框和预测框没有交集的情况下,回归效果不佳。文献[18]在IoU基础上引进了边界框回归过程中重要的3个几何因素,即重叠面积、中心点距离和长宽比,提出了CIoU边框回归损失函数。CIoU优化了边框回归,但是在回归过程中会导致梯度爆炸问题。
为了解决YOLOv5算法在海上红外船舶目标检测中存在的梯度爆炸问题和锚框与数据集不匹配的问题,文中在CIoU的基础上改进了边框回归损失函数,优化了回归过程,提升了模型的收敛效果,改善了梯度爆炸问题。改进了K-means算法,得到了适用于文中算法使用的红外船舶数据集的锚框,提升了算法对目标的检测能力。
-
YOLOv5是一种典型的单阶段目标检测算法,其网络结构如图1所示。YOLOv5检测模型网络结构由四部分构成,第一部分为输入部分;第二部分为Backbone;第三部分为Neck和第四部分Prediction。Backbone用来提取特征的主干网络为CSPDarknet,输入网络的图片经过CSPDarknet特征提取网络得到输入图片3个不同尺度的特征层,这3个特征层被称为有效特征层。YOLOv5算法在Neck位置采用了特征金字塔网络FPN(Feature Pyramid Networks, FPN)和PANet (Path Aggregation Networks)网络来加强特征融合和特征提取能力。FPN使用自上而下的采样方式,PANet是底层金字塔结构,运用上采样的方式传递特征并进行特征融合,从而获得特征图。
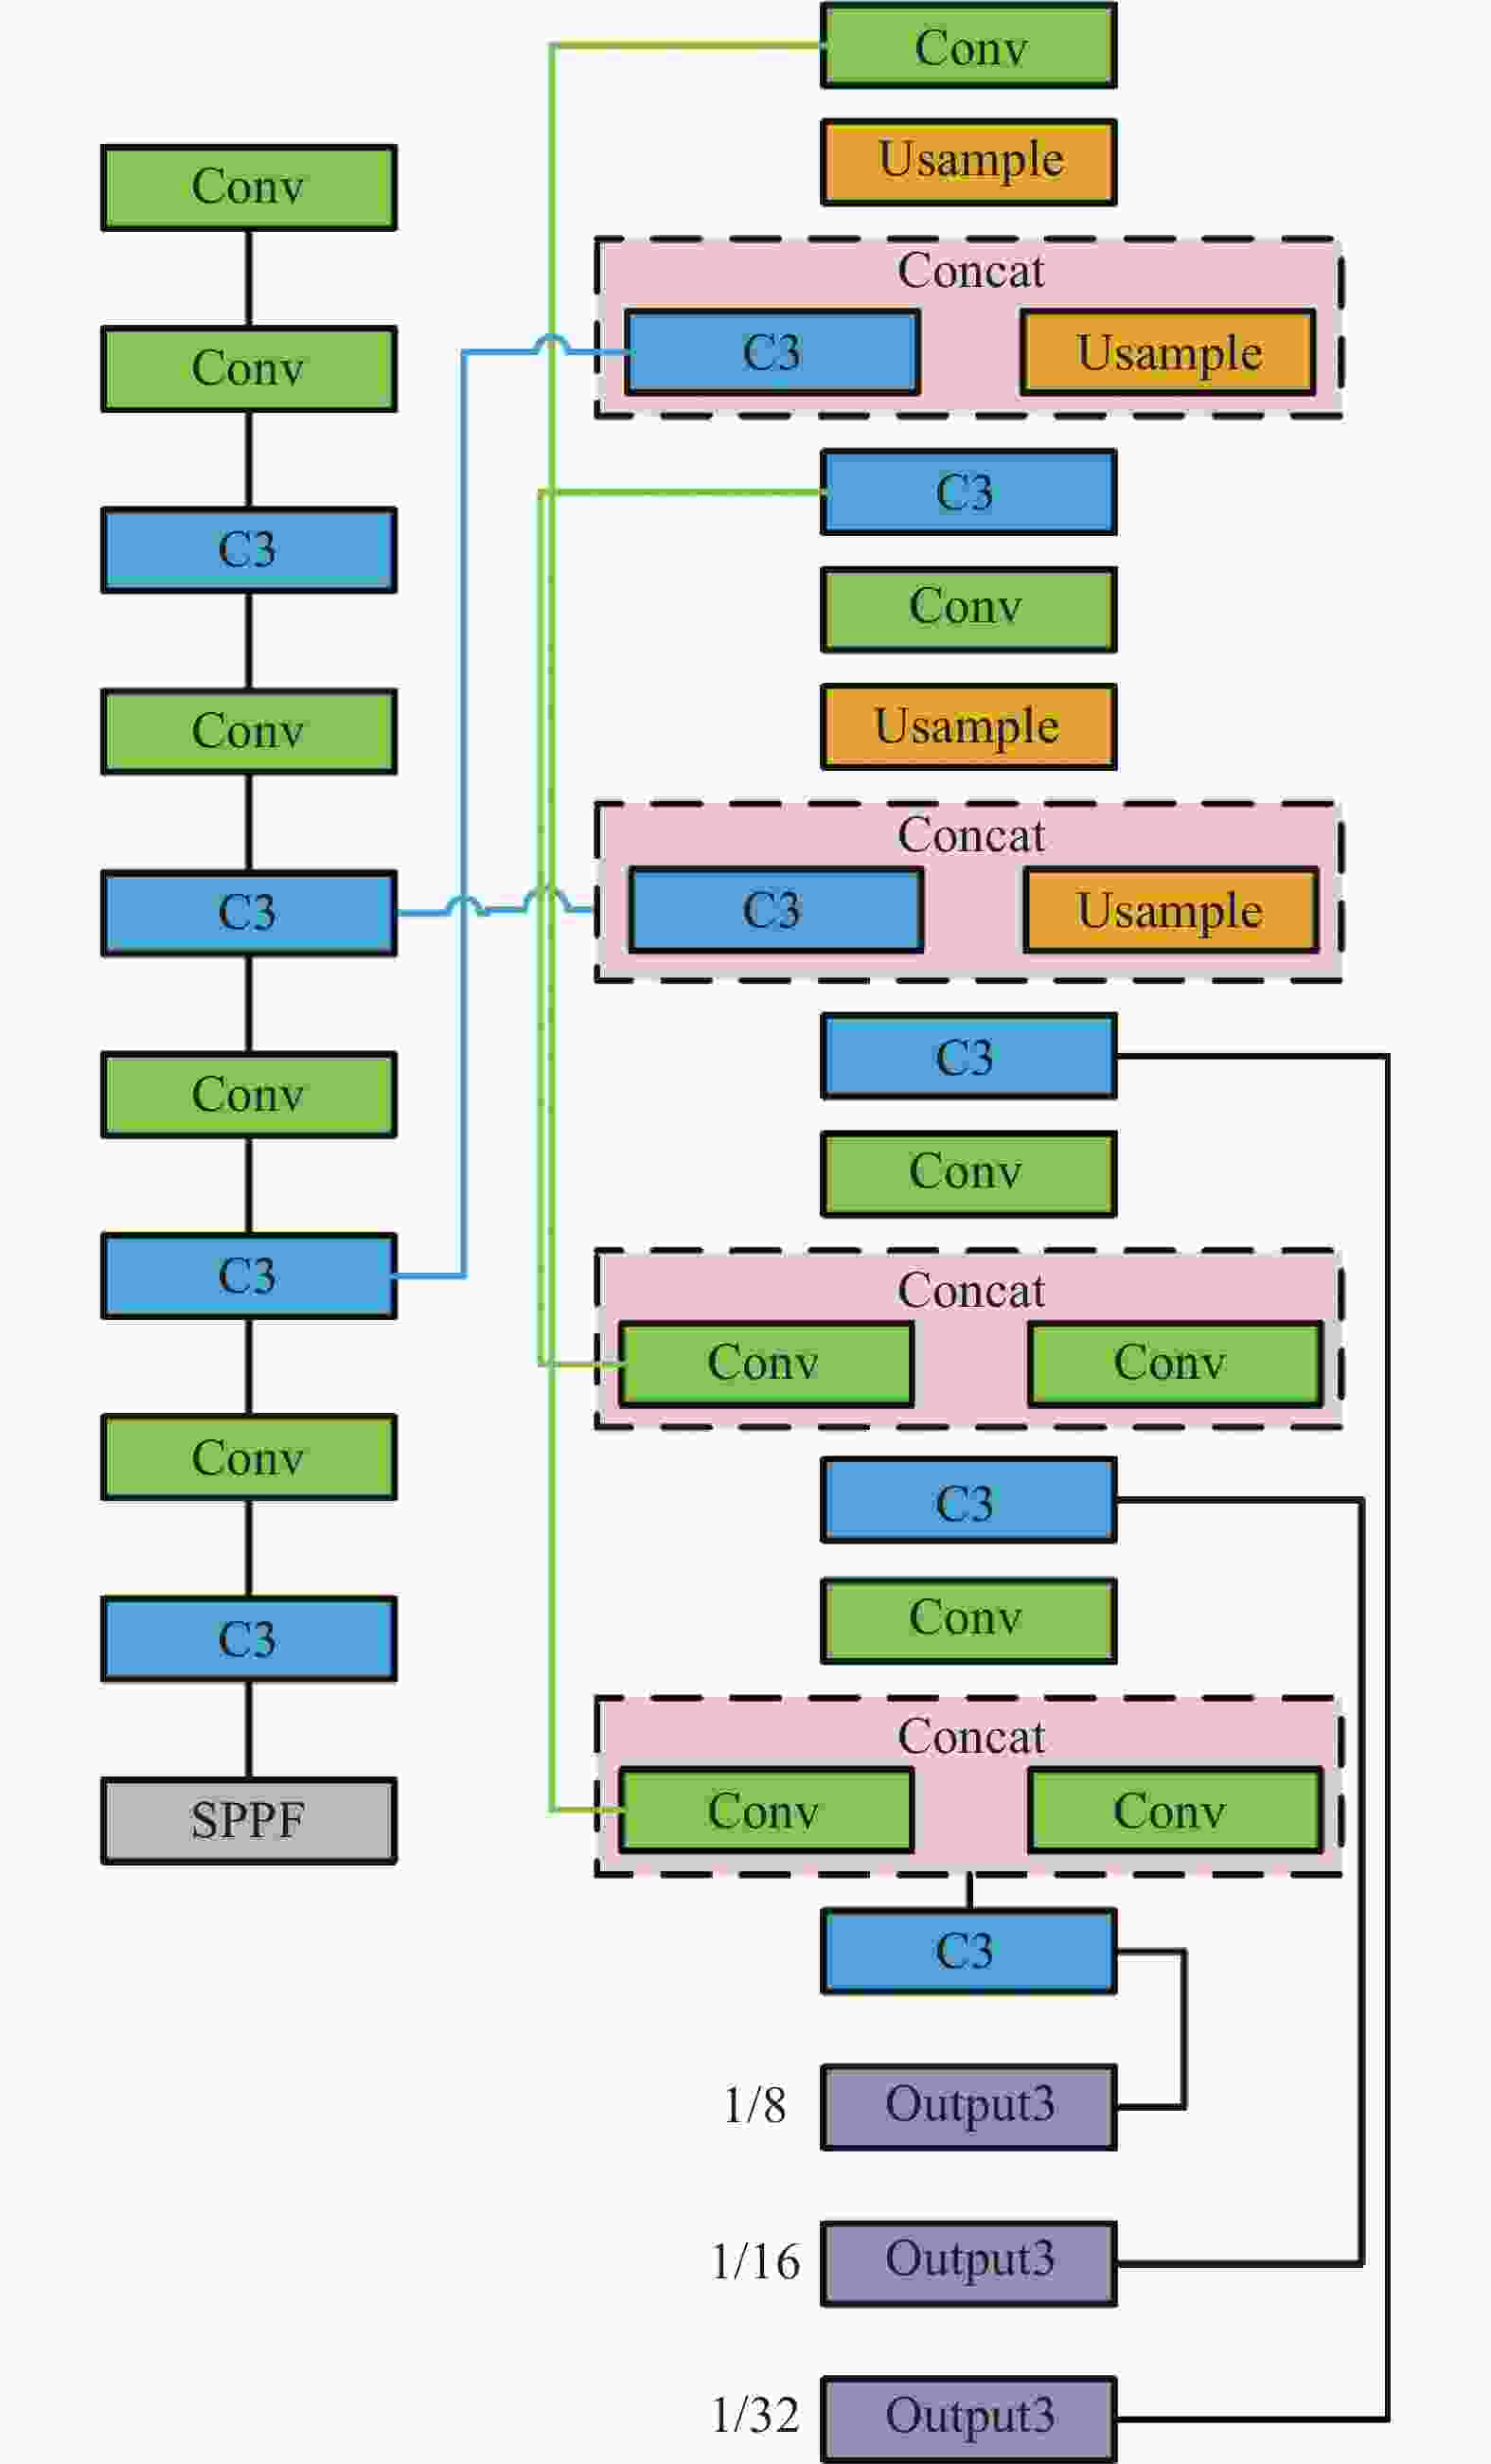
图 1 YOLOv5结构示意图
Figure 1. Structure diagram of YOLOv5
YOLOv5算法通过缩放和填充把图片调整至恰当大小,再将图片划分成S×S不重叠的网格。为了兼顾不同大小的目标,YOLOv5在预测阶段将图像划分成8×8、16×16和32×32不重叠的网格,每个格子被称为grid cell。每种尺度的grid cell设有相应大小的边界框称为锚框(anchors box)。每种尺度上生成3个大小不同的锚框,模型共设置了9个锚框。每个网格负责检测中心点坐标在该格子内的物体。预测时,模型通过计算锚框相对于目标的偏移量以及长宽的缩放比例得到候选的预测框。YOLOv5算法接着通过设定置信度阈值过滤掉一部分边界框,再对剩下的边界框使用非极大值抑制算法去除冗余边界框,得到预测结果。
-
文中的目标检测流程如图2所示,首先收集了大量的红外船舶图像,用于红外船舶目标检测研究,接着改进了K-means聚类算法得到新的锚框,之后在CIoU回归损失函数的基础上进行改进,提出了MIoU回归损失函数,最后使用红外船舶目标数据集,在改进后的YOLOv5算法上进行了实验,并对实验结果进行了分析。

图 2 目标检测流程图
Figure 2. The flow chart of target detection
-
锚框用来生成预测框,YOLO算法借鉴了Faster R-CNN的优点在YOLOv2中首次使用锚框机制,一直延用到YOLOv5。YOLOv5中一共设置了9个锚框,是由PASCAL VOC数据集聚类得到。由于锚框和数据集中标注框的IoU值决定着预测效果的好坏,因此对不同的数据集需要设置合适的锚框。YOLOv5使用K-means算法对标注框进行处理,聚类生成大小合适的锚框以适应不同尺度下的目标。
K-means是一种常见的无监督机器学习算法。K-means算法的关键之处在于通过计算平均值来选取簇族的中心。对于大部分数据紧密,少部分数据离散的数据,通过计算平均值来决定簇中心会使得计算结果不理想。同时K-means算法需要人为随机确定初始的聚类中心,因此聚类中心的选择会对聚类结果造成影响。为解决上述问题,文中对YOLOv5所用的K-means锚框算法进行改进,使得到的锚框更加符合文中所用数据集的特点,锚框尺寸更加适合船舶样本尺寸。
-
文中使用数据集一共有8402张图片,分为邮轮、散货船、军舰、帆船、皮划艇 、集装箱船、渔船七类船舶。其在数据集中所占数量分别为1306、1714、2265、5122、451、653、8102张。由于船舶形状的特殊性,标注框的长宽比会比较大或者比较小。目标框的长宽是决定锚框是否适合数据集的关键所在,对标注框长宽进行归一化处理后的结果如图3所示。从图中可以看出,大部分点分布在图像的左上方和右下方,这是符合船舶外形的。

图 3 归一化后的边框长宽分布图
Figure 3. Normalized border length and width distribution
由于数据集中离散点的存在,导致聚类中心不能很好地代表尺寸较大的预测框的簇,因此文中用中位数代替平均值作为聚类的评价标准。这样数据集中某些离散的数据点对于结果的影响会减小,中位数受到离散点影响更小,从而提高了算法的稳定性。同时为了减少初始聚类中心点对算法的影响,优化了初始聚类中心的选择方法。因此将文中所提的聚类算法命名为K-median++算法。
-
为了减小初始化聚类中心对聚类结果的影响,K-median++算法遵循在选取聚类中心时,应使各中心的间距尽量远的原则。算法实现步骤具体做法如下:
1)从数据集中随机选取一个样本点作为第一个聚类中心;
2)计算数据集除聚类中心外的其他样本X和初始聚类中心之间的最短距离,并用D(x)表示。这个值越大,被选为下一个聚类中心的概率也大。算法采用轮盘赌法按照概率大小来随机选取下一个聚类中心;
3)重复步骤2)选出k个聚类中心为止;
4)使用被选出来的k个聚类中心运行聚类算法。计算距离时采用聚类中心所表示的标注框与真实框的IOU作为衡量两个数据远近的标准;
5)所有的数据进行分组后,重新选取每个组新的聚类中心,选取方式为取其距离的中位值;
6)重复步骤4)~5),直至样本中的点到聚类中心的距离不在变化,或者变化量很小。
文中使用所提的K-median++算法对红外船舶数据集进行聚类,得到9个符合所用数据集尺寸的锚框。使用改进后聚类算法得到的锚框和改进前算法得到的锚框对比如表1所示。从表中可以看出,使用改进后聚类算法得到的锚框比之前的锚框更加符合图像中目标的大小。针对大目标的3个锚框由之前接近正方形的框变成了矩形,这样的聚类结果更加适合船舶目标的检测。
表 1 聚类结果
Table 1. Clustering results
K-means K-median++ [10, 13] [16, 11] [16, 30] [42, 17] [33, 23] [22, 44] [30, 61] [36, 81] [62, 45] [100, 29] [59, 119] [170, 55] [116, 90] [92, 147] [156, 198] [160, 221] [373, 326] [241, 109] 将聚类中心点可视化后如图4所示,可以看出改进后的聚类算法,使得聚类中心点更加对称,更符合图像中船舶目标的形状,使得边框更加贴近目标。

图 4 聚类结果分布图
Figure 4. Distribution of clustering results
为了验证K-median++算法对红外船舶图像检测效果的提升,对原始YOLOv5算法和使用了基于红外船舶数据集聚类得到的锚框的YOLOv5算法的训练结果进行对比,实验结果的mAP曲线如图5所示。从图中可以看出,使用了基于红外船舶数据集锚框的YOLOv5算法,在mAP指标上相对于初始的YOLOv5算法提高了0.7%。

图 5 改进前后聚类算法mAP曲线
Figure 5. mAP curve of clustering algorithm before and after improvement
-
在边界回归损失中,有3个重要的几何因素:重叠面积比、中心距和长宽比。重叠面积比(IoU)是衡量边框回归好坏程度的一个重要的指标,用来度量两个边框的相对重合的程度。如图6所示,A和B是两个重叠的边框,其IoU计算公式如公式(1)所示,IoU是边框回归损失函数的重要组成部分。

图 6 IoU示意图
Figure 6. Schematic diagram of intersection over union
$$ {\rm{{IoU}}} = \frac{{|{{A}} \cap {{B}}|}}{{|{{A}} \cup {{B}}|}} $$ (1) 虽然IoU在体现边框之间的相对位置和重合程度方面有许多的优点,但是对于一些特殊情况,如果两个边框不重叠时使用IoU损失作为损失函数,无法体现出两个边框的相对距离。在这种情况下IoU作为损失函数,损失函数的梯度为零,出现梯度消失的现象,导致模型无法收敛。除此之外,当真实框和预测框没有重叠区域时,不同预测框相对真实框位置不同时,这两个预测框相对于目标的损失不一样。预测框对于真实框具有更好重叠趋势的预测框回归效果更好,但普通的IoU损失无法体现这一趋势。为了解决该问题Hamid Rezatofighi等提出了GIoU[19]克服了边框无重叠面积时无法度量边框相对距离的不足。GIoU在衡量边框相对距离方面较传统IoU有了很大的提升,但仍存在不足。在两个边框是包含关系时GIoU会退化成传统IoU,导致梯度不变,影响模型的收敛效果。为避免此问题的出现,Zheng Z提出了DIoU[20]。DIoU损失在IoU的基础上,增加了中心点距离占比惩罚。其中惩罚项的分子是预测边框中心点与真实边框中心点的距离,分母是预测边框与真实边框的最小包围框对角线的长度。DIoU不包括长宽比因素,而CIoU是通过引入两个边界框长宽比角度差的平方,作为惩罚项来衡量长宽比的差异,对DIoU进行了优化。YOLOv5中初始的IoU损失函数使用的是CIoU(Complete-IoU)损失函数,该损失函数综合考虑到了矩形框的长宽比、目标与锚框之间的中心距离、交并比3个因素,虽然这可以进一步提高模型的性能,但也带来了一些问题。CIoU的损失函数为:
$$ {L_{{\rm{CIoU}}}} = 1 - {I_{{\rm{IoU}}}} + \frac{{{\rho ^2}\left( {b,{b^{2t}}} \right)}}{{{c^2}}} + \alpha v $$ (2) 式中:$ \alpha $为权重函数。
$$ \alpha = \frac{v}{{\left( {1 - {I_{{\rm{IoU}}}}} \right) + v}} $$ (3) 式中:$ v $为度量长宽比的相似性。$ v $的计算公式可表达为:
$$ v = \frac{4}{{{{\text{π }}^2}}}{\left( {\arctan \frac{{{w^{gt}}}}{{{h^{gt}}}} - \arctan \frac{w}{h}} \right)^2} $$ (4) CIoU中角度差的平方项会给边框回归带来梯度爆炸的问题,为解决此问题文中重新定义了损失公式来衡量长宽比的部分,有效地避免了梯度爆炸,并提高了稳定性。
图7为目标框和预测框示意图,$ {B_p} $和$ {B_g} $分别代表预测框和真实框。预测框和真实框的位置信息由左上角和右上角的两个顶点的坐标组成,其中$ \left( {{x_1},{y_1},{x_2},{y_2}} \right) $表示$ {B_p} $的位置,$ \left( {x_1^g,y_1^g,x_2^g,y_2^g} \right) $表示$ {B_g} $的位置。此外,$ {b_p} $和$ {b_g} $是$ {B_p} $和$ {B_g} $的中心点,$ \rho $代表它们之间的欧几里德距离。$ {B_c} $表示$ {B_p} $和$ {B_g} $围成的最小矩形,$ c $表示$ {B_c} $的对角线欧几里德距离。$ {B_c} $的坐标表示为$ \left( {{x_{c1}},{y_{c1}},{x_{c2}},{y_{c2}}} \right) $,坐标的计算过程如下:
$$ x_{c 1}=\min \left(x_1^g, x_1\right), y_{c 1}=\min \left(y_1^g, y_1\right) $$ (5) $$ x_{c 2}=\max \left(x_2^g, x_2\right), y_{c 2}=\max \left(y_2^g, y_2\right) $$ (6) 
图 7 目标框和预测框
Figure 7. Target box and prediction border
定义I代表预测框$ {B_p} $和真实框$ {B_g} $两个矩形共同面积所表示的矩形,用$ \left( {{x_{I1}},{y_{I1}},{x_{I2}},{y_{I2}}} \right) $表示矩形框的坐标。其计算过程为:
$$ {x_{I1}} = \max \left( {x_1^g,{x_1}} \right),{y_{I1}} = \max \left( {y_1^g,{y_1}} \right) $$ (7) $$ {x_{I2}} = \min \left( {x_2^g,{x_2}} \right),{y_{I2}} = \min \left( {y_2^g,{y_2}} \right) $$ (8) IoU为两个矩形框相交面积和两个矩形整体轮廓面积的比值。计算过程为:
$$ \begin{gathered} {A_g} = \left( {x_2^g - x_1^g} \right) \times \left( {y_2^g - y_1^g} \right) \\ {A_p} = \left( {{x_2} - {x_1}} \right) \times \left( {{y_2} - {y_1}} \right) \\ {A_I} = \left( {{X_{I2}} - {X_{I1}}} \right) \times \left( {{Y_{I2}} - {Y_{I1}}} \right) \\ {A_u} = {A_g} + {A_p} - {A_I} \\ {\rm{IoU}} = \frac{{{A_I}}}{{{A_u}}} \\ \end{gathered} $$ (9) 式中:$ {A_g} $和$ {A_p} $分别表示$ {B_p} $和$ {B_g} $的面积;$ {A_I} $表示$ {B_p} $和$ {B_g} $重叠的面积;$ {A_u} $表示两个边框边界围成的面积。
预测框和真实框的中心距之比为:
$$ {R_{{\text{dis}}}} = \frac{{{\rho ^2}}}{{{c^2}}} $$ (10) 式中:$ \rho $表示两个矩形框中心的最小距离;$ c $表示预测框和真实框边界围成的最小矩形对角线的距离。
为了减小CIoU长宽比对回归损失的影响,对长宽比的惩罚项进行改进。用预测框和真实框长宽比的角度差$ \theta $来反映两个框之间长宽比的差异,可表示为:
$$ \theta = {\theta _p} - {\theta _g} $$ (11) 式中:$ {\theta _p}{\text{ = }}\arctan \dfrac{{{w_p}}}{{{h_p}}} $表示预测框的倾斜角度;$ {\theta _g}{\text{ = }} \arctan \dfrac{{{w_g}}}{{{h_g}}} $表示真实框的倾斜角度。
真实框和预测框的长宽比在边框回归里的损失函数可表达为:
$$ {R_{asp}} = \left( {\frac{v}{{1 - {\rm{IoU}} + v}}} \right)\delta $$ (12) $$ v = \frac{{4{\theta ^2}}}{{{{\text{π }}^2}}},\;\delta = \frac{8}{{{{\text{π }}^2}}} \times \theta \times \left( {w \times h} \right) $$ (13) 式中:$ v $为真实边框与预测边框的宽高比损失,用来衡量长宽比的一致性;$ \delta $为一个调节参数,用于评价边界框的纵横比差异的参数。当$ \delta $的值小于零时,预测框$ {B_p} $在边界框形状回归优化过程中逆时针旋转。
在$ \delta $的表达式中$ \delta $与角度差$ \theta $和预测框的面积$ {w_p} \times {h_p} $成线性相关,可以在模型训练过程中避免梯度爆炸。同时,在尺度优化过程中,梯度和$ \theta $之间不存在反向关系,$ \delta $对$ w $和$ h $的梯度为:
$$ \frac{{\partial \delta }}{{\partial w}} = \frac{8}{{{{\text{π }}^2}}}\left( {\arctan \frac{{{w_p}}}{{{h_p}}} - \arctan \frac{w}{h} - \frac{{wh}}{{{w^2} + {h^2}}}} \right) $$ (14) $$ \frac{{\partial \delta }}{{\partial h}} = \frac{8}{{{{\text{π }}^2}}}\left( {\arctan \frac{{{w_p}}}{{{h_p}}} - \arctan \frac{w}{h} + \frac{{wh}}{{{w^2} + {h^2}}}} \right) $$ (15) 文中提出的MIoU的损失函数定义为:
$$ {\rm{MIoU}} = {\rm{IoU}} - {R_{dis}} - {R_{asp}} $$ (16) $$ \begin{split} {L_{{\rm{MIoU}}}} = & 1 - {\rm{IoU}} + {R_{dis}} + {R_{asp}} = \\ & 1 - {\rm{IoU}} + \frac{{{\rho ^2}}}{{{c^2}}} + \left( {\frac{v}{{1 - {\rm{IoU}} + v}}} \right)\delta \end{split}$$ (17) 在边框回归损失中,重叠面积比和中心距比反映了目标框和预测框的相对位置关系。根据这两个损失函数的惩罚项,可以指导预测边界框的回归,加快训练阶段的收敛速度。此外,预测框的长宽比可以避免在不重叠的情况下或者目标框完全包含预测框的情况下的无效回归,具有很好的尺度不变性。所提方法利用这3个因素进行边界框回归,避免了梯度爆炸问题,即使在边界框无交集情况下仍然存在损失梯度,可以为边界框的优化提供移动方向。提高了模型训练的收敛速度,增强了模型的稳定性。
为验证MIoU损失函数对算法的影响,把不同的边框回归损失函数嵌入到YOLO-v5算法中进行了对比实验。对比试验包含基于中心距的边框回归损失函数SmoothL1与基于重叠面积的边框回归损失函数:IoU、GIoU、DIoU和CIoU。在相同的模型训练参数的条件下分别训练具有以上边框回归损失函数的网络模型,最后对相同的目标进行检测,对结果进行比较,检测后结果如图8和图9所示。从图8可以看出:除CIoU和MIoU其余的损失函数都存在将两个距离较近的小目标检测为一个目标的情况,仅有CIoU和文中提出的MIoU边框回归函数准确的检测到了目标,避免了误检。图9所示的结果表明:基于MIoU边框回归算法,提高了图片中待检目标的召回率,能更多地检测出图像中存在的目标,避免部分目标的漏检,通过添加MIoU边框回归损失函数,有效地提高了模型对图片中待检目标的检出率和精确度。

图 8 多个损失函数的可视化图例1对比
Figure 8. Comparison of visual legend 1 of multiple loss functions
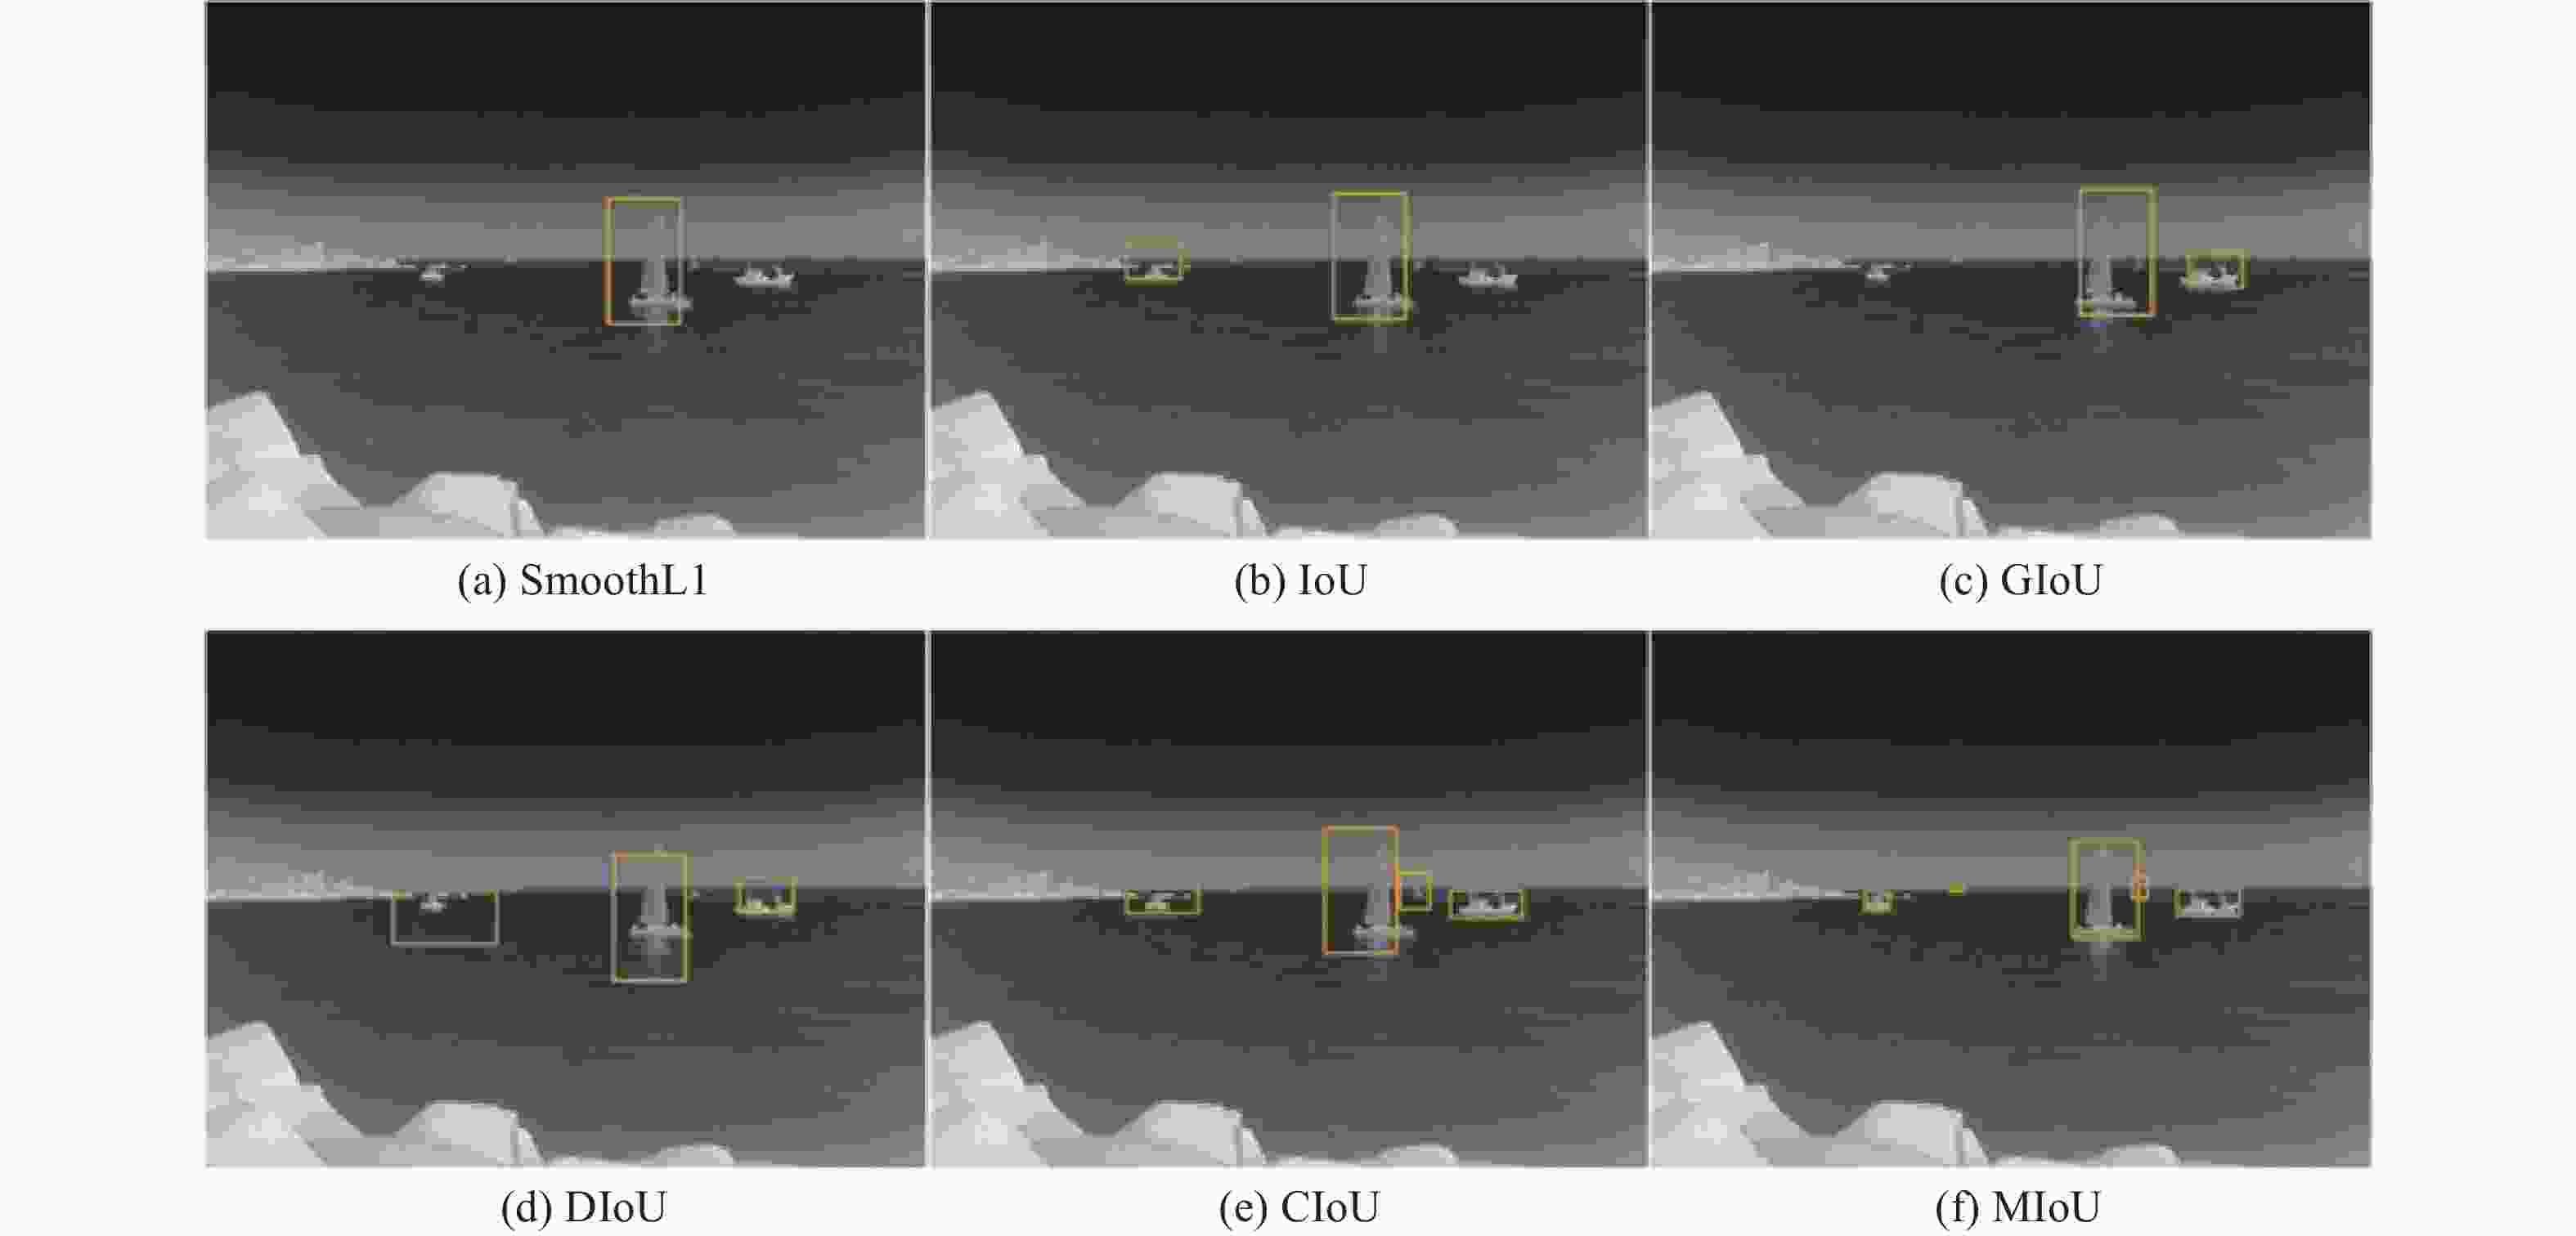
图 9 多个损失函数的可视化图例2对比
Figure 9. Comparison of visual legend 2 of multiple loss functions
检测结果表明,所提出的MIoU边框回归损失函数能更好地区别目标,避免了具有相似特征目标的误检,同时对检测精度也有一定提高,与其他边框回归损失函数具有更优秀的性能。
从对比结果可以看出,CIoU和MIoU结果比其他回归损失函数效果都好,其中MIoU比CIoU效果更好,因此对两者的损失值进行比较,得到的验证集损失如图10所示。从图中可以看出,MIoU损失函数与CIoU损失函数相比Box-loss降低了1.5个百分点。

图 10 MIoU的损失曲线
Figure 10. Loss curve of the MIoU
-
文中的实验平台是基于Windows系统的Pytorch框架,搭载了GeForce GTX 3090显卡的高性能服务器,CPU为Intel Core Gold 6271 C同时配有40 G的RAM。网络输入图片大小为640×640,模型参数优化器为SGD,初始学习率为0.01,权重衰减设置为0.0005。
实验采用精确度(Precision)、召回率(Recall)、平均精度(AP)和平均精度均值(mAP)来评价改进算法的检测效果。精确度和召回率的定义为:
$$ {\text{Precision }} = \frac{{T P}}{{T P + F P}} $$ (18) $$ {{\rm{Re}}} {\text{call }} = \frac{{T P}}{{T P + F N}} $$ (19) 式中:$ T P $、$ F P $、$ T N $和$ F N $分别表示预测对的正样本、预测错的正样本、预测对的负样本和预测错的负样本。
为验证所提方法对算法性能的提升,在文中所用数据集上进行了对比实验。对比算法包含文中改进算法、YOLOv5、YOLOv5-SE和CBAM-Yolov5,后两种是在YOLOv5基础上改进的算法。其中YOLOv5-SE,在C3种引入SE注意力模块且替换激活函数。以上方法与文中方法进行对比,实验结果如表2所示,由表可知文所提算法平均精度最高。
表 2 不同检测算法的检测精度
Table 2. Detection accuracy of different detection algorithms
Algorithms mAP@0.5 AP Liner Bulk Warship sailboat Canoe Container Fishing YOLOv5-SE 0.934% 0.936% 0.985% 0.992% 0.920% 0.889% 0.972% 0.841% CBAM-Yolov5 0.930% 0.940% 0.986% 0.985% 0.916% 0.873% 0.959% 0.844% YOLOv5 0.928% 0.939% 0.983% 0.989% 0.915% 0.876% 0.952% 0.839% Proposed algorithms 0.939% 0.944% 0.986% 0.992% 0.916% 0.875% 0.973% 0.889% 为验证MIoU回归损失与改进的锚框算法对原始算法的提升,采取如表3所示的消融对比试验。为了消除其他因素的影响,表3所有方法均使用相同的试验设置,试验结果如表4所示。各种方法对船舶目标检测效果如图11所示,在三张图例中,由第一张图片可以看出,文中所改进的算法在检测精度上有所提高。在使用改进后的边框回归损失函数后,第二张图片中连续的船舶目标被有效检测。从第三张图片可以看出,一个目标被重复检测的情况得到了改善。
表 3 各改进方法消融试验对比
Table 3. Comparison of ablation tests of various improved methods
Method K-median++ MIoU a × × d √ × c × √ Proposed method √ √ 表 4 消融试验结果
Table 4. Ablation test results
Method mAP@0.5 AP Liner Bulk Warship Sailboat Canoe Container Fishing a 92.8% 93.9% 98.3% 98.9% 91.5% 87.6% 95.2% 83.9% b 93.5% 93.6% 98.2% 99.0% 90.7% 87.9% 96.3% 88.7% c 93.0% 94.4% 98.6% 98.5% 91.6% 87.3% 95.9% 84.4% Proposed method 93.9% 94.4% 98.6% 99.2% 91.6% 87.5% 97.3% 88.9% 
图 11 算法检测结果对比图
Figure 11. Comparison chart of detection results of different algorithms
文中基础方法的mAP为92.8%,文中方法相对方法a提高了1.1%;方法b和方法c的mAP分别为93.5%和93.0%,相比文中方法mAP分别降低了0.4%和0.9%。由此可见,在模型训练过程中改进的锚框可以有效提高算法的检测效果,同时使得预测框和目标更加的贴合,减少无效的检测。
-
针对锚框与数据集目标大小不符合造成算法检测不准确、边界回归效果差的问题,对YOLOv5算法进行了改进。在锚框选择方面,改进了K-means锚框聚类算法,使用中位数代替平均数来选择聚类中心,避免了离散点的影响,使用两个点代表的边框的交并比代替两点间的距离。使得锚框与数据集目标更加匹配。在边框回归损失函数方面,改进了边框回归函数的长宽比惩罚项,有效地避免了回归过程中梯度爆炸,优化了边框回归过程。通过对比实验和消融实验对算法进行评估,结果表明:改进后的YOLOv5算法在红外数据上的平均检测精度达到了93.9%,有效地提高了算法的检测精度。文中改进算法在平均检测精度上有所提升,但对如磷光、海面杂波等复杂环境干扰下的船舶检测对算法需要进一步进行优化。
Infrared ship target detection algorithm based on YOLOv5
-
摘要: 针对红外船舶目标在海上复杂海天背景下检测困难,且数据集目标大小与锚框不符造成的算法边界回归效果差、检测不准确等问题,提出了一种基于改进YOLOv5的红外船舶目标检测算法。首先针对锚框与数据集目标形状不匹配问题,通过改变K-means++聚类算法选取簇中心的评价标准,使用中位数代替平均数来决定簇中心,改进了锚框算法,使得锚框与船舶目标更加匹配,提高了算法的平均检测精度。改进后的聚类算法得到的锚框更加符合目标的分布特点。其次针对CIoU (Complete intersection over union)存在梯度爆炸、误检和漏检问题,通过改进边框回归损失函数中关于长宽比的惩罚项提出了MIoU (Multivariate intersection over union)回归损失函数,优化了算法的回归过程,提高了算法的收敛速度和检测精度,避免了相似目标的误检和漏检。改进后的回归损失函数使边框损失降低了1.5%。在红外船舶数据集上进行了消融实验和对比实验,消融实验结果表明文中改进算法的平均检测精度值相较于标准YOLOv5算法提高了1.1%,对比实验结果表明文中改进算法相较于其他改进YOLOv5算法具有更高的平均检测精度,验证了文中改进算法的优越性,提升了红外船舶目标的检测效果。Abstract:
Objective Infrared image has the advantages of long detection distance and wide selectable working time, and plays an important role in infrared target detection in the field of ship image detection. Due to the existence of a large amount of interference information, ship target detection in a complex sea and sky background is facing enormous challenges. The target detection algorithm based on deep learning has strong ability to extract features, strong adaptability of the model to the environment, and good detection effect and stability. YOLOv5 algorithm is a widely used target detection algorithm based on deep learning, but there are still shortcomings in the process of infrared ship target detection. To solve the gradient explosion problem of YOLOv5 algorithm in marine infrared ship target detection, the border regression loss function based on CIoU is improved, the regression process is optimized, the convergence effect of the model is improved, and the gradient explosion problem is solved in this paper. To address the problem of inconsistency between the size of the target dataset and the anchor frame, the K-means algorithm is improved to obtain an anchor frame suitable for the infrared ship dataset used in this algorithm, which improves the algorithm's detection ability for infrared ship targets. Methods The K-means clustering algorithm is improved, median is used instead of the average as the selection criteria for the clustering center to reduce the impact of discrete points on the clustering results. By improving the penalty term of the aspect ratio in the frame regression loss function, a regression loss function named MIoU (Multivariate intersection over union) is proposed, which optimizes the regression process, improves the convergence speed and detection accuracy, and avoids false detection and missed detection of similar targets. Results and Discussions Using the anchor frame generated from the infrared ship dataset to train the YOLOv5 algorithm model, the experimental results show that it improves by 0.7% compared to the standard YOLOv5 algorithm on the mAP (Fig.5). Comparative experiments are conducted using different border regression loss functions in the YOLOv5. The border regression loss functions include the border regression loss function Smooth L1 based on center distance and the border regression loss function based on the overlapping area of IoU, GIoU, DIoU, and CIoU. The results show that except for CIoU and MIoU, other loss functions can detect two small targets that are relatively close to each other as a single target. Only CIoU and MIoU border regression function can accurately detect the target and avoid false detection (Fig.8). Compared to other frame loss functions, MIoU frame regression loss functions can detect more targets in the image and avoid missing detection of some targets (Fig.9). Comparing MIoU and CIoU with better test results in terms of frame loss (Fig.10) shows that the MIoU loss function Box-loss decreases by 1.5%. Comparative experiments are conducted to compare the improved YOLOv5 algorithm with other improved YOLOv5 algorithms. The experimental results are given (Tab.2). The ablation experiments are conducted on the improved method, and the results (Tab.4) and the recognition results (Fig.11) of various comparison algorithms are given. Conclusions The infrared ship target detection algorithm based on improved YOLOv5 is proposed to address the issues of inaccurate detection and poor boundary regression performance of the anchor frame and dataset target sizes that do not match the YOLOv5 algorithm. Firstly, the K-means anchor frame clustering algorithm is improved, the median is used instead of the average to select the cluster center, the impact of discrete points is avoided, and the intersection ratio of the border represented by two points to replace the distance between the two points is used. The anchor box is made more compatible with the dataset target. At the same time, the aspect ratio penalty term of the border regression function is improved, which effectively avoids gradient explosion in the regression process, and optimizes the border regression process. The ablation and contrast experiments are carried out on the infrared ship data set. The experiment results show that the average detection accuracy of the improved algorithm is 1.1% higher than the standard YOLOv5 algorithm and has higher average detection accuracy than other improved YOLOv5 algorithms, which verifies the superiority of the improved algorithm and improves the detection effect of the infrared ship target. -
Key words:
- object detection /
- infrared ship target /
- clustering algorithm /
- border regression
-
图 5 改进前后聚类算法mAP曲线
Figure 5. mAP curve of clustering algorithm before and after improvement
图 8 多个损失函数的可视化图例1对比
Figure 8. Comparison of visual legend 1 of multiple loss functions
图 9 多个损失函数的可视化图例2对比
Figure 9. Comparison of visual legend 2 of multiple loss functions
图 11 算法检测结果对比图
Figure 11. Comparison chart of detection results of different algorithms
表 1 聚类结果
Table 1. Clustering results
K-means K-median++ [10, 13] [16, 11] [16, 30] [42, 17] [33, 23] [22, 44] [30, 61] [36, 81] [62, 45] [100, 29] [59, 119] [170, 55] [116, 90] [92, 147] [156, 198] [160, 221] [373, 326] [241, 109]  下载: 导出CSV
表 2 不同检测算法的检测精度
Table 2. Detection accuracy of different detection algorithms
Algorithms mAP@0.5 AP Liner Bulk Warship sailboat Canoe Container Fishing YOLOv5-SE 0.934% 0.936% 0.985% 0.992% 0.920% 0.889% 0.972% 0.841% CBAM-Yolov5 0.930% 0.940% 0.986% 0.985% 0.916% 0.873% 0.959% 0.844% YOLOv5 0.928% 0.939% 0.983% 0.989% 0.915% 0.876% 0.952% 0.839% Proposed algorithms 0.939% 0.944% 0.986% 0.992% 0.916% 0.875% 0.973% 0.889%
下载: 导出CSV
表 3 各改进方法消融试验对比
Table 3. Comparison of ablation tests of various improved methods
Method K-median++ MIoU a × × d √ × c × √ Proposed method √ √
下载: 导出CSV
表 4 消融试验结果
Table 4. Ablation test results
Method mAP@0.5 AP Liner Bulk Warship Sailboat Canoe Container Fishing a 92.8% 93.9% 98.3% 98.9% 91.5% 87.6% 95.2% 83.9% b 93.5% 93.6% 98.2% 99.0% 90.7% 87.9% 96.3% 88.7% c 93.0% 94.4% 98.6% 98.5% 91.6% 87.3% 95.9% 84.4% Proposed method 93.9% 94.4% 98.6% 99.2% 91.6% 87.5% 97.3% 88.9%
下载: 导出CSV
-
[1] 赵晓枫, 徐叶斌, 吴飞, 等. 基于并行注意力机制的地面红外目标检测方法(特邀)[J]. 红外与激光工程, 2022, 51(04): 100-107. doi: 10.3788/IRLA20210290 Zhao Xiaofeng, Xu Yebin, Wu Fei, et al. Ground infrared target detection method based on a parallel attention mechanism (Invited) [J]. Infrared and Laser Engineering, 2022, 51(4): 20210290. (in Chinese) doi: 10.3788/IRLA20210290 [2] 汤鹏, 刘毅, 魏宏光, 等. 基于Mask-RCNN海上升压站数字式仪表读数的自动识别算法[J]. 红外与激光工程, 2021, 50(S2): 163-170. doi: 10.3788/IRLA20211057 Tang Peng, Liu Yi, Wei Hongguang, et al. Automatic recognition algorithm of digital instrument reading in offshore booster station based on Mask-RCNN [J]. Infrared and Laser Engineering, 2021, 50(S2): 20211057. (in Chinese) doi: 10.3788/IRLA20211057 [3] 陈明, 赵连飞, 苑立民, 等. 基于特征选择YOLOv3网络的红外图像绝缘子检测方法[J]. 红外与激光工程, 2020, 49(S2): 262-267. Chen Ming, Zhao Lianfei, Yuan Limin, et al. Insulator detection method based on feature selection YOLOv3 network [J]. Infrared and Laser Engineering, 2020, 49(S2): 20200401. (in Chinese) [4] Xie F, Dong M, Wang X, et al. Infrared small-target detection using multiscale local average gray difference measure [J]. Electronics, 2022, 11(10): 1547. doi: 10.3390/electronics11101547 [5] Mo W, Pei J. Nighttime infrared ship target detection based on two-channel image separation combined with saliency mapping of local grayscale dynamic range [J]. Infrared Physics & Technology, 2022, 127: 104416. [6] Li L, Liu G, Li Z, et al. Infrared ship detection based on time fluctuation feature and space structure feature in sun-glint scene [J]. Infrared Physics & Technology, 2021, 115: 103693. [7] Girshick R, Donahue J, Darrell T, et al. Rich feature hierarchies for accurate object detection and semantic segmentation[C]//Proceedings of the IEEE Conference on Computer Vision and Pattern Recognition, 2014: 580−587. [8] Ren S, He K, Girshick R, et al. Faster R-CNN: Towards real-time object detection with region proposal networks [J]. Advances in Neural Information Processing Systems, 2015, 39(6): 1137-1149. [9] Liu W, Anguelov D, Erhan D, et al. SSD: Single shot multibox detector[C]//European Conference on Computer Vision. Springer, Cham, 2016: 21−37. [10] Lin T Y, Goyal P, Girshick R, et al. Focal loss for dense object detection [C]//Proceedings of IEEE International Conference on Computer Vision, 2017: 2980−2988. [11] Redmon J, Farhadi A. Yolov3: An incremental improve-ment[EB/OL]. (2018-04-08)[2023-01-05]. https://arxiv.org/abs/180402767. [12] Bochkovskiy A, Wang C, Liao H. YOLOv4: Optimal speed and accuracy of object detection [EB/OL]. (2020-04-23)[2023-01-05]. https://arxiv.org/abs/2004. 10934. [13] Ye J, Yuan Z, Qian C, et al. CAA-YOLO: Combined-attention-augmented YOLO for infrared ocean ships detection [J]. Sensors, 2022, 22(10): 3782. doi: 10.3390/s22103782 [14] Li L, Jiang L, Zhang J, et al. A complete YOLO-based ship detection method for thermal infrared remote sensing images under complex backgrounds [J]. Remote Sensing, 2022, 14(7): 1534. doi: 10.3390/rs14071534 [15] Miao L, Li N, Zhou M, et al. CBAM-Yolov5: improved Yolov5 based on attention model for infrared ship detection[C]//International Conference on Computer Graphics, Artificial Intelligence, and Data Processing, SPIE, 2022, 12168: 564−571. [16] 王文杰, 何小海, 卿粼波, 等. 改进 YOLOv5的船舶检测算法及嵌入式实现[J]. 无线电工程, 2022, 52(12): 2116−2123. Wang Wenjie, He Xiaohai, Qing Linbo, et al. Improved YOLOv5 ship detection algorithm and embedded implemen-tation [J]. Radio Engineering, 2022, 52(12): 2116-2123. (in Chinese) [17] Zhou D, Fang J, Song X, et al. Iou loss for 2D/3D object detection[C]//International Conference on 3D Vision, 2019: 85-94. [18] Zheng Z, Wang P, Ren D, et al. Enhancing geometric factors in model learning and inference for object detection and instance segmentation [J]. IEEE Transactions on Cybernetics, 2021, 52(8): 8574-8586. [19] Rezatofighi H, Tsoi N, Gwak J, et al. Generalized intersection over union: a metric and a loss for bounding box regre-ssion[C]//2019 IEEE/CVF Conference on Computer Vision and Pattern Recognition, 2019: 658-666. [20] Zheng Z, Wang P, Liu W, et al. Distance-IoU loss: faster and better learning for bounding box regression[C]//Proceedings of the Association for the Advance of Artificial Intelligence Conference on Artificial Intelligence, 2020: 12993-13000. -

 点击查看大图

计量
- 文章访问数: 198
- HTML全文浏览量: 57
- PDF下载量: 84
- 被引次数: 0

