


-
粮食安全问题一直是国内外关注的热点。作物的种植范围、粮食产量等数据是农业生产的重要指标,是国家制定粮食政策和国民经济发展计划的重要依据。作物遥感分类识别是提取作物种植面积分布、监测作物长势和进行作物估产的前提和基础[1-3]。
目前,作物遥感分类方法众多,优势各异,应用性不同。近年来,卫星遥感数据结合机器学习算法进行作物分类识别成为国内外学者的研究热点,常用的分类算法,如决策树(Decision Tree, DT)[4-6]、最大似然法(Maximum Likelihood, ML)[7]、支持向量机(Support Vector Machine, SVM)[8-9]等,被诸多学者使用。潘琛[10]等阐述了决策树分类器的结构与理论基础,对决策树算法的发展趋势进行归纳总结,并使用TM数据对徐州市地物、地貌色彩的差异进行分类实验,依据感兴趣区类别进行图像分类且分类效果较好。徐新刚[7]等使用Quick Bird高分辨率多光谱遥感影像,采用最大似然法和监督分类方法并结合多尺度遥感影像信息提取原理,对绵阳实验区的冬小麦与油菜等作物进行分类实验,获得较高精度的作物分类结果。谭琨[8]等在分析SVM分类方法的基础上构建了一种基于SVM的高光谱遥感图像分类模型,实验结果表明:这种分类器简单高效且分类精度高,是一种有效的遥感图像分类方法。然而,随着土地利用范围不断拓展深化以及区域资源环境实时变化,使得传统分类方法难以满足高精度作物分类的需求。随机森林算法[11]自2001年提出伊始,就以其优越的性能在国外诸多领域得到广泛应用,相比而言,国内采用该方法对农业耕种区作物分类识别的研究较少。而且,传统的分类方法更多是针对单一时相影像进行分类。鉴于不同作物在同一生育期下容易出现“同物异谱、同谱异物”现象,导致上述方法的分类效果较差。经文献调研,利用多时相影像结合物候信息,可以有效提高作物的分类精度[12-14]。魏鹏飞[14]等利用多时相时间序列的高分一号GF1/WFV遥感影像数据,结合作物植被指数特征,采用决策树分类方法进行作物提取,相比较传统利用单一时相分类方法有效提高作物分类精度。
综上,笔者所在团队以作物种植种类较为复杂的内蒙古自治区扎赉特旗现代农业示范园为研究区域,探讨多时相Sentinel-2卫星影像和随机森林分类的机器学习模型对研究区作物分类效果。评估基于时间序列Sentinel-2影像的随机森林算法对农耕区作物分类的适用性,从而为作物精细遥感分类提供可用的技术方法参考。
-
研究区位于我国内蒙古自治区兴安盟扎赉特旗现代农业示范园区(122.85°~123.35°E,46.59~46.81°N),该区域地处大兴安岭南麓向松嫩平原延伸的过度地带,位于黑龙江、吉林、内蒙古三省交接处。该区地势多为平原丘陵,平均海拔130 m,总面积约为493.61 km2,研究区概况如图1所示。园区所在位置属典型的温带大陆性气候,年平均气温3.24 ℃,年平均降水量400 mm,无霜期105~135天。园区内种植连片的水稻、玉米、甜叶菊、旱稻和大豆,此外还零散分布裸露的田块、林地和居民点等。对于玉米、水稻和大豆等秋季作物,其播种和插秧的时间一般在五月底进行。水稻在插秧前要对田块进行灌溉,然后再将秧苗移植到田块中,这使得水稻地块在生长早期具有水田特征。表1为水稻、玉米、甜叶菊、旱稻和大豆等五种主要农作物的生育期时间表。

Figure 1. Geographical location and sample distributions of the study area
Type May June July August September October E M L E M L E M L E M L E M L E M Rice Sowing Tillering Heading Filling Maturity Soybean Sowing Seeding Flowering Podding Filling Maturity Stevia Transplanting Branching Flowering Maturity Corn Sowing Seeding Jointing Tasseling Filling Maturity Dry rice Sowing Tillering Heading Filling Maturity Note: E means the early 10 days of a month,M is the middle 10 days,and L represents the lately 10 days. Table 1. Growth period of five crops in the study area
-
Sentinel-2遥感卫星于2015年6月由欧空局成功发射,该系列卫星具有时空分辨率高、光谱信息丰富,且获取成本低廉的优点。为农耕区作物分类提供了新的数据源。此研究中Sentinel-2遥感影像是通过ESA数据共享网站(
https://scihub.copernicus.eu/ )免费下载。研究区种植作物结构多样化,为了充分覆盖作物生长周期,获取作物有效信息,选取成像时间为2019年5月22日至2019年10月4日,共9景影像,影像数据列表如表2所示。Data time Sensor Quality 2019-05-22 Sentinel-2A Best 2019-06-11 Sentinel-2A Good 2019-06-21 Sentinel-2A Best 2019-07-01 Sentinel-2A Good 2019-08-15 Sentinel-2B Best 2019-08-30 Sentinel-2A Best 2019-09-14 Sentinel-2B Best 2019-09-24 Sentinel-2B Best 2019-10-04 Sentinel-2B Best Table 2. Data lists of Sentinel-2 images
为确保研究区影像质量,所选取影像云量控制在30%以内。为了更好地观察研究区作物光谱指数时序变化趋势,保持影像时序性效果,所选取的影像成像时间间隔尽量保持一致。Sentinel-2遥感卫星搭载的多光谱传感器(MSI)可以提供从可见光、近红外到短波红外等13个波段的光谱信息,如表3所示。包含10 m、20 m和60 m中、高空间分辨率的遥感影像。此研究选取10 m分辨率的红(Red)、绿(Green)、蓝(Blue)和近红外(NIR) 4个波段的影像数据进行分析。
Sentinel-2 bands Wavelength/μm Reflection/m Band1-Coastal aerosol 0.443 60 Band2-Blue 0.490 10 Band3-Green 0.560 10 Band4-Red 0.665 10 Band5-Vegetation red edge 0.705 20 Band6-Vegetation red edge 0.740 20 Band7-Vegetation red edge 0.783 20 Band8-NIR 0.842 10 Band8A-Vegetation red edge 0.865 20 Band9-Water vapour 0.945 60 Band10-SWIR-Cirrus 1.375 60 Band11-SWIR1 1.610 20 Band12-SWIR2 2.190 20 Table 3. Spectral bands of the Sentinel-2 sensors (S2A & S2B)
-
外业调查数据:2019年6月和8月在研究区进行野外实地调查,利用手持GPS采集研究区主要作物的样本点坐标。前后共获取样本点84个,其中水稻11个、大豆8个、甜叶菊38个、玉米2个以及旱稻25个。采集的样本点数据通过软件制作矢量图层,为后续选取样本区提供地面数据支持。
-
为了提高卫星影像质量,保证分类精度,需要对下载的Sentinel-2影像进行预处理。下载的Level-1C数据是经过正射校正和几何精校正的大气表观反射率产品,并没有进行大气校正处理。此研究利用ESA发布的大气校正处理器插件Sen2Cor进行大气校正,L1C级数据大气校正之后最终得到L2A级数据,处理后的数据包括水蒸汽图像(Water vapor)、大气底层反射率图像(Bottom of Atmosphere,BOA)等。大气校正后的L2A级数据,使用SNAP软件对分辨率为10 m的红、绿、蓝和近红波段进行导出,并保存为ENVI格式,完成波段融合、影像拼接和研究区裁剪等步骤后,最终得到研究区范围内的Sentinel-2影像数据集。
利用野外采集的作物样本点,通过目视解译的方法,随机选择作物感兴趣区域,作为样本集,样本集分布如图1所示。通过对样本区域进行统计,总共获取了样本点像元83279个,并随机抽取训练样本集(总样本点70%),用来对研究区作物进行分类识别,随机抽取验证样本集(总样本点30%),用来做分类后的精度验证。
-
遥感影像数据中像元光谱值的大小会因为地物类型的改变而产生变化,地物间光谱值的差异性和其独特的光谱特性构成了遥感识别地物的基础[1]。植被指数根据植被的光谱特性,将卫星可见光和近红外波段进行组合,它在一定条件下能用来定量说明植被的生长状况[2]。经实验观察,研究区内的作物在不同生长时期,其光谱曲线有明显的变化,为研究分类模型构建提供了有效的理论支持。
此研究通过对比同一时期不同作物的光谱指数特征,找出差异最明显时期,确定作物划分的阈值区间,利用决策树分类模型提取研究区不同作物地块。再选取光谱特征差异性明显的时期,构建光谱指数时序特征影像集,采用随机森林、支持向量机和最大似然法对研究区作物进行分类识别。
此研究选取归一化差值植被指数[15](Normalized Difference Vegetation Index, NDVI)、比值植被指数[16](Ratio Vegetation Index, RVI)、增强型植被指[17-18](Enhanced Vegetation Index, EVI)和近红外波段[19] Ref(NIR)作为分类指标。其中NDVI和EVI在植被信息提取和地物识别方面应用最为广泛和有效。水稻的Ref (NIR)波段与其他作物光谱差异性最为明显,可以有效区分水稻地块,故引用Ref (NIR)波段。旱稻、玉米的NDVI、EVI和Ref (NIR)时序特征曲线差异性不明显,为更好地识别研究区旱稻、玉米的种植区域,引入RVI指数补充。各类指标描述如表4所示。
Indicator Description Source Normalized Difference Vegetation Index(NDVI) ${\rm NDVI} = \dfrac{ { {\rho _{\rm NIR} } - {\rho _{\rm RED} } } }{ { {\rho _{\rm NIR} } + {\rho _{\rm RED} } } }$ Ref.[15] Ratio Vegetation Index(RVI) ${\rm RVI} = \dfrac{ { {\rho _{\rm NIR} } } }{ { {\rho _{\rm RED} } } }$ Ref. [16] Enhanced Vegetation Index(EVI) ${\rm EVI} = 2.5×\dfrac{ { {\rho _{\rm NIR} } - {\rho _{\rm RED} } } }{ { {\rho _{\rm NIR} } + 6.0×{\rho _{\rm RED} } - 7.5×{\rho _{\rm BLUE} } + L} }$ Ref. [17-18] Near Infrared Ray(Ref(NIR)) The reflection of Band-8 in Tab.3 Ref. [19] Notes: In the formula, $ {\mathrm{\rho }}_{\mathrm{N}\mathrm{I}\mathrm{R}} $ is the near-infrared band reflectivity, $ {\mathrm{\rho }}_{\mathrm{R}\mathrm{E}\mathrm{D}} $ is the red band reflectivity, $ {\mathrm{\rho }}_{\mathrm{B}\mathrm{L}\mathrm{U}\mathrm{E}} $ is the blue band reflectivity and L is the soil adjustment coefficient of 1. Table 4. Classification indicators used in the study
-
此研究使用到的分类方法有随机森林(Random Forest, RF)、决策树、支持向量机和最大似然法4种。
基于决策树算法改进的随机森林算法拥有广阔的应用前景[20-22]。它是利用多个决策树对样本进行训练、分类并预测的一种算法,主要应用于回归和分类场景。它的基本单元是决策树,而它的本质属于机器学习的一大分支—集成学习(Ensemble Learning)方法。随机森林中随机是核心,通过随机选择样本,降低了决策树之间的相关性。随机在原始训练数据中有放回的选取等量的数据作为训练样本,建立决策树时,随机选取一部分特征建立决策树。从另一个角度解释,每棵决策树都是一个分类器,随机森林生成N棵树会有N个分类结果。对所有分类器的结果进行投票,投票次数最多的类别为最终结果。
决策树是一种归纳推理的分类方法,通过建立树形结构,在其中每个内部节点表示属性测试,对图像各类信息值进行比较,得出新的分支当作新的节点更新规则,继续分类直到最终得到想要的分类结果。适合于分层分样的样本分类统计工作,而且在一定范围内分类精度很高。
支持向量机是一类按监督学习方式对数据进行二元分类的广义线性分类器,其决策边界是对学习样本求解的最大边距超平面,解决复杂数据分类问题,它适用于高维特征空间、小样本统计学习。
最大似然法也称为最大概似估计或最大似然估计,是求估计的另一种方法。该方法通过对感兴趣区域里需分类像元的统计,得出均值等参数后,确定一个专门分类的函数,将图像中待分类的像元点带入该分类函数后进行扫描,把函数返回值最大的类别作为被归属类别,通过统计分类像元,得到分类的效果。
此研究采用的随机森林分类模型、决策树、支持向量机和最大似然法4种分类方法都是基于ENVI5.3来实现。通过对比4种方法的分类结果,突出随机森林分类的优势。对研究区作物分类识别后,利用随机选取的验证样本集,通过计算混淆矩阵,得出每种作物的制图精度和用户精度,并将4种分类方法的总体分类精度和Kappa系数作为分类结果的精度评价指标,精度验证的计算公式如表5所示。
Type Calculation formula Mapping accuracy $\mathrm{P}\mathrm{A}=\dfrac{ {X}_{ii} }{ {X}_{j} }×100\%$ User accuracy $\mathrm{U}\mathrm{A}=\dfrac{ {X}_{ii} }{ {X}_{i} }×100\%$ Overall accuracy $\mathrm{O}\mathrm{A}=\displaystyle\sum _{i=1}^{k}\dfrac{ {X}_{ii} }{N}×100\%$ Kappa coefficient ${{K} } = \dfrac{ {N\displaystyle\sum\nolimits_{i = 1}^k { {X_{ii} } } - \sum\nolimits_{i = 1}^k { {X_i}{X_j} } } }{ { {N^2} - \displaystyle\sum\nolimits_{i = 1}^k { {X_i}{X_j} } } }$ Notes: where k represents the number of rows and columns of the confusion matrix, Xii represents the value on the diagonal of the confusion matrix that is the number of pixels correctly classified, N represents the total number of pixels verified, Xi represents the i row of the confusion matrix. The sum of elements, Xj represents the sum of elements in the j column of the confusion matrix. Table 5. Formulas of accuracy evaluation
-
研究区主要作物的NDVI、EVI、RVI和Ref (NIR)时序特征曲线如图2所示。由图2(a)可以看出水体、道路和居民区等非耕地的NDVI时间序列曲线处于稳定状态,平均值在0.10~0.20之间,在8月和9月与其他作物的值差异最为明显,通过实验发现8月15日影像的NDVI值区分非耕地效果较好,此时非耕地的NDVI最大、最小值分别为0.75和−0.20,通过与其他作物相同时期NDVI最值对比,最后设置阈值NDVI8/15>0.48将水体、道路及居民区剔除掉。5月份研究区作物处于幼苗阶段,植物地表覆盖度低,此时林地生长较为茂盛,其NDVI值明显高于其他作物,可以利用林地NDVI值,将其剔除。5月22日林地NDVI最小值为0.63,大于同时期其他作物NDVI值,因此设置阈值NDVI5/22≥0.63,可以将林地剔除。将识别出的水体、道路、居民区和林地地块进行掩膜,方便后续进行研究区主要作物的分类识别。

Figure 2. Temporal changes of NDVI (a), RVI (b), EVI (c) and Ref (NIR) (d) for main crops
-
从图2可以看出,作物前期生长较为缓慢,光谱指数特征差异不明显。进入6月下旬,作物对叶绿素吸收能力开始增强,生长迅速,Ref (NIR)逐渐增加,作物长势明显,植被指数快速增长且光谱指数特征增长趋势较为一致。玉米、水稻和大豆在7、8月份,4种光谱指数达到饱和状态,并保持稳定。8月份除了旱稻,其余作物的Ref (NIR)达到峰值。甜叶菊在这一时期仍处于生长阶段,EVI和Ref (NIR)变化规律相似,上升到峰值后,保持稳定状态。8月下旬开始,作物进入灌浆期,营养器官能量吸收衰减,吸收的能量更多向生殖器官转移。作物的NDVI、EVI和Ref (NIR)开始降低。随着水稻、旱稻、玉米进入开花期,大豆进入结痂期,这4种作物的EVI和RVI值达到最大。9月中上旬甜叶菊的RVI和NDVI时间序列曲线出现峰值,这是因为此时甜叶菊处于开花期,导致甜叶菊RVI和NDVI峰值出现的时间较为靠后。9月后,各作物的指数特征都出现明显下降的趋势。
-
通过对比作物的光谱时间序列曲线变化特征,发现Ref (NIR)可以用来区分大豆和水稻,并且对水稻区分效果较好。Ref (NIR)结合EVI,可以提高大豆识别精度。甜叶菊9月14日和8月15日的NDVI、RVI值做差作为筛选条件,可以较好地识别出甜叶菊地块。玉米和旱稻地块混种现象严重,区分难度较大,用到了NDVI、RVI、EVI和Ref (NIR) 4种光谱特征指数来识别玉米和旱稻地块。此研究选取基于时间序列影像的多种特征指数,采用决策树方法进行主要作物分类提取过程如图3所示。
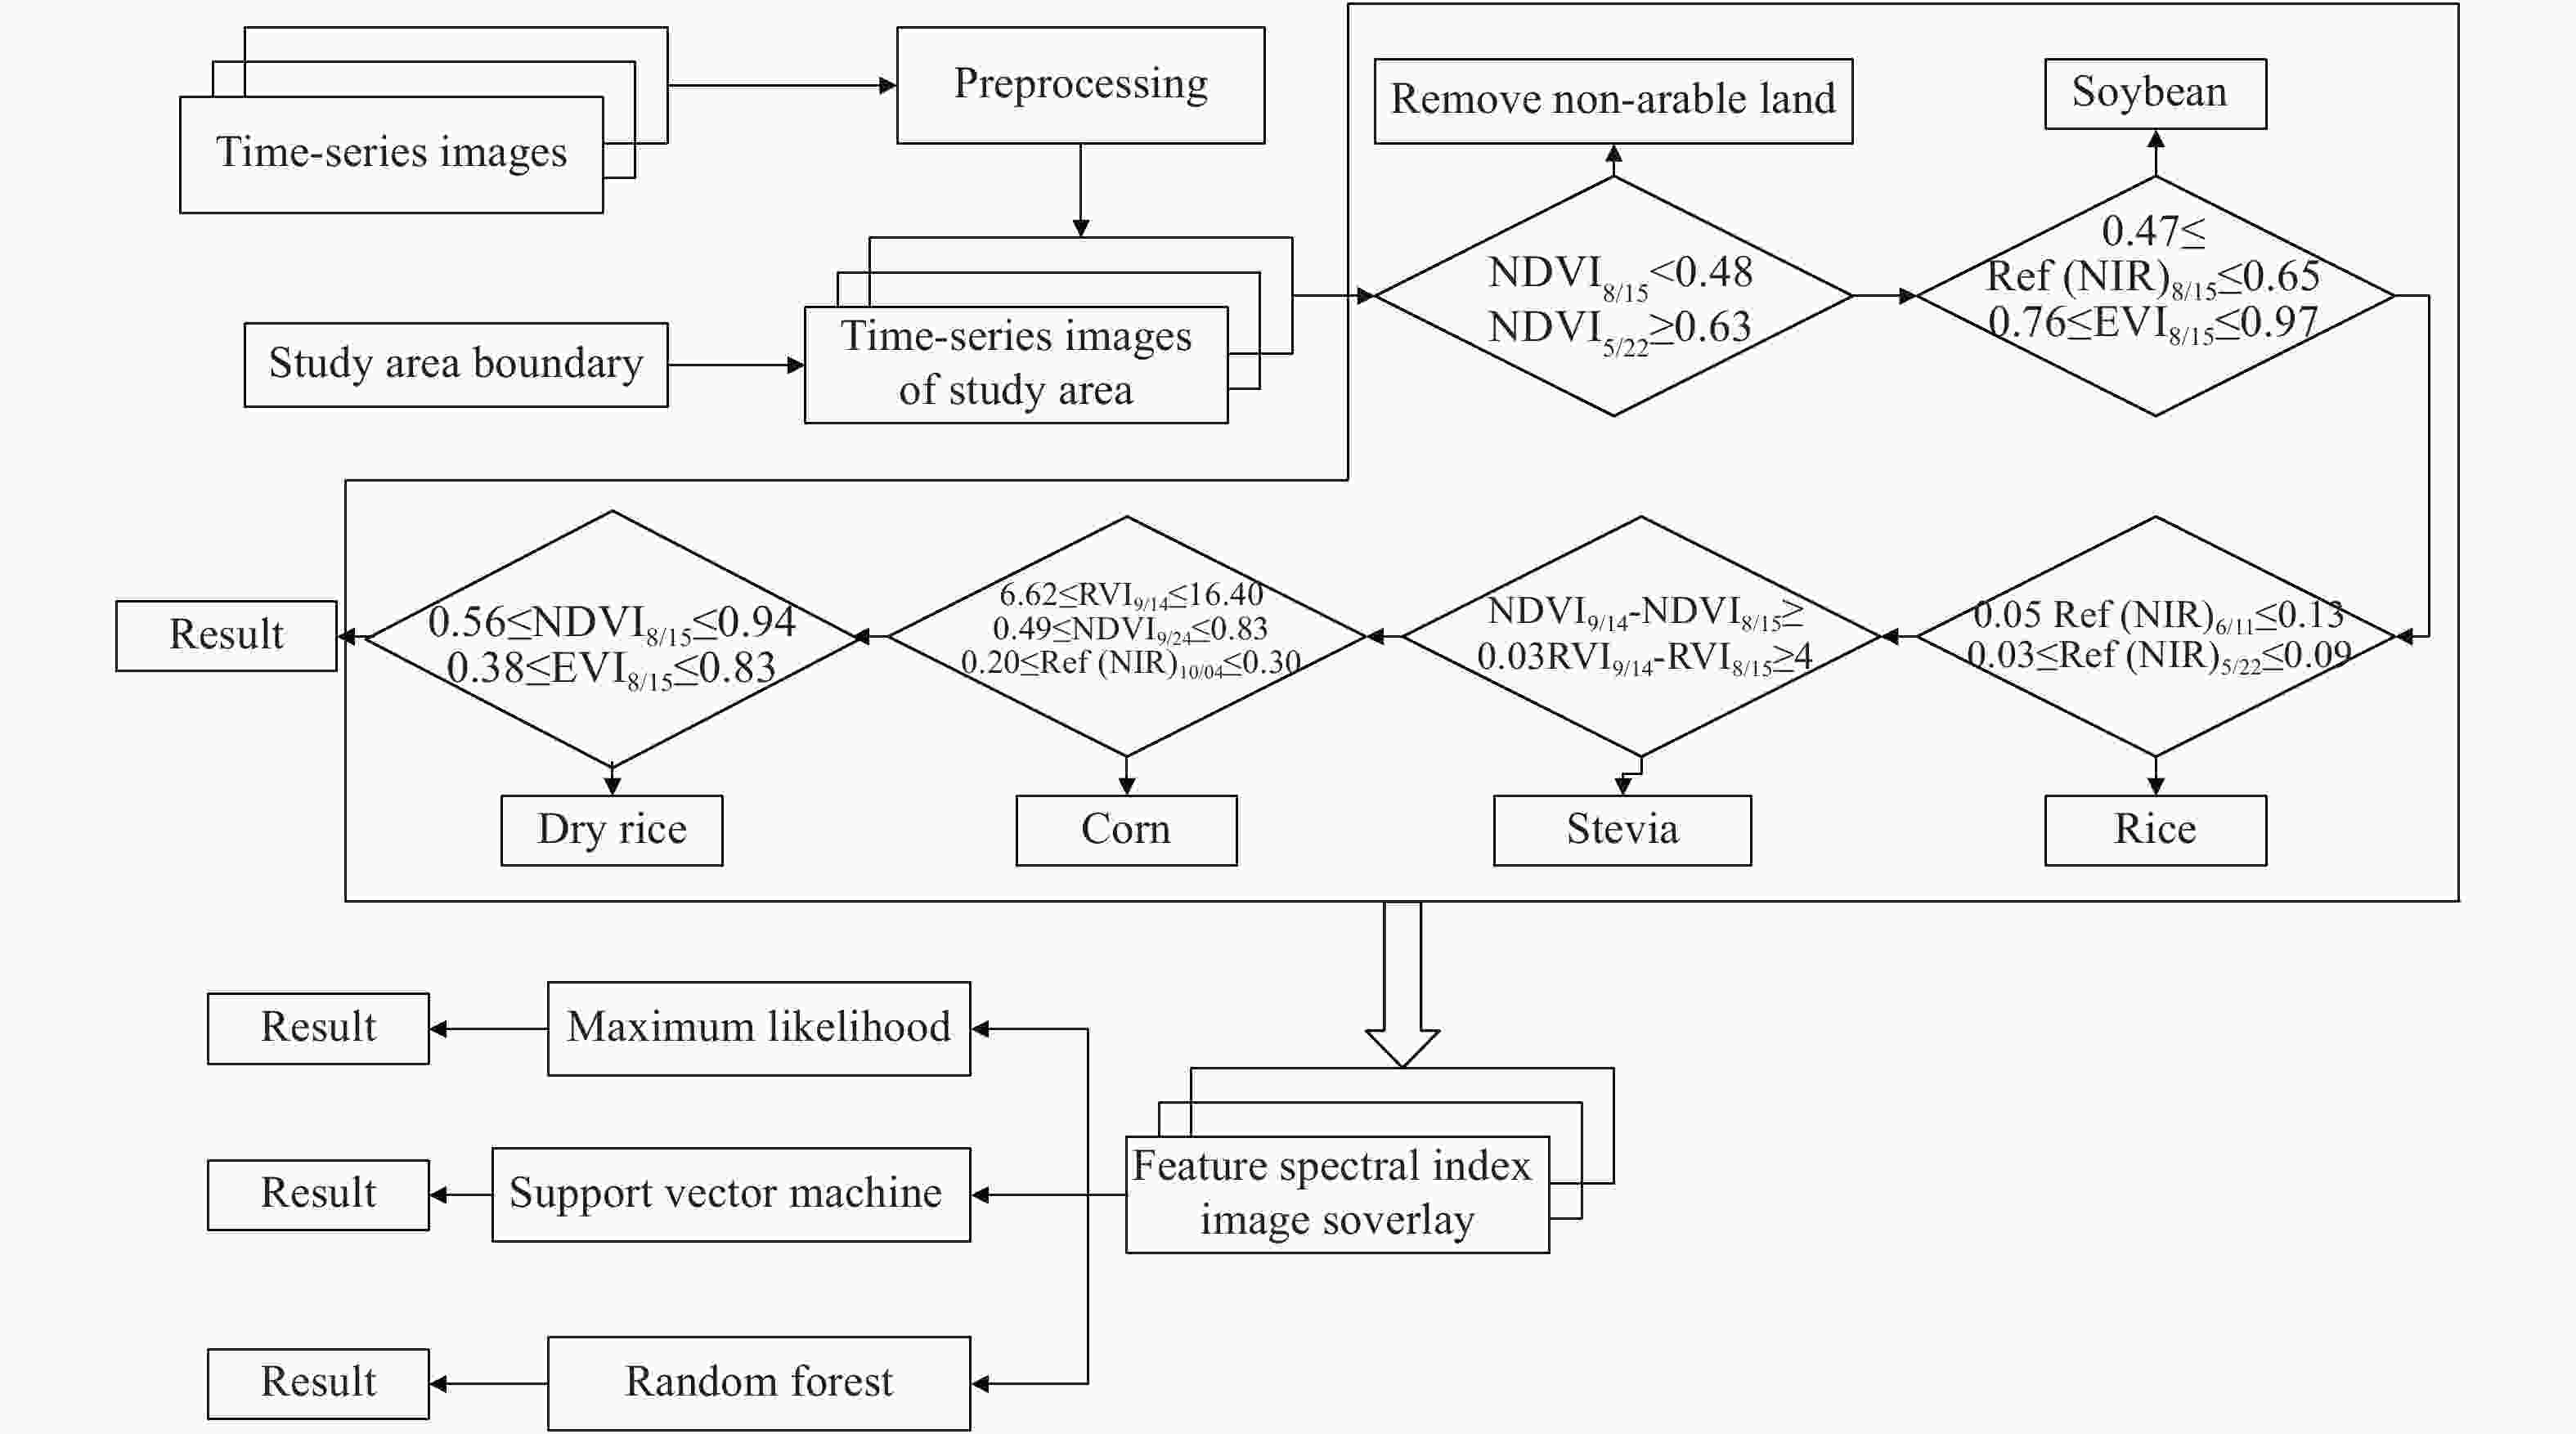
Figure 3. Flow chart of crop classification extraction
通过NDVI8/15<0.48剔除水体、道路和建筑等,利用NDVI5/22≥0.63剔除林地,将这些区域统一划分为非作物区域进行剔除,然后进行主要作物的分类。
大豆在整个生育期内,除了NDVI生长曲线相比较其他作物差异性不明显外,其他光谱指数特征曲线生长趋势明显高于其它作物。大豆的EVI和Ref(NIR)整体趋势相似,与其他作物有一定的区分度,因此选取EVI和Ref (NIR)对大豆地块进行提取。图2(c)、(d)中可以看出大豆的EVI和Ref(NIR)数值在8月15日明显高于甜叶菊、旱稻、水稻和玉米,因此选取Ref (NIR)8/15和EVI8/15用来提取大豆种植区域。大豆Ref (NIR)8/15最大值为0.65,最小值为0.40,根据样本地块统计Ref(NIR)和EVI数值,经反复实验最终设定满足0.47≤Ref (NIR)8/15≤0.65的像元为大豆,0.76≤EVI8/15≤0.97的像元作为补充。
水稻、玉米、旱稻生长趋势基本吻合,尤其是水稻和旱稻的差异性不明显。在6月份前后,水稻刚开始插秧,水稻田块里有水体存在,使水稻的Ref (NIR)数值高于其他地物同时期Ref (NIR)数值,因此选择6月11日的水稻Ref (NIR)提取水稻地块。受6月11日影像质量影响,选取5月22日水稻的Ref (NIR)作为补充。将水稻样本地块在这两个时期的Ref (NIR)统计值,与其他地物统计的Ref (NIR)最值进行比较,反复实验,最终确定满足0.05≤Ref (NIR)6/11≤0.13的像元为水稻,并满足0.03≤Ref (NIR)5/22≤0.09的像元为补充。
从甜叶菊的NDVI和RVI时间序列曲线可以看出,在8月至9月其他作物植被指数缓慢降低时,甜叶菊出现了增长。通过对比不同时期的指数差值,提取甜叶菊种植区域。经过反复试验,最终确定满足NDVI9/14- NDVI8/15≥0.03和RVI9/14-RVI8/15≥4的像元为甜叶菊。在剔除大豆、水稻、甜叶菊后,剩下玉米和旱稻两种作物,两种作物的光谱特征曲线的变化趋势相似,但在9月14日玉米的RVI值大于旱稻,9月24日玉米的NDVI值明显大于旱稻,而在10月4日玉米的Ref (NIR)值小于旱稻,经过反复试验,最终确定满足6.62≤RVI9/14≤16.40和0.49≤ NDVI9/24≤0.83以及0.20≤Ref (NIR)10/04≤0.30的像元为玉米。最后剩下旱稻,选取旱稻关键生育期8月15日的NDVI和EVI指数进行提取,经过反复试验,最终选定满足0.56≤NDVI8/15≤0.94和0.38≤EVI8/15≤0.83的像元为旱稻。决策树分类结果如图4(a)所示。

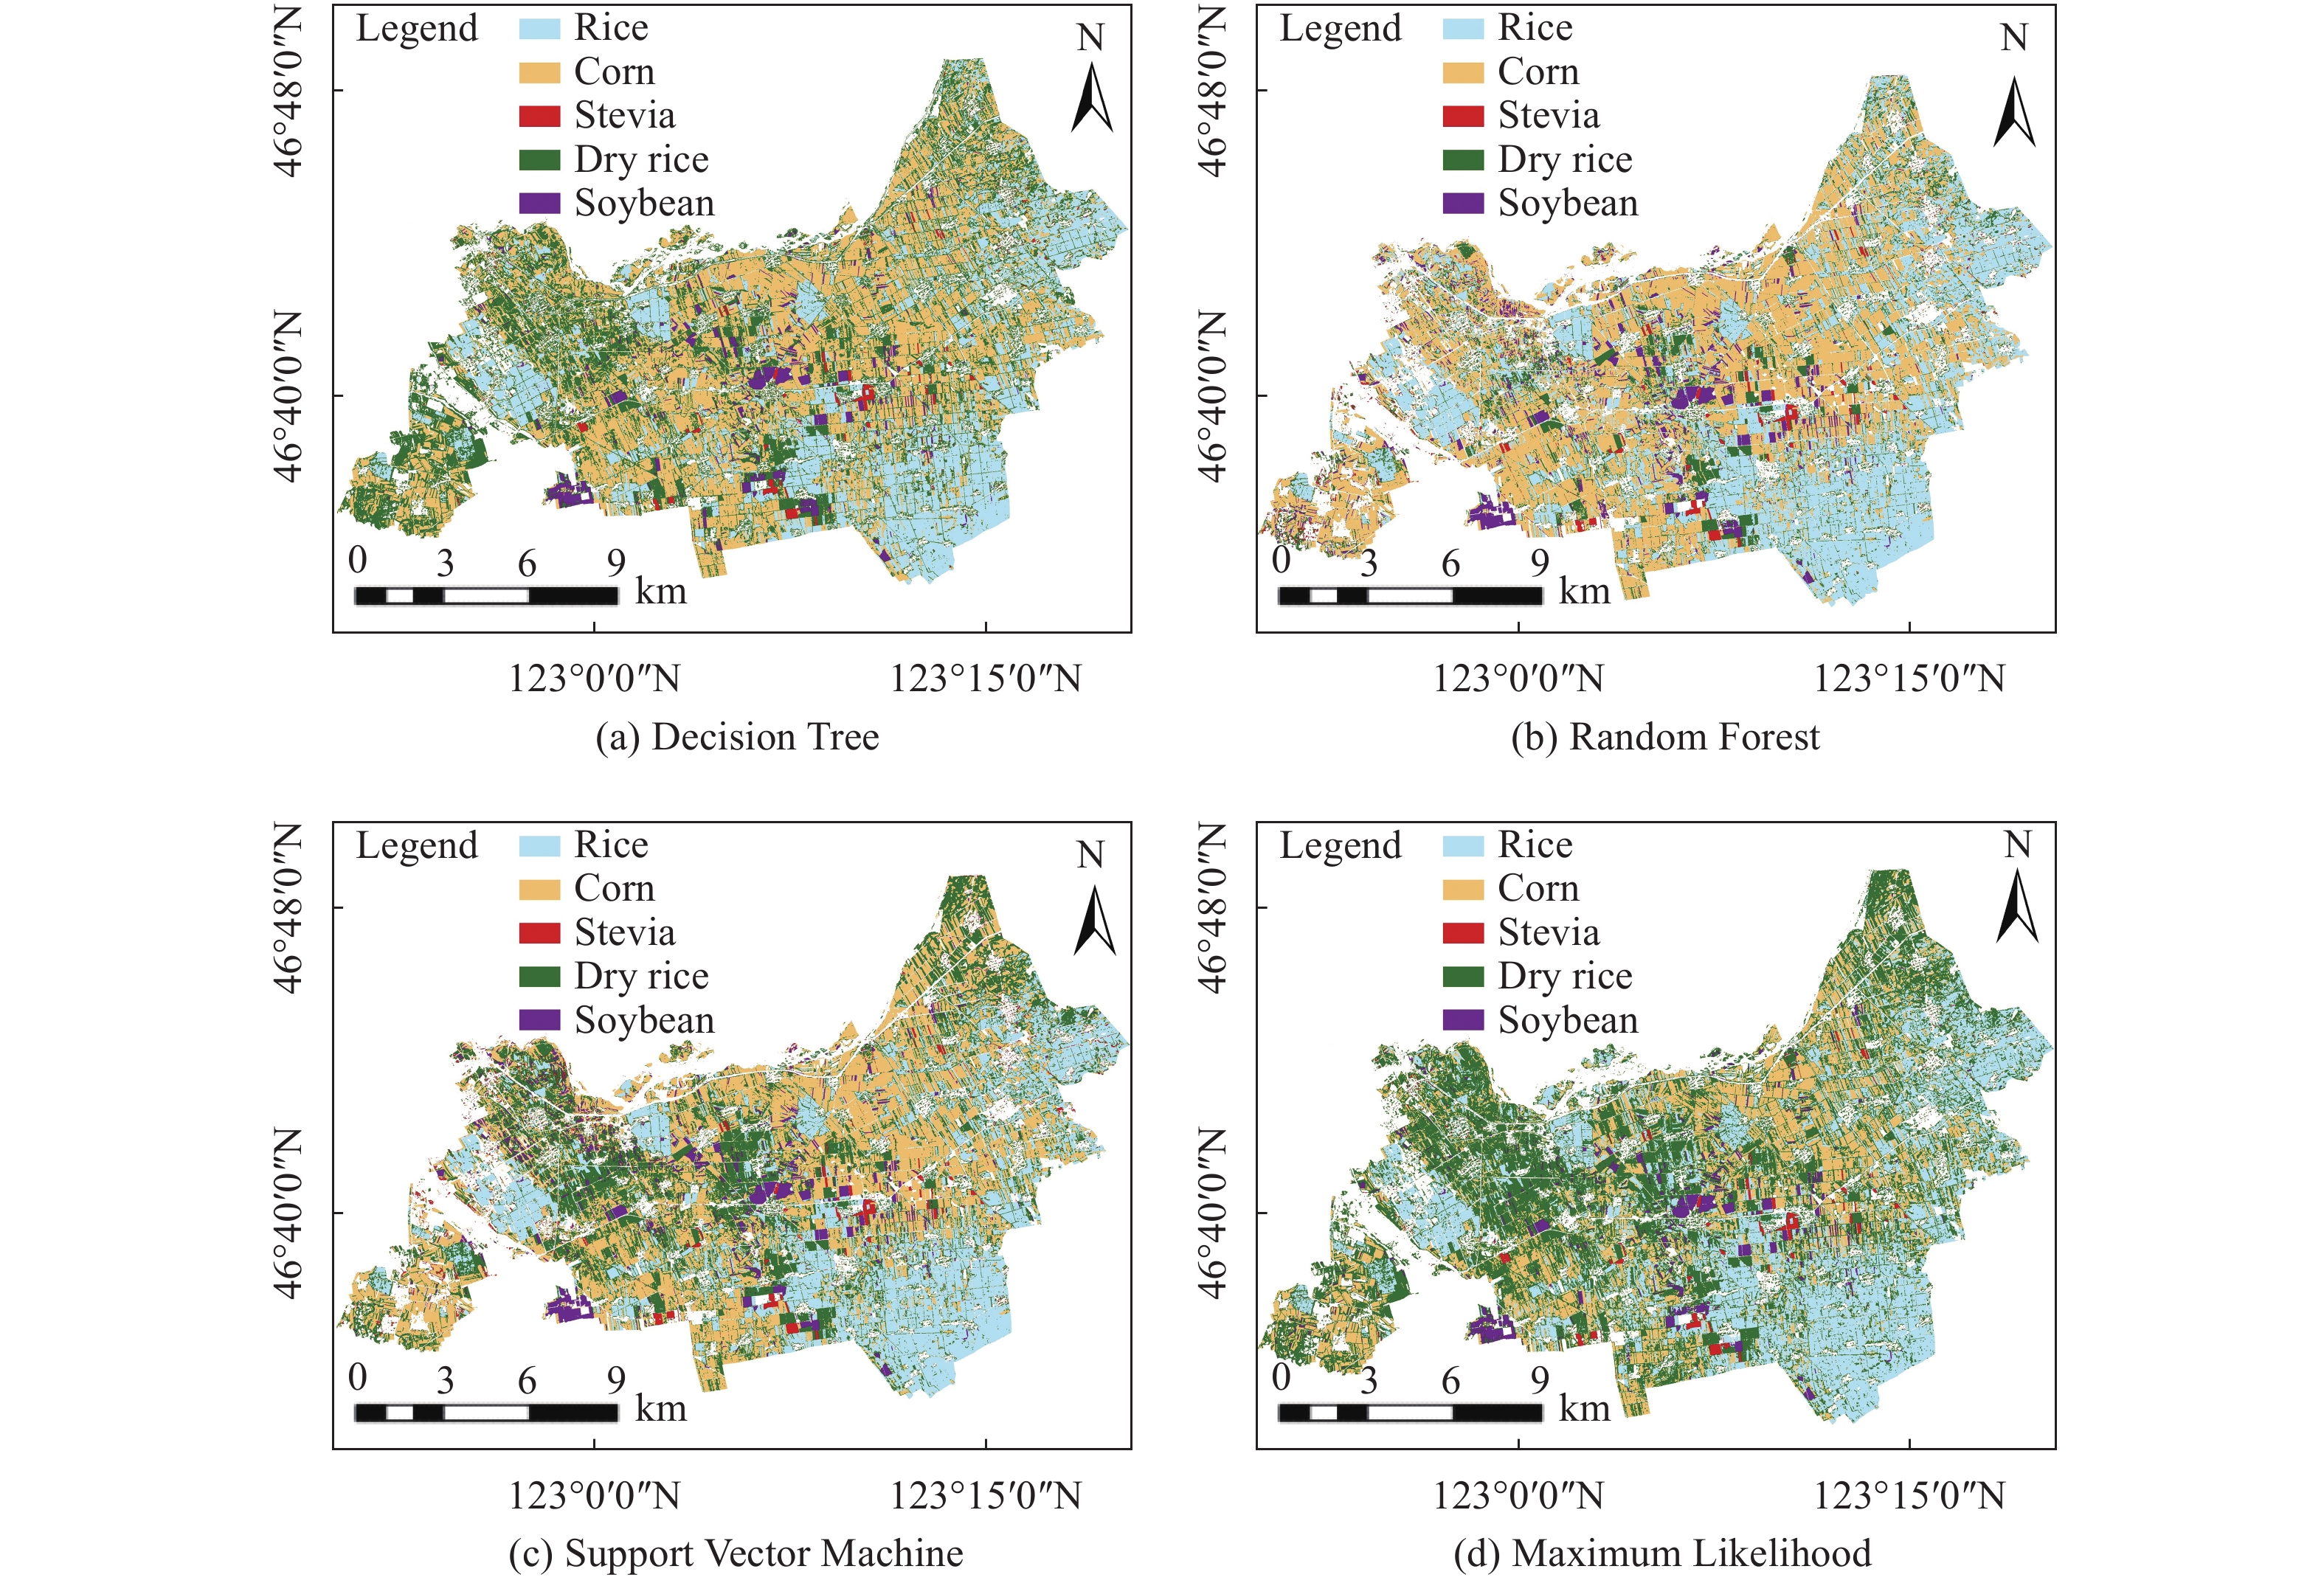
Figure 4. Crop classification results using Decision Tree (a), Random Forest (b), Support Vector Machine (c), Maximum Likelihood (d)
-
选取作物分类提取过程中关键时期的植被指数和近红外光谱影像,其中包括NDVI:5月22日、8月15日、9月14日和9月24日 4个时期影像,Ref(NIR):5月22日、6月11日、8月15日和10月4日 4个时期影像,RVI:8月15日、9月14日 2个时期影像,EVI:8月15日1个时期影像。将上述11个时期影像叠加。通过En MAP-BOX[23]工具,将合成的影像与训练样本集输入到随机森林分类器中进行分类,对于Random Forest分类参数设置,一般保持默认即可,随机森林树的数量设置为100,特征数量默认使用“Square Root”方法,最小节点样本选择1,设置好参数后,直接运行分类器,获得最终分类结果如图4(b)所示。
-
此研究采用随机森林分类模型对研究区主要农作物进行分类识别并对比决策树、支持向量机和最大似然法分类结果。各方法分类结果展示如图4所示。从图4中可以看出,在研究区范围内主要种植玉米和水稻2种作物,且地块较大,较为集中。其中水稻主要分布在园区东南、东北地带,玉米主要分布在研究区中部及西南部。大豆和甜叶菊种植区域主要集中在研究区中部,并且地块较小。旱稻种植区域零星分布,地块较小,与玉米的间种现象比较严重。4种分类方法对水稻、大豆和甜叶菊的分类效果较好,对于玉米旱稻混种区域,随机森林分类效果最好,决策树次之,最大似然法的分类效果最差。
决策树分类效果较好,是因为增加了对不同作物间光谱指数阈值选取,并逐步分层识别提取作物,作物光谱信息被更加深入的挖掘,分类具有针对性,解决单一生育期,不同作物光谱特征差异性不大的问题,而随机森林算法建立多支决策树,并对分类器的结果进行投票,投票次数最多的类别为最终结果,通过增加分类器数量,改善了分类精度。支持向量机和最大似然法都只根据有限的样本信息进行地物分类提取,很难划分细碎地块和间种地块,从而导致它们的错分概率相对较高。
将分类后的结果与验证样本集计算混淆矩阵,评估分类后精度。决策树和随机森林分类模型混淆矩阵结果见表6和表7。
Type Soybean Rice Stevia Corn Dry rice Total User accuracy Soybean 3288 4 0 0 320 3612 91.03% Rice 0 5680 16 33 176 5905 96.19% Stevia 0 0 2039 0 59 2098 97.19% Corn 0 1 0 8451 221 8673 97.44% Dry rice 8 9 147 1055 4820 6039 79.81% Mapping accuracy 99.76% 99.75% 92.60% 88.57% 86.13% Table 6. Confusion matrix result of Decision Tree
Type Soybean Rice Stevia Corn Dry rice Total User accuracy Soybean 3294 0 0 0 393 3687 89.34% Rice 0 5692 19 183 216 6110 93.16% Stevia 0 0 1993 0 8 2001 99.60% Corn 0 0 2 9301 41 9344 99.54% Dry rice 4 2 142 102 4938 5188 95.18% Mapping accuracy 99.88% 99.96% 92.44% 97.03% 88.24% Table 7. Confusion matrix result of Random Forest
4种分类方法总体精度和Kappa系数见表8。结合图4对研究区作物分类识别结果进行分析,随机森林分类总体精度最好为95.8%,Kappa系数为0.944。决策树分类总体精度为92.3%,Kappa系数为0.897。支持向量机分类总体精度为91.6%,Kappa系数为0.890。最大似然法总体分类精度最低为86.5%,Kappa系数为0.823。
Classification method Overall accuracy Kappa coefficient Maximum Likelihood 86.5% 0.823 Support Vector Machine 91.6% 0.890 Decision Tree 92.2% 0.897 Random Forest 95.8% 0.944 Table 8. Overall accuracy estimation and Kappa coefficient of classification based on each method
-
此研究采用时间序列Sentinel-2卫星遥感影像数据集,结合研究区作物物候特点,通过NDVI、EVI以及RVI等植被指数和近红外波段Ref(NIR)的时序变化特征,选取作物关键生育期差异明显的光谱指数特征影像集,采用随机森林分类方法成功提取研究区不同作物的种植区域。相比其他传统分类方法,提高了分类精度,简化了分类流程。采用随机森林方法的作物总体分类精度为95.8%,Kappa系数达到0.944。通过该方法可以实现对扎赉特旗现代农业示范园区作物的精确提取。
此研究还存在一些不足需要改进,尽管提出的方法在所选研究区域有较高的分类精度,其普适性还需要开展更加深入的研究。另外,随机森林算法中树的分支数带来的影响并没有考虑进去,下一步将对不同分支数对分类精度开展更加深入的分析和探讨。
Crop classification of modern agricultural park based on time-series Sentinel-2 images
doi: 10.3788/IRLA20200318
- Received Date: 2020-12-07
- Rev Recd Date: 2021-01-19
- Publish Date: 2021-05-21
-
Key words:
- random forest /
- Ref (NIR) /
- time-series /
- Sentinel-2 /
- crop classification
Abstract: Quickly and accurately grasping the spatial distribution of crops, estimating the area and scope of different crops were of great significance for the country to formulate macroscopic agricultural policies and guide farmers in agricultural production. To explore an efficient and accurate crop classification method, this paper took the agricultural area of Jalaid Banner of Hinggan League in Inner Mongolia Autonomous Region of China as the study area and extracted main crop classification based on the Sentinel-2 satellite remote sensing image data from May to October 2019. By analyzing the time-series curves of the four characteristic indexes of NDVI, RVI, EVI and Ref (NIR) in the study area, a total of four classification methods including Random Forest (RF), Decision Tree (DT), Support Vector Machine (SVM), and Maximum Likelihood (ML) were used to classify various crops in the study area. The RF results were compared with the classification results of DT, SVM and ML, and the spatial distribution of major crops such as rice, corn, stevia, dry rice and soybean were successfully extracted and identified. The results showed that RF had the highest overall classification accuracy of 95.8% with a Kappa coefficient of 0.944, DT, SVM and ML had classification accuracy of 92.2%, 91.6% and 86.5%, respectively. The above results indicate that the multitemporal Sentinel-2 remote sensing images can be extracted by spectral index time-varying features, and the crop classification using the random forest algorithm can obtain high accuracy results, which provides effective technical support for the fine guidance of large-scale agricultural production in the park.


 DownLoad: