


-
低空风切变是指发生在600 m高度以下的平均风矢量在空间两点之间的差值,具有时空尺度小、突发性强的特点,是国际航空和气象界公认的飞机起飞和着陆阶段的无形杀手[1]。低空风切变的发生有时是单纯大气运动造成的,有时是地理环境因素产生,或是上述两者综合所致,但气象是主要诱因[2]。根据以往民航飞行事故统计,与低空风切变有关的飞行事故多发生在低空300 m高度以下的起飞和着陆过程中,尤其是着陆阶段[3-4]。
首都机场位于北京市东北郊,地域开阔平坦,据多年地面自动站数据统计,机场冬春季易出现大风天气且以西北风向大风为主[5],通过以往多次风切变天气个例分析发现,风切变的发生几乎都与大范围冷空气东移南下时在近地面形成西北大风有关[6-7]。除大尺度天气影响外,机场及周边下垫面的影响也是机场低空风切变的原因之一。首都机场共3条南北向跑道,自西向东跑道编号依次为18R-36L、18L-36R和19-01,经预报员长期观察发现,西北大风天气时利用18R-36L跑道进行起降收到的航空器风切变报告比其他两条跑道多,并初步认为这种现象可能与18R跑道距离周围建筑物和树木相距太近,冠层对跑道区域低空风产生了消减效应所致[8]。
按民航相关规定机场配备的测风设备应包含地表风速计、天气雷达和风廓线仪等[9],但在日常业务和研究中,首都机场低空风切变的观测和分析多基于跑道自观、天气图数据或数值模拟方法,但这些方式无法获取跑道及其外围区域真实的风切变观测数据,因此无法针对本场的地理和气候特点,就风切变造成的影响进行客观评估。近年来,随着各地机场飞行密度的激增,机场低空风切变探测技术的研究越来越得以重视,相较于传统天气雷达或测风设备,多普勒激光测风雷达具有高探测精度,不受地物杂波干扰,不影响正常导航通信的特点,成为了晴空天气条件下机场探测低空风切变的有效工具和手段之一[10]。在过去的研究中,测风激光雷达进行机场风切变观测多采用激光束与下滑道交叉扫描的探测方式,允许激光波束与下滑道存在一定范围夹角,并且下滑道风廓线数据的重构是假定在一定空间范围内风向具有一致性为前提展开的[11-12]。由于雷达不能安装于跑道中心附近,这种测量方式将导致除下滑道与激光束的交点外,其余大部分数据点均不在下滑道所在的水平和高度位置上,另外激光束与下滑道之间的夹角会导致真实风速被放大或低估,造成风廓线上测风数据的偏差。
-
在首都机场进行观测的两台测风激光雷达均为WindPrint S40003D型号,是一种小型化、全自动的相干多普勒测风激光雷达,其采用人眼安全1 550 nm激光波段,利用大气气溶胶后向散射特征实现对大气径向风速的测量,具有不影响目标运动,信号稳定,高精度、非接触等诸多优点[13-14]。雷达的径向最大量程为4~6 km,距离分辨率最小为15 m,风速测量精度0.1 m/s。根据机场用户的观测需求,冬春季节采用平面位置显示(Plan Position Indicator, PPI)和距离高度显示(Range Heigth Indicator,RHI)模式进行交替扫描,监测跑道及起降区域低空风场变化;夏季则使用风廓线(Dopplar Beam Swing,DBS)扫描方式,监测跑道周围区域大气垂直对流运动。两部测风激光雷达分别放置于36L跑道及01跑道入口附近,与跑道入口的具体相对位置如图1所示,为便于区分文中用编号01、02分别代替。01雷达放置在36L跑道入口南约315 m,与跑道延长线的垂直距离为135 m;02雷达放置在01跑道入口南约329 m,与跑道延长线的垂直距离为145 m。文中仅采用激光雷达RHI扫描模式数据进行风切变的分析研究。考虑到雷达与跑道相距不远,因此在平坦地形条件下可近似认为RHI观测区域与跑道区域风场具有相互代表性。

Figure 1. Schematic diagram of installation position of two lidar
RHI扫描模式是指雷达伺服固定方位角,激光波束以俯仰角变换的扫描方式获取径向风速数据,2019年1~4月两部测风激光雷达共有82天的RHI扫描模式同期数据。两条跑道的磁方位相同,真方位差别不大,因此两部雷达RHI扫描模式的方位角设置均与跑道方向平行,为353°和173°,俯仰角设置为1°间隔,0°~45°依次循环扫描。雷达完成一个方位角RHI扫描的时间约45 s,记录的径向数据条数为45条。将同一部测风激光雷达连续执行的353°和173°两个方位角的RHI扫描数据面视为同一组分析数据,每30 min内雷达共采集到4组RHI模式数据。经统计1~4月期间两部雷达分别有2535组和2532组RHI观测数据。
-
通过信噪比阈值对激光雷达数据进行质量控制。用PS(N)表示在一定时间内收集到信号光电子数,PN(N)表示同一时间内收集到的所有噪声光电子数,信噪比可以表示为:
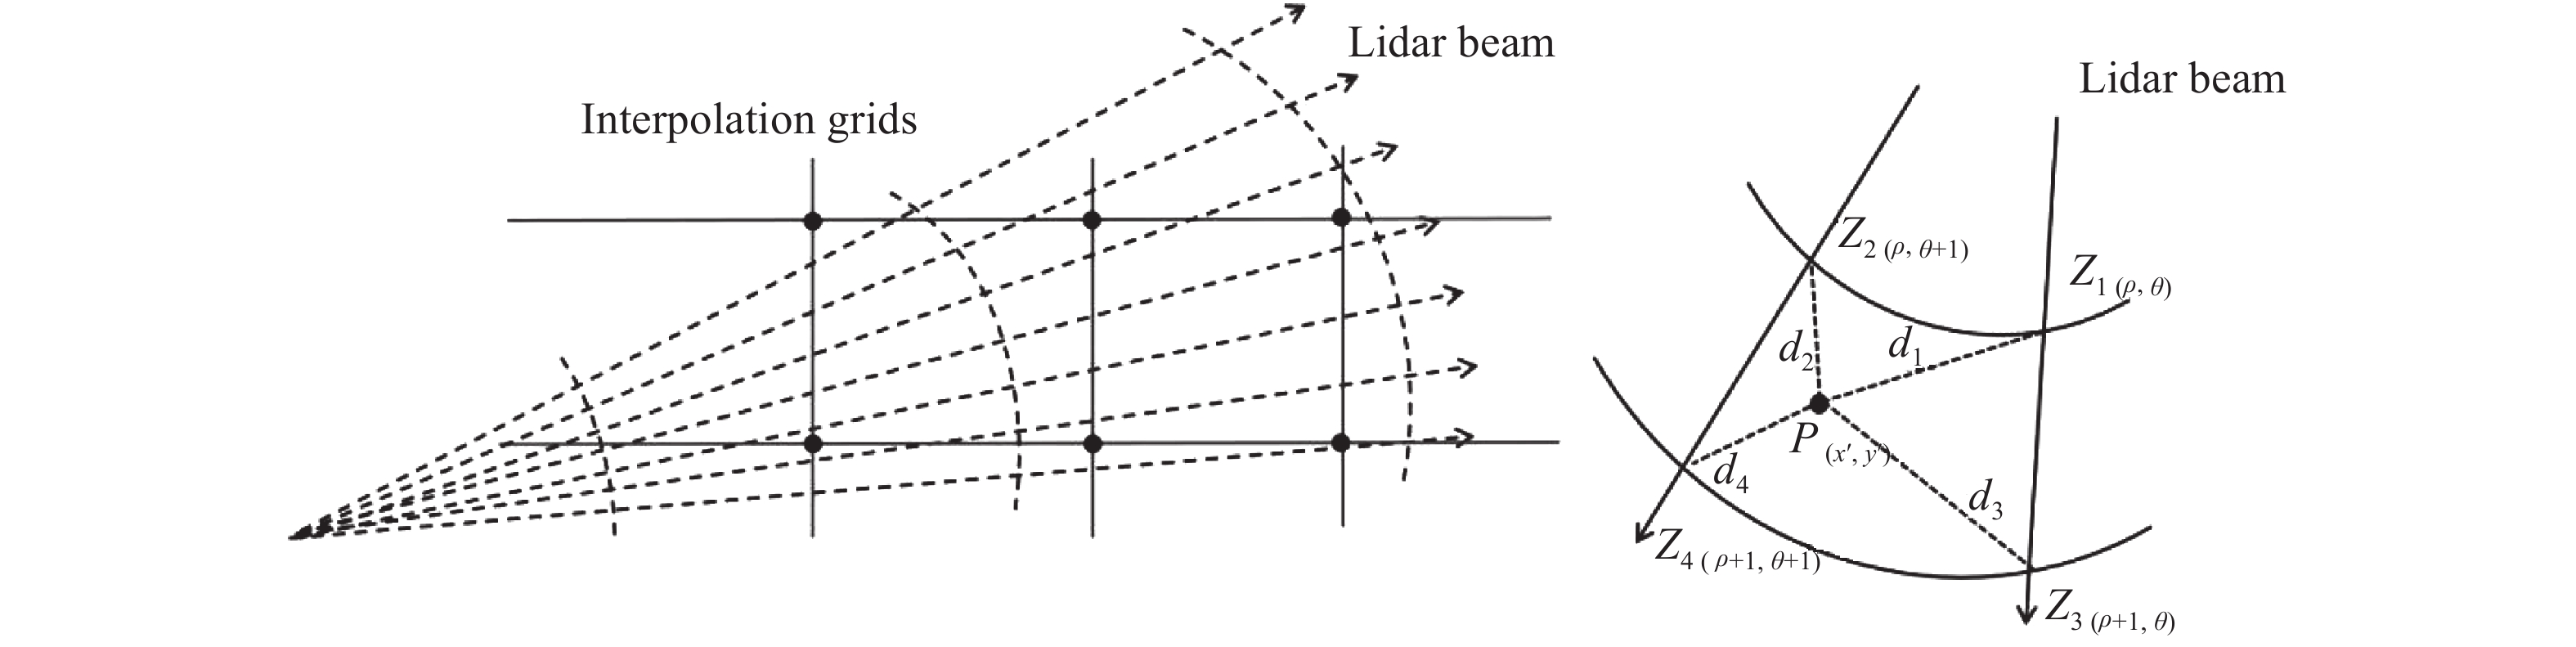
通过对该型号设备大量历史观测数据统计得知,当雷达信噪比值低于9 dB时,对应的风速数据存在较多虚假值,为保证雷达测风数据的准确性,在进行数据统计前去除信噪比低于9 dB对应的测风数据。以每部测风激光雷达安装位置为坐标原点,将质量控制后,径向分辨率为30 m、俯仰角间隔为1°的一组极坐标激光雷达数据通过反距离加权插值法,转化为20 m×20 m距离分辨率的笛卡尔坐标数据。如图2所示,笛卡尔坐标系中待插值的数据点定会落在激光雷达4个数据点之间,若分别用ρ和θ表示极坐标数据对应的级径和级角坐标,那么测风激光雷达数据点在笛卡尔坐标系内对应的x、y轴坐标如公式(2)所示,其中l为激光雷达距离分辨率30 m。公式(3)为反权重插值公式,假设笛卡尔坐标上点P(x’,y’)落在极坐标系中的位置如图所示,Z1~Z4为P点周围临近4个不为缺测值的极坐标数据点,d1~d4分别为Z1~Z4到P点的距离,利用公式(3)可计算出P点在笛卡尔坐标中的风速值。

Figure 2. Schematic diagram of coordinate transform
-
提取首都机场2019年1~4月半小时METAR报文中记录的平均风速风向信息,将平均风速大于等于5 m/s的情况,按5~6 m/s、6~8 m/s、8~10 m/s和10~30 m/s 4个范围划分,再将每个风速范围,按风向落在150°~180°、180°~210°、210°~240°、240°~270°、270°~300°、300°~330°和330°~360°7个不同区间来划分,总共28个统计区间。表1为按上述条件统计的各区间有效数据情况,白色和灰色分别表示该区间有或无有效的测风数据,去除无数据的区间后剩余17个统计区间。首都机场1~4月偏南风风向时(150°~270°)平均风速大多集中在6 m/s以下,而偏北风风向时各风速段均有出现,风向大于330°时,环境平均风速均大于6 m/s,可见冬春季节机场南风弱北风强,大风天气多发生在偏北风条件下。
Wind speed/m·s−1 Wind direction range/(°) 150-180 180-210 210-240 240-270 270-300 300-330 330-360 5-6 6-8 8-10 10-30 Table 1. Division of wind speed and direction range based on METAR report
将插值之后的测风激光雷达数据按观测时间落在METAR报文发报前后15 min范围内为原则进行时间上的匹配,并分别归类到各个区间进行统计。研究和应用中认为遥感测风设备如测风激光雷达、微波风廓线雷达在相对平坦的地形条件下进行探测都是以假定同一高度风场均匀性为前提[15-16]。首都机场的冬春季大风多是在大尺度冷空气系统过境影响下发生,局地风湍流具有随机、瞬时和小尺度的特征,经大量的平均数据统计这些随机湍流会被中和掉,相同天气背景条件下由非大气因素形成的局部风场偏差会被显现出来。基于上述划分区间,激光测风雷达测量区域在不同高度上的平均风速偏差通过以下方法求取:
(1)对于每一组插值后的RHI数据,以网格长度20 m为高度递进,同一高度的径向风速为总样本,按以下公式求每个高度单点风速与该高度平均风速的偏差:
式中:
${x_i}$ 为同一高度单点的径向风速值;n为同一高度的数据样本总数。(2)求测量期间每个统计区间内各高度的风速偏差平均值。
-
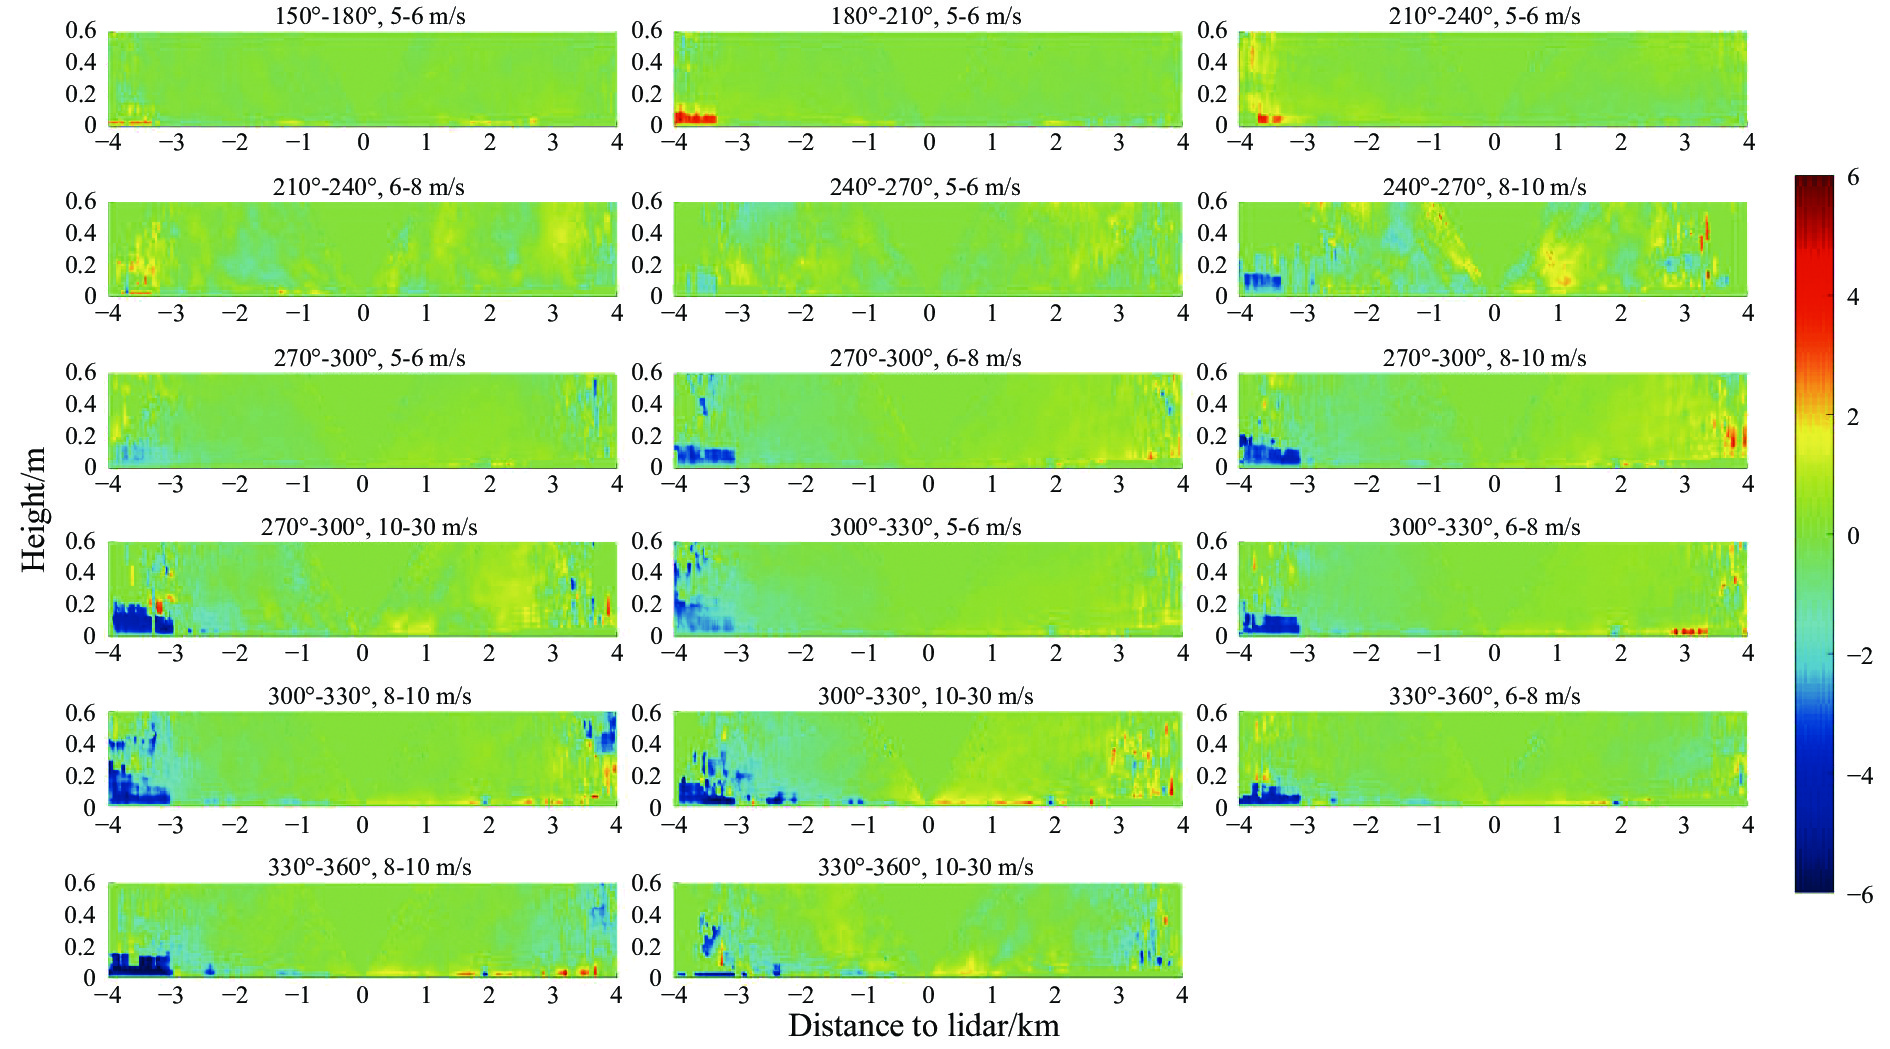
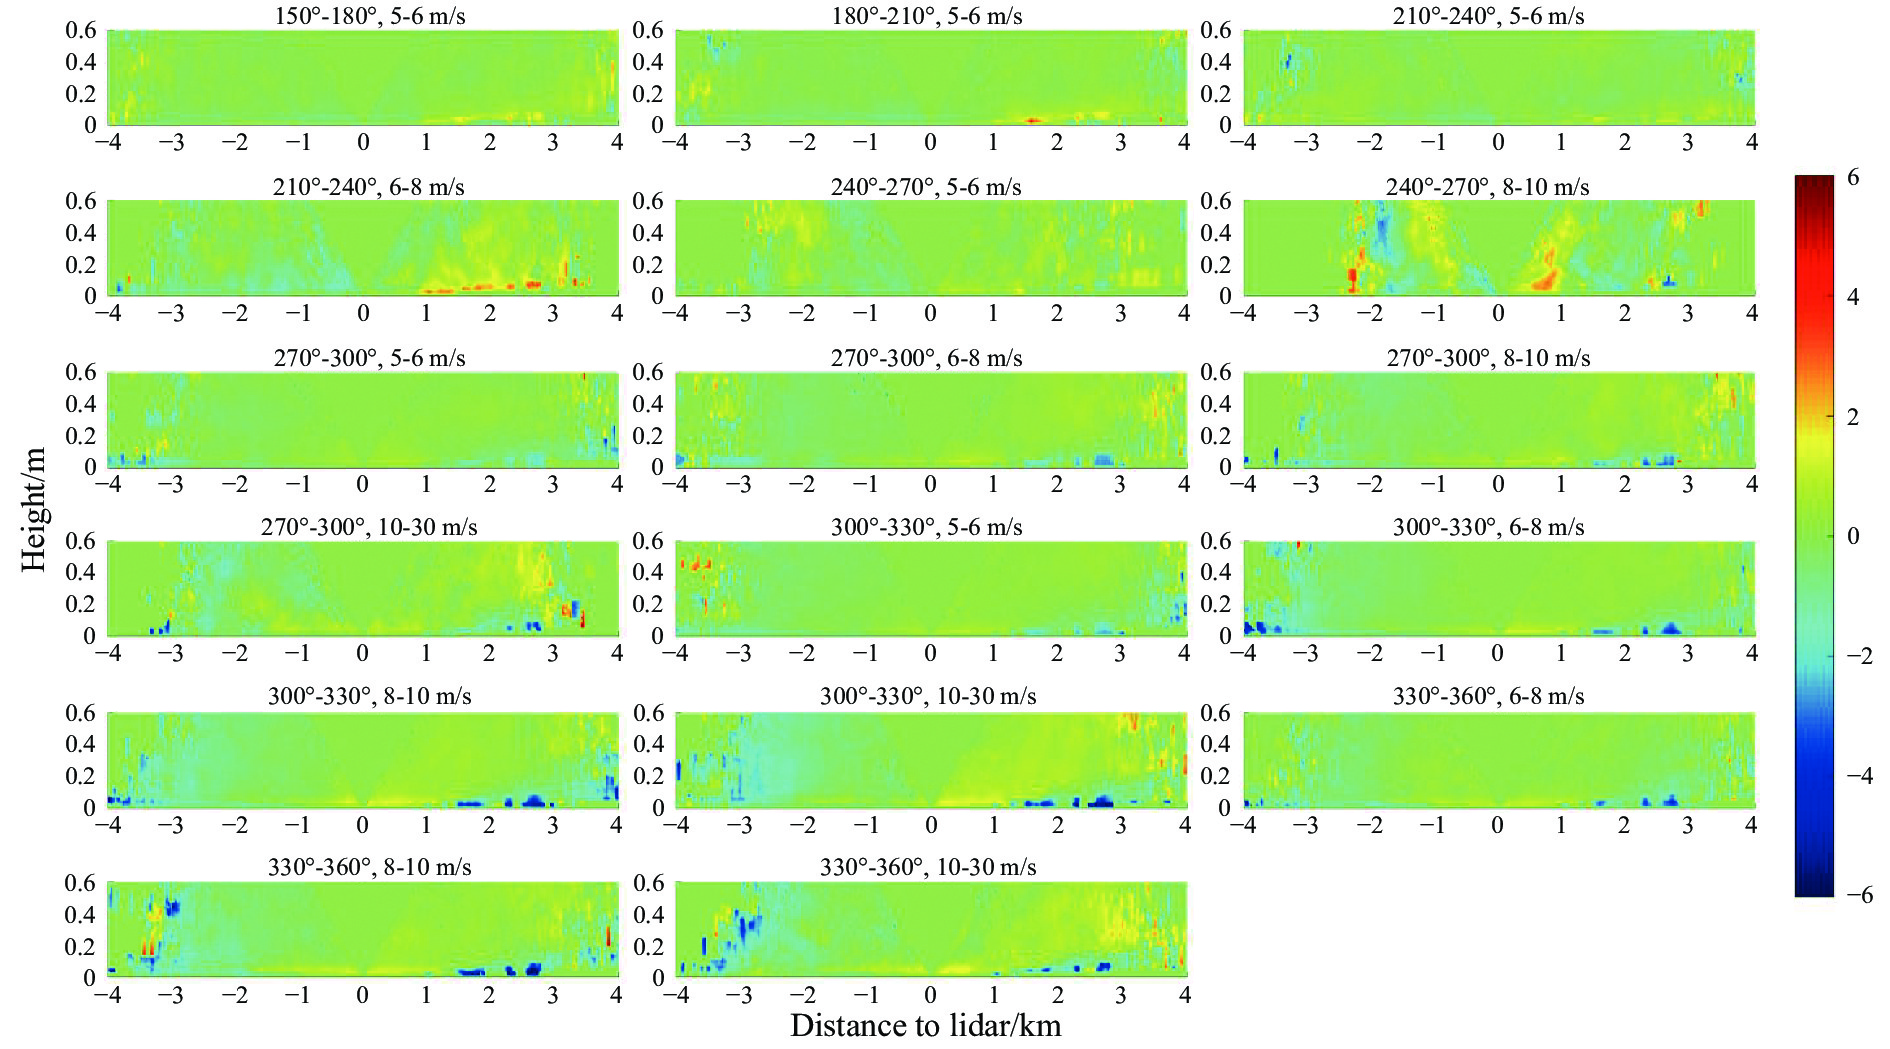
图3和图4分别为01和02测风激光雷达在17个统计区间的径向风平均偏差图。横坐标为沿跑道平行方向与测风激光雷达位置的相对距离,向北为负,向南为正;纵坐标为垂直高度,阴影色标表示风速的偏差值,单位为m/s。如图可见在150°~240°风向时,首都机场18R-36L跑道上空区域风速总体表现为偏大,19-01跑道该区域风速变化则并不显著。在270°~360°西北风条件下,两条跑道低空区域都存在不同程度风速偏小的现象,并且在300°~330°风向区间负偏差值达到最小。风速偏小的区域主要集中在低空400 m高度以下,跑道北入口内1 km范围,随着西北风速增大,该区域风速偏小的现象就越明显。对比可见,西北风条件下18R-36L跑道风速偏小的现象比19-01跑道要明显得多,在平均风达到10 m/s以上时,36L跑道入口内风速负偏差值可达到−4~−6 m/s,而19跑道入口风速负偏差大多为−2 m/s左右。

Figure 3. Radial wind speed deviation of lidar 01 in all different ranges

Figure 4. Radial wind speed deviation of lidar 02 in all different ranges
两条跑道南向延长线低空区域的风速也出现了明显不同的偏差变化趋势,表现为18R-36L跑道南向延长线低空100 m以下风速为正偏差,而19-01跑道该区域为负偏差。这可能是由于西跑道南向延长线区域是一片宽阔空地,空气在此处聚流加速;而东跑道西侧为3号航站楼,在西北风情况下跑道周边区域由于建筑物尾流效应的影响导致风速减弱。
通过半小时发布的民航气象报文,对首都机场三条跑道南接地带区域风速按区间进行分类统计。具体为将36L跑道风速按17个区间划分,匹配其余两条跑道在相同时刻,且风向区间相同的数据,求取三条跑道接地带在各区间的风速平均值。统计结果显示(图5),相比其余两条跑道,在270°~360°风向区间范围36L跑道风速存在明显偏小的现象,尤其在270°~300°风向区间,36L跑道与01号跑道相比差异最大。
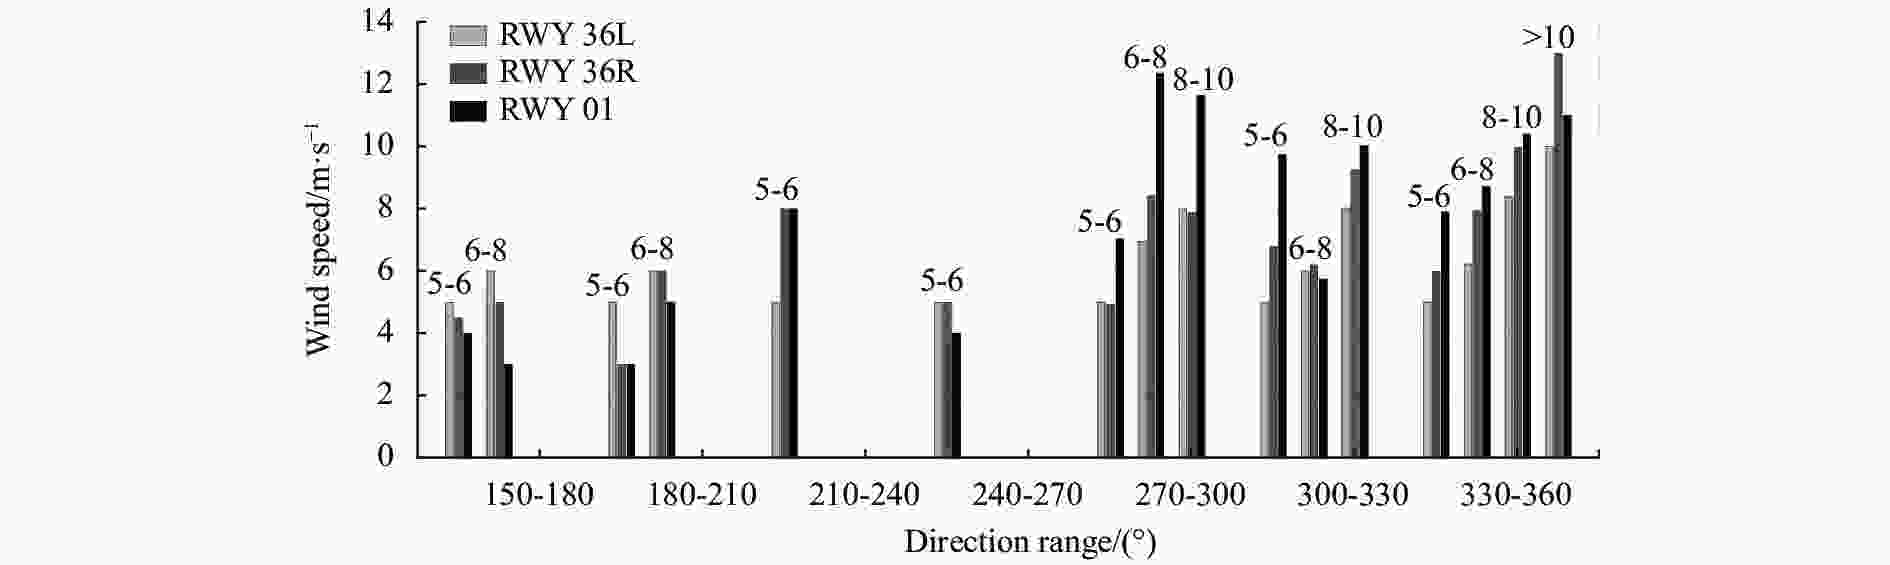
Figure 5. Statistics of average wind speed on south touch-down zone of three runways in Beijing Capital International Airport
-
下滑道是指飞机在进行着陆时相对地面的航迹[17]。航空器以恒定空速进行五边进近时最优的下滑道角度是3°,在西北风条件下首都机场36L和01跑道端将用于降落,最优下滑道接地点位于跑道入口内约450 m处,如图6所示。通过分别查找测风激光雷达173°方位角的RHI数据与下滑道空间上匹配的数据点,构建下滑道顶风廓线,并判断每条顶风廓线上是否存在风切变。
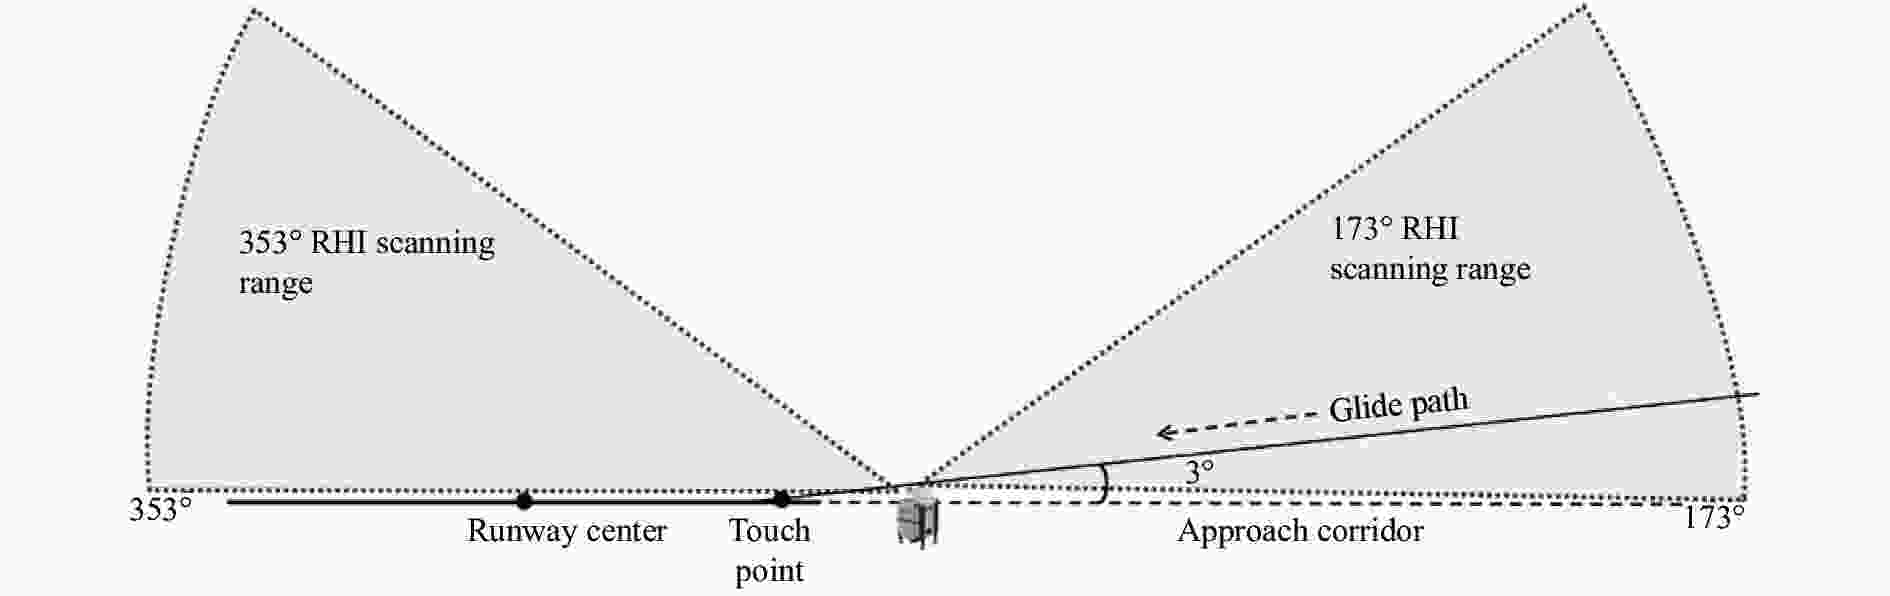
Figure 6. Schematic diagram of the relative position of glide path to lidar RHI scanning range
在以往研究中判断顶风廓线上是否存在风切变采用的是斜坡道检测的方法,为防止局部风速突变点对风切变判别的影响,检测前一般先对数据进行平滑处理,假定原始风廓线数据为
$U$ ,经三点滑动平均处理后变为:式中:
$UI$ 为经过平滑后的风速数据;k为采样数据点。斜坡检测的方法是在平滑公式的基础上,利用差值公式判断两个采样点间的风速变化来确定风切变位置,但由于此方法检测样本间隔较大,且双斜坡检测的方法会跨越了两个风速的峰值区间,因此可能会造成有效数据丢失[12],从而低估风切变的实际强度,因此采用逐点滑动检测的方法识别风切变可能更有效。图7为下滑道上的顶风廓线示意图,横坐标表示到接地点的距离,左侧纵坐标为风速值,右侧纵坐标为下滑道高度,黑色粗斜线为3°下滑道,黑色粗虚线为顶风廓线。以风廓线上距离接地点最远处的风速点为检测起点,逐点滑动检测方法如下公式所示:
风廓线上两点间风速差用UIW表示,以国际民航组织规定的风切变阈值15 kt(约7.7 m/s)作为风切变判断阈值[18],
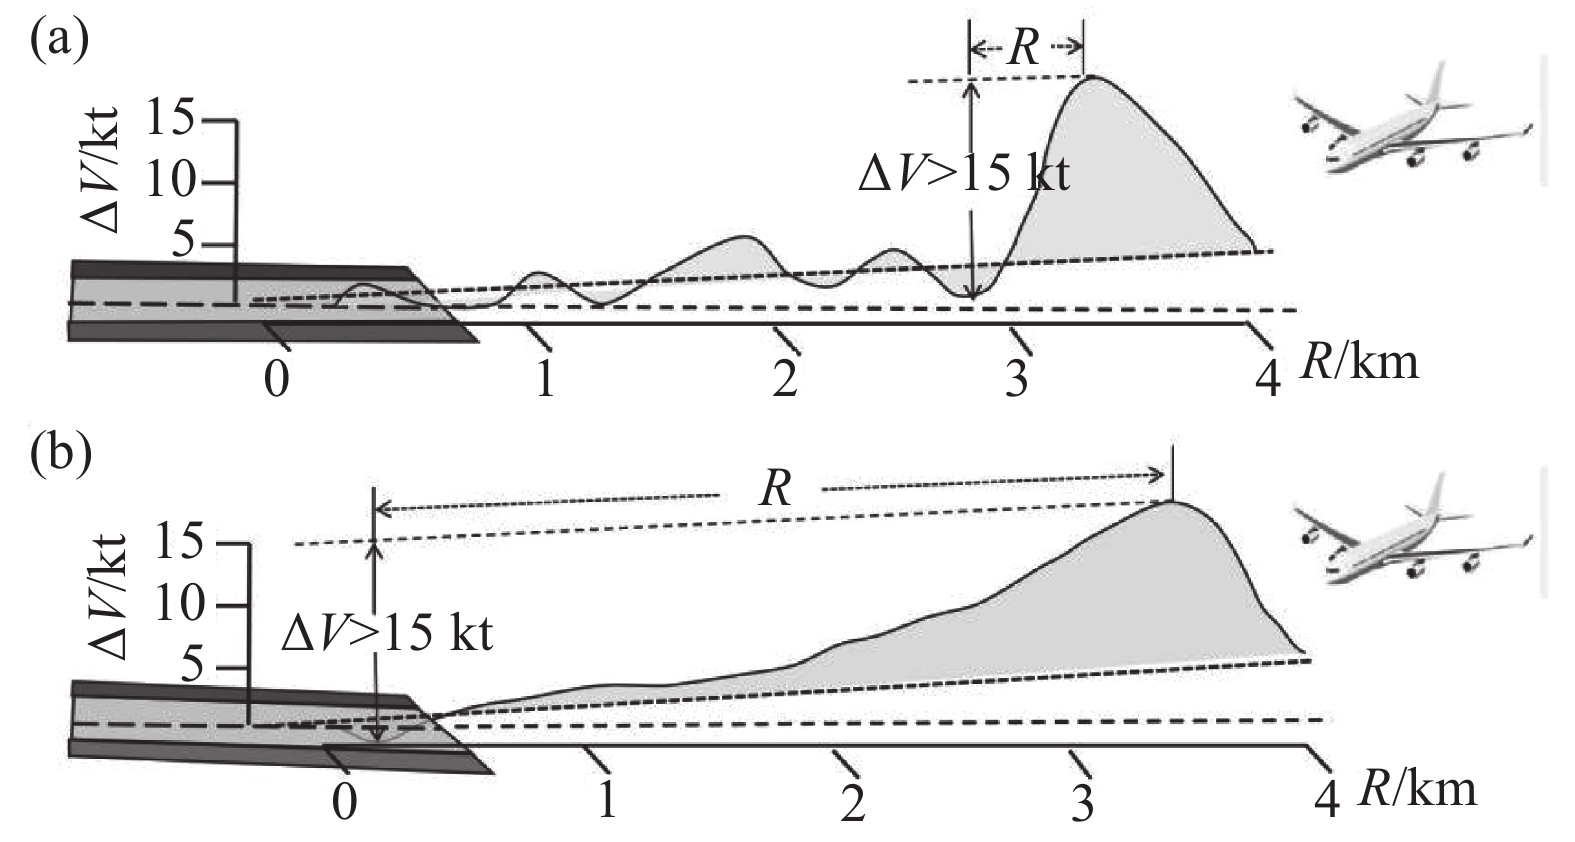
$k$ 为采样点,$d$ 为采样间隔点,$L$ 为廓线上的点到接地点的距离,$R$ 为两点间距离差。在香港机场以往统计研究中发现,$R$ 短于400 m的风切变历时太短(图8(a)),而$R$ 长于4000 m的风切变强度太弱(图8(b)),这些风切变往往不被飞行员觉察[19-20],因此统计中都不予以考虑。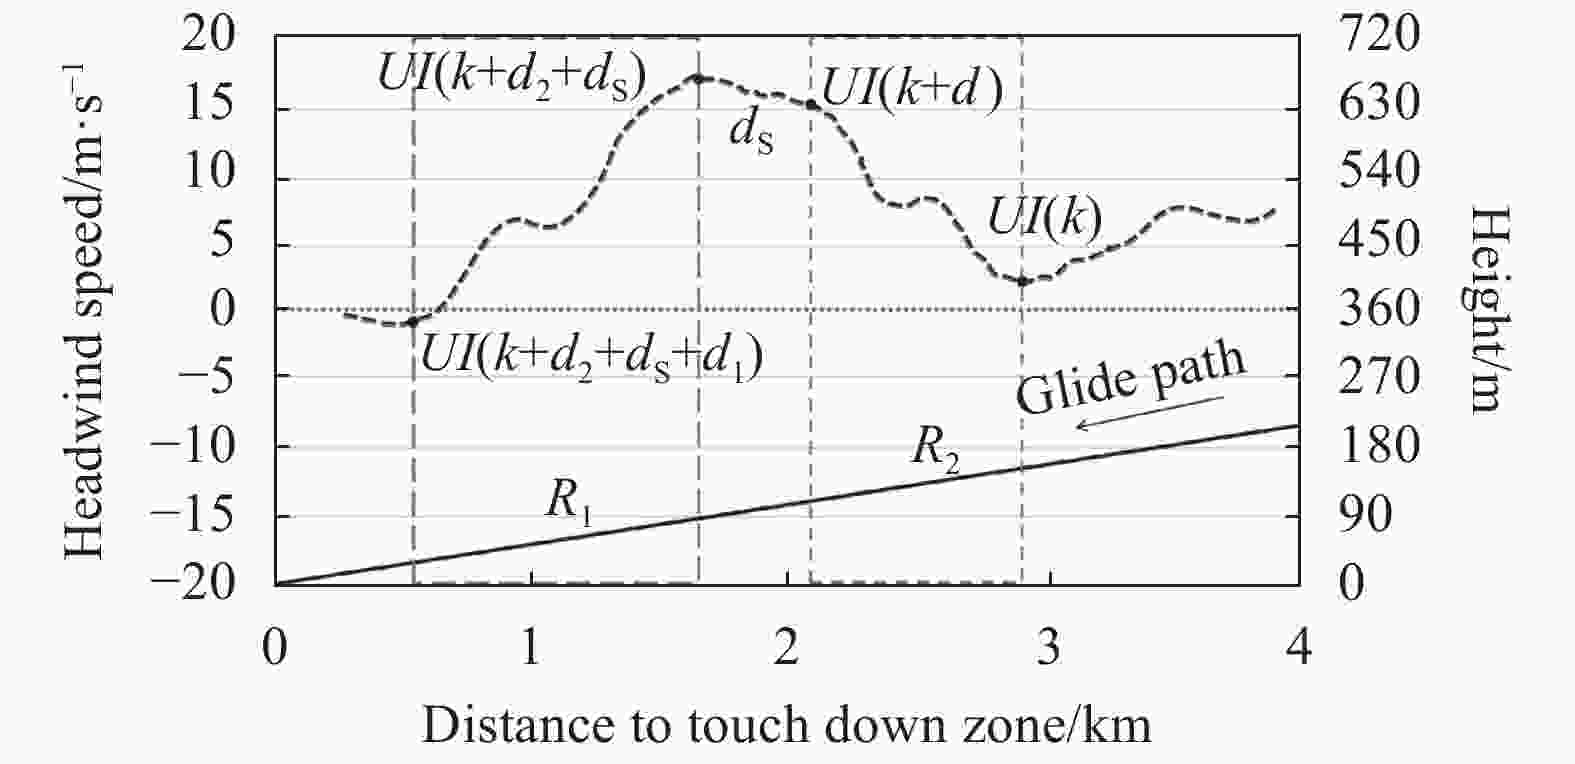
Figure 7. Schematic diagram of headwind profile on glide path

Figure 8. Schematic diagram of relationship between the distance of two points on the wind profile and the change of wind speed
利用Woodfield和Woods提出的风切变强度因子公式计算每次风切变的强度因子
$I$ [21],来表征顶风廓线上达到风切变告警阈值的两点间的风速变化率,并将强度因子绝对值最大值作为该次测量中风切变的告警数值依据。强度因子公式如下所示:式中:
$\dfrac{{{\rm d}V}}{{{\rm d}t}}$ 为风速变化率;$ \Delta V $ 为廓线上两点间的风速差;$V_{\rm app}$ 为飞机标准进近速度,参考香港机场风切变系统取144 kt (约74 m/s)。文中统计了满足公式(6)的设定条件,且强度因子值不小于1.5×10−3(对应$R$ =4000 m)的风切变事件。一条风廓线上可能同时存在顺风切变和逆风切变,着陆过程中顺风风切变对航空器的危害程度要大于逆风风切变,因此逐点检测法首先要查找风廓线上是否存在顺风风切变,如果存在,则先确定顺风风切变所在位置区间,再在该区间以外判别逆风风切变。图7展示了一次顶风廓线上同时存在顺风和逆风切变的情况,
${R_1}$ 为顺风切变区间,$k + {d_2} + {d_\rm s}$ 为起始位置点,${d_1}$ 为区间跨越的风速样本数。${R_2}$ 为利用${R_1}$ 区间以外的数据,再次进行逐点判别后确定的逆风风切变区间,其起始位置为$k$ ,与${R_1}$ 相距${d_\rm s}$ 个采样点,跨越的风速样本数为${d_2}$ 。表2为2019年1~4月期间,实况风向为270°~360°时,36L和01号跑道下滑道顶风廓线上的风切变频次统计,两条跑道的逆风风切变告警次数都是26次,告警率约为1%,但36L跑道的顺风风切变告警次数为102次,其中风向300°~330°区间告警次数为61次,明显高于01号跑道的告警次数,告警率达到4.2%,而01跑道该风向区间顺风风切变告警率仅为0.95%。
Type Runway number Wind direction range/(°) 270-300 300-330 330-360 Against the wind shear 01 6 15 5 36L 4 13 9 Following the wind shear 01 4 12 7 36L 19 61 22 Table 2. Statistics of low-level wind shear frequencies
图9为风切变强度发生强度箱线统计图,纵坐标表示风切变强度因子值,横坐标表示不同类型风切变。上下异常值截断线(内限)为1.5倍箱宽,中位线上方数值对应中位线具体数值,内限下方数值为风切变样本数,红色点表示异常值。统计表明36L跑道的强度因子整体高于01跑道的强度因子,该跑道顺风风切变强度因子的离散性相对较大。
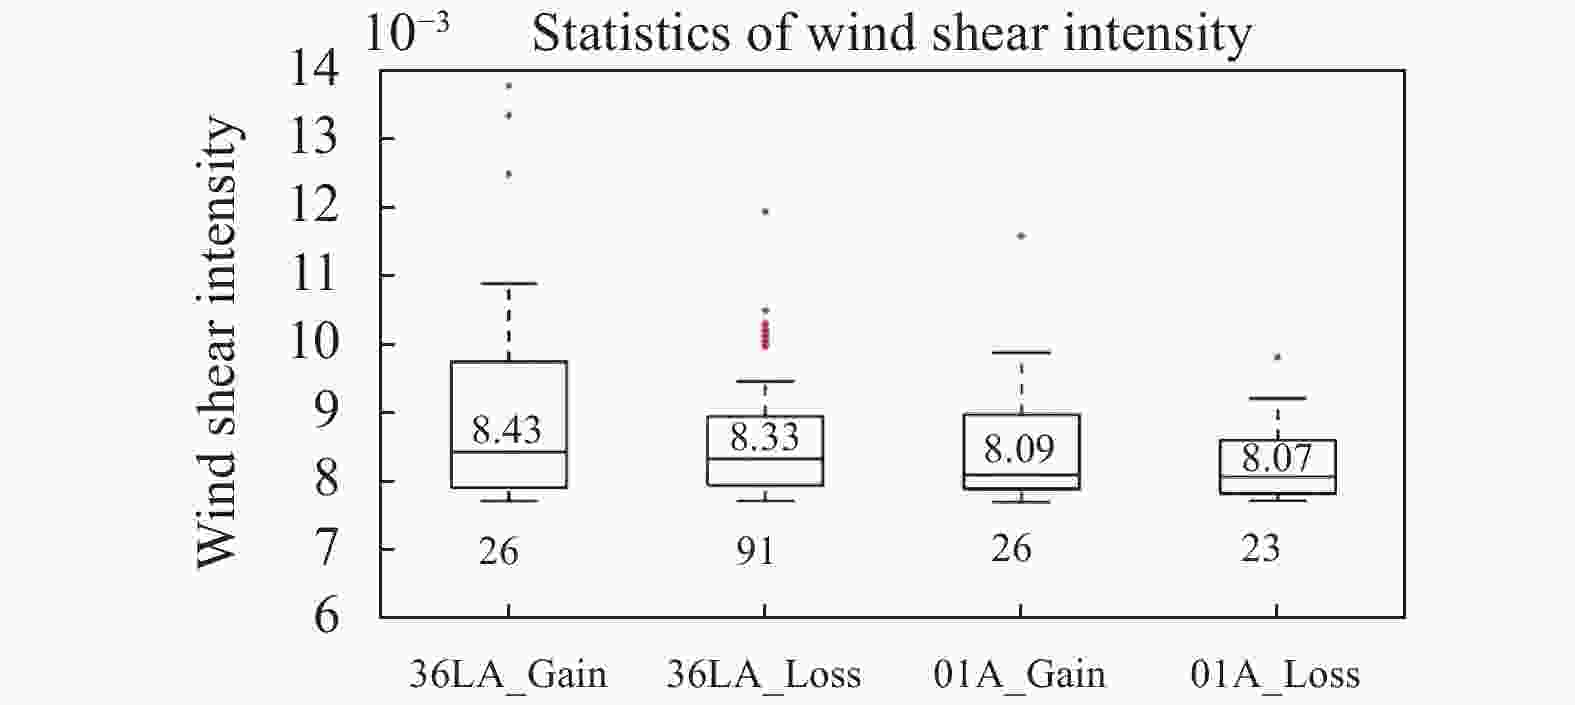
Figure 9. Box plots of wind shear intensity on runway 36L and runway 01
图10分别为36L和01号跑道风切变发生的水平和垂直位置箱线图,纵坐标表示跑道和风切变类型,横坐标分别为风切变位置与跑道入口的相对距离或高度。蓝色虚线表示跑道南延长线,红、黑色箱线分别表示风切变开始和终止的水平位置(图10(a))或垂直高度(图10(b))。可见两条跑道风切变水平起始位置大多集中在跑道入口外4~3 km,对应的垂直高度在200~140 m左右。顺风风切变终止位置大多集中在跑道外2~1 km,逆风风切变大多集中在跑道外3~2 km,对应的垂直高度范围分别在100~50 m和125~75 m左右。总体而言,逆风风切变强度比顺风风切变强度强,但是顺风风切变发生的高度总体比较低。

Figure 10. Box plots of horizontal locations (a) and vertical height (b) positions of wind shear events on runway 36L and runway 01
-
激光测风雷达数据分析结果表明:在西北风背景条件下,首都机场36L-18R跑道相比于19-01跑道确实存在明显的风速偏小现象,在300°~330°风向区间36L跑道接地带风速负偏差达到最小。风速偏小的数值及空间范围随环境风速增大而增加,主要集中在400 m高度以下,跑道入口内1 km的空间范围。通过对民航报文发布的机场三条跑道南接地带的风速进行统计也印证了36L跑道风速偏小的现象。
基于激光测风雷达RHI数据构建36L和01两条跑道的下滑道顶风廓线数据,并利用风切变强度因子统计西北大风条件下两条跑道的风切变强度及发生位置。统计表明:36L跑道的风切变频次明显多于01跑道,且大多数的风切变事件集中在300°~330°风向区间。另外不论顺风还是逆风风切变,36L跑道的发生概率均高于01跑道。就风切变性质而言,两条跑道的顺风风切变强度比逆风风切变整体强度弱,但顺风风切变发生的高度总体比逆风风切变低。
Low-level wind shear characteristic statistic of two runways of Beijing Capital International Airport based on strong wind background
doi: 10.3788/IRLA20210119
- Received Date: 2021-02-27
- Rev Recd Date: 2021-06-07
- Available Online: 2022-01-06
- Publish Date: 2021-12-31
-
Key words:
- wind lidar /
- wind speed deviation /
- low-level wind shear /
- statistic analysis
Abstract: Data available in this study came from RHI scanning mode of two sets of coherent Doppler lidar which housed near the south entrance of runway 18R-36L and runway 19-01 in Beijing International Capital Airport, respectively. Average deviation of radial velocity at multiple heights below 600 meter above the ground level over two runways and their south glide path areas in different wind speed and direction ranges were calculated separately. Results show that under the strong northwest wind background radial wind speed over runway 18R-36L is relatively lower than other areas with same altitude, which is consistent with characteristic of wind speed observed in three runway touch down zones under the same wind background. In addition, this phenomenon is most significantly appeared in wind direction range of 300°-330° and the minimum negative deviation area appeared near the entrance of runway 18R. The intensity factor of wind shear was used for further statistics to determine the intensities and locations of low-level wind shear events along the glide path of runway 36L and 01 in the strong northwest wind background. Statistics explain that the frequencies and the intensities of low-level wind shear happened on runway 36L are obviously higher than those happened on runway 01 in the same wind context. In 300°-330° direction range frequencies of low-level wind shear of two runways are both the highest and the frequency of following wind shear is significantly higher than the against wind shear, even though the heights of occurrence with following wind shear are relatively lower than the against wind.


 DownLoad: