Volume 50 Issue 12
Dec.  2021
Turn off MathJax
Article Contents

Zhou Peng, Hu Chenghai, Bi Chao, Hao Xue. Auto focusing technology of three-axis vision measuring system[J]. Infrared and Laser Engineering, 2021, 50(12): 20210141. doi: 10.3788/IRLA20210141
Citation: Zhou Peng, Hu Chenghai, Bi Chao, Hao Xue. Auto focusing technology of three-axis vision measuring system[J]. Infrared and Laser Engineering, 2021, 50(12): 20210141. doi: 10.3788/IRLA20210141

Auto focusing technology of three-axis vision measuring system

doi: 10.3788/IRLA20210141
  • Received Date: 2021-03-09
  • Rev Recd Date: 2021-05-14
  • Publish Date: 2021-12-31
  • To reduce the time consumption of the three-axis vision measurement system in the focusing process and improve the accuracy of focusing, an auto-focus algorithm based on the optical defocus model was proposed. The evaluation function of the auto-focus algorithm adopted the Tenengrad gradient function. The search algorithm was divided into two steps: (1) The optical defocus model was decomposed into two curve functions, the two curve functions were solved through collecting the sharpness values of 4 images and their x-axis coordinates and the intersection position of the two curves was obtained. The intersection position was the approximate position of the on-focus position; (2) One image was collected at the intersection position and two images were collected on the left and right sides of the intersection point. The mean value of the fitting Gaussian function was obtained by Gaussian function fitting, which was the exact on-focus position. To verify the method, firstly, 10 times repeatability experiment was processed, the error of repeatability was 4.1 μm. Secondly, an image at rough focus position was obtained and 2 images on the left of rough focus position and 2 images on the right were obtained. The precise focus position was given by Gaussian fitting. The 10 times repeatability error of precise focus position was 5.1 μm. The algorithm only needed to collect 9 images, and the synthetic standard uncertainty was 2.12 μm. The algorithm improves the focusing efficiency and accuracy of the three-axis vision measurement system.
  • [1] Zhu Wenyan, Zhou Lianqun, Zhang Zhiqi, et al. Autofocus of microarray digital PCR fluorescent chip [J]. Optics and Precision Engineering, 2020, 28(9): 2065-2075. (in Chinese) doi:  10.37188/OPE.20202809.2065
    [2] Jin Zheyan, Xu Zhihai, Feng Huajun, et al. Research on zoom algorithm based on dual resolution camera [J]. Infrared and Laser Engineering, 2020, 49(5): 20190463. (in Chinese) doi:  10.3788/IRLA20190463
    [3] Zhang Yanchao, Zhao Jian, Han Xizhen, et al. Application of SUSAN definition evaluation function in auto-focusing [J]. Chinese Optics, 2014, 7(2): 240-244. (in Chinese) doi:  10.3788/CO.20140702.0240
    [4] Wang Yeru, Feng Huajun, Xu Zhihai. An adjustable coverage range autofocus evaluation function using gradient operater with variable frequency [J]. Infrared and Laser Engineering, 2016, 45(10): 1028001. (in Chinese) doi:  10.3788/IRLA201645.1028001
    [5] Liu Shuxin, Liu Manhua. Auto-focusing algorithm based on fuzzy entropy evaluation and optimal search [J]. Journal of Chongqing University of Posts and Telecommunications (Natural Science Edition), 2017, 29(4): 514-520. (in Chinese) doi:  10.3979/j.issn.1673-825X.2017.04.014
    [6] Wang Yeru. Research on autofocus method based on digital image processing[D]. Hangzhou: Zhejiang University, 2018. (in Chinese)
    [7] Ren Gongchang, Liu Chongzhan, Liu Peng, et al. Study on monocular distance measurement based on auto focus [J]. Machinery Design and Manufacturing, 2019(4): 146-149. (in Chinese) doi:  10.3969/j.issn.1001-3997.2019.04.037
    [8] Guo Yunjie, He Ping'an. Research on automatic focusing algorithm of digital optical bench [J]. Optics and Optoelectronic Technology, 2020, 18(3): 88-94. (in Chinese)
    [9] Luo Jun, Sun Li, Min Zhisheng. Application of zoom tracking curves in focusing [J]. Optics and Precision Engineering, 2011, 19(10): 2326-2332. (in Chinese) doi:  10.3788/OPE.20111910.2326
    [10] Bao Chengxiao, Jiang Wei, Wang Yuxiao. Automatic focusing algorithm based on Otsu segmentation and local maximum gradient [J]. Optical Technology, 2019, 45(6): 756-761. (in Chinese)
    [11] Luo Wenrui. Auto-focusing method for microscopy based on improved hill-climbing algorithm [J]. Tool Technology, 2019, 53(9): 112-116. (in Chinese) doi:  10.3969/j.issn.1000-7008.2019.09.028
    [12] Yang Xianlun. Research on auto-focus algorithms based on image processing[D]. Hefei: Anhui University, 2018. (in Chinese)
    [13] Bi Chao, Hao Xue, Li Jianfei, et al. Experimental study on focusing evaluation functions of images of film cooling hole [J]. Astronautical Measurement Technology, 2019, 39(6): 77-83. (in Chinese) doi:  10.12060/j.issn.1000-7202.2019.06.15
    [14] Li Chengchao, Yu Zhanjiang, Li Yiquan, et al. Sharpness evaluation of microscopic detection image for micro parts [J]. Semiconductor Optoelectronics, 2020, 41(1): 103-107+113. (in Chinese) doi:  10.16818/j.issn1001-5868.2020.01.022
    [15] Lv Hengyi, Liu Yang, Xue Xuchen. Difference auto-focusing based on particle swarm optimization searching and wavelet evaluation [J]. Chinese Optics, 2011, 4(3): 283-292. (in Chinese) doi:  10.3969/j.issn.2095-1531.2011.03.011
    [16] Bi Chao, Hao Xue, Liu Mengchen, et al. Study on calibration method of rotary axis based on vision measurement [J]. Infrared and Laser Engineering, 2020, 49(4): 0413004. (in Chinese) doi:  10.3788/IRLA202049.0413004
  • 加载中
通讯作者: 陈斌, bchen63@163.com
  • 1. 

    沈阳化工大学材料科学与工程学院 沈阳 110142

  1. 本站搜索
  2. 百度学术搜索
  3. 万方数据库搜索
  4. CNKI搜索

Figures(12)  / Tables(2)

Article Metrics

Article views(353) PDF downloads(37) Cited by()

Related
Proportional views

Auto focusing technology of three-axis vision measuring system

doi: 10.3788/IRLA20210141
  • Aviation Key Laboratory of Science and Technology on Precision Manufacturing Technology, Beijing Precision Engineering Institute for Aircraft Industry, Beijing 100076, China

Abstract: To reduce the time consumption of the three-axis vision measurement system in the focusing process and improve the accuracy of focusing, an auto-focus algorithm based on the optical defocus model was proposed. The evaluation function of the auto-focus algorithm adopted the Tenengrad gradient function. The search algorithm was divided into two steps: (1) The optical defocus model was decomposed into two curve functions, the two curve functions were solved through collecting the sharpness values of 4 images and their x-axis coordinates and the intersection position of the two curves was obtained. The intersection position was the approximate position of the on-focus position; (2) One image was collected at the intersection position and two images were collected on the left and right sides of the intersection point. The mean value of the fitting Gaussian function was obtained by Gaussian function fitting, which was the exact on-focus position. To verify the method, firstly, 10 times repeatability experiment was processed, the error of repeatability was 4.1 μm. Secondly, an image at rough focus position was obtained and 2 images on the left of rough focus position and 2 images on the right were obtained. The precise focus position was given by Gaussian fitting. The 10 times repeatability error of precise focus position was 5.1 μm. The algorithm only needed to collect 9 images, and the synthetic standard uncertainty was 2.12 μm. The algorithm improves the focusing efficiency and accuracy of the three-axis vision measurement system.

  • 自动对焦技术包括对焦评价函数和搜索算法。对焦评价函数可分为空间域、频率域和信息熵三类[1]。空间域评价函数基于梯度算子,图像越清晰,边缘越明显,图像梯度越大。空间域方法简单,计算量小,应用最多。频率域算法是将图像变换到频域计算图像清晰度。图像越清晰,包含的高频成分越多。频率域算法需要进行傅里叶变换,计算复杂度高[2-4]。熵函数描述系统的混乱程度,在图像中,反应图像灰度信息的分布状态,离焦图像的灰度分布均匀,灰度级变化小,对应的熵值越小;相反,正焦图像灰度值分布差异大,则熵值大[5]

    搜索算法有很多种类,根据系统是否带有发射装置,可分为主动对焦和被动对焦两种类型[6]。主动对焦是系统自带发射装置,通过发射装置发出信号,然后通过接收装置接收从被摄物体反射回来的信号,通过计算得出正焦位置。常用的主动对焦方法有红外测距法、超声波测距法以及PSD测距法[7]。主动对焦可以快速一步到位完成对焦,但是对焦精度受测距方法限制,且需额外装配发射和接收装置。被动对焦是通过被拍摄物自身反射到CCD上的光进行分析,判断像的离焦状态。被动对焦减少了发射和接收装置,但是传统的被动对焦方法效率低[8-9]。常用的被动对焦方法有爬山算法、全局搜索算法、黄金分割法、Fibonacci搜索算法和拟合算法[10]。全局算法首先需要确定对焦范围、搜索方向和步长,然后沿着搜索方向按固定步长步进采集图像,并计算图像的清晰度,最后选取清晰度值最高的图像的拍摄位置作为正焦位置。全局算法的对焦精度取决于步长,步长越小精度越高,但是对焦精度和对焦速度成反比,在要求高精度和快速对焦场合不适用。爬山算法是基于对焦评价函数呈高斯函数状,具有单峰性。通过比较不同位置的评价函数值确定搜索方向,当下一幅图像评价值小于上一幅时,说明越过峰顶,减小步长,往回搜索[11]。实际情况可能存在干扰,评价函数出现多峰,爬山算法容易陷入局部极值,且搜索过程重复运动耗费时间较长。为了解决由于运动次数多而导致对焦时间长和爬山算法陷入局部极值问题,又提出黄金分割对焦算法,按照黄金比例不断减小搜索空间。首先选定搜索区间l(l1~l2),然后确定两端的黄金分割点(m1=0.328l,m2=0.618l),比较m1m2两个点的评价函数值F(m1)和F(m2),若F(m1)>F(m2),则调整搜索范围为(m1, l2),若F(m1)<F(m2),则调整搜索范围为(l1, m2),依次逐渐减小搜索范围,直到搜索范围达到精度要求。黄金分割法在一定程度减少了搜索时间,然而完成对焦仍需较多时间,且要达到高精度,对焦时间也将会增加。

    基于现有方法在对焦时间和对焦精度上的问题,文中提出一种基于离焦模型,通过4个点求出两条曲线的方程(两条曲线呈近似对称分布,对称点在正焦位置附近),求出两条双曲线的交点。交点必然在正焦位置附近,驱动三轴运动机构运动到交点位置进行粗定位,然后在交点位置取1点以及交点左右按设定间隔各取2点,最终得到的5个点可以把顶点包含。最后通过高斯函数拟合,求出拟合高斯函数顶点的位置即为正焦位置。文中提出的自动对焦算法只需采集4张图像对正焦位置进行粗定位,极大的提高对焦的实时性;在交点附近采集5张图像进行高斯函数拟合求顶点位置保证了系统对焦精度。
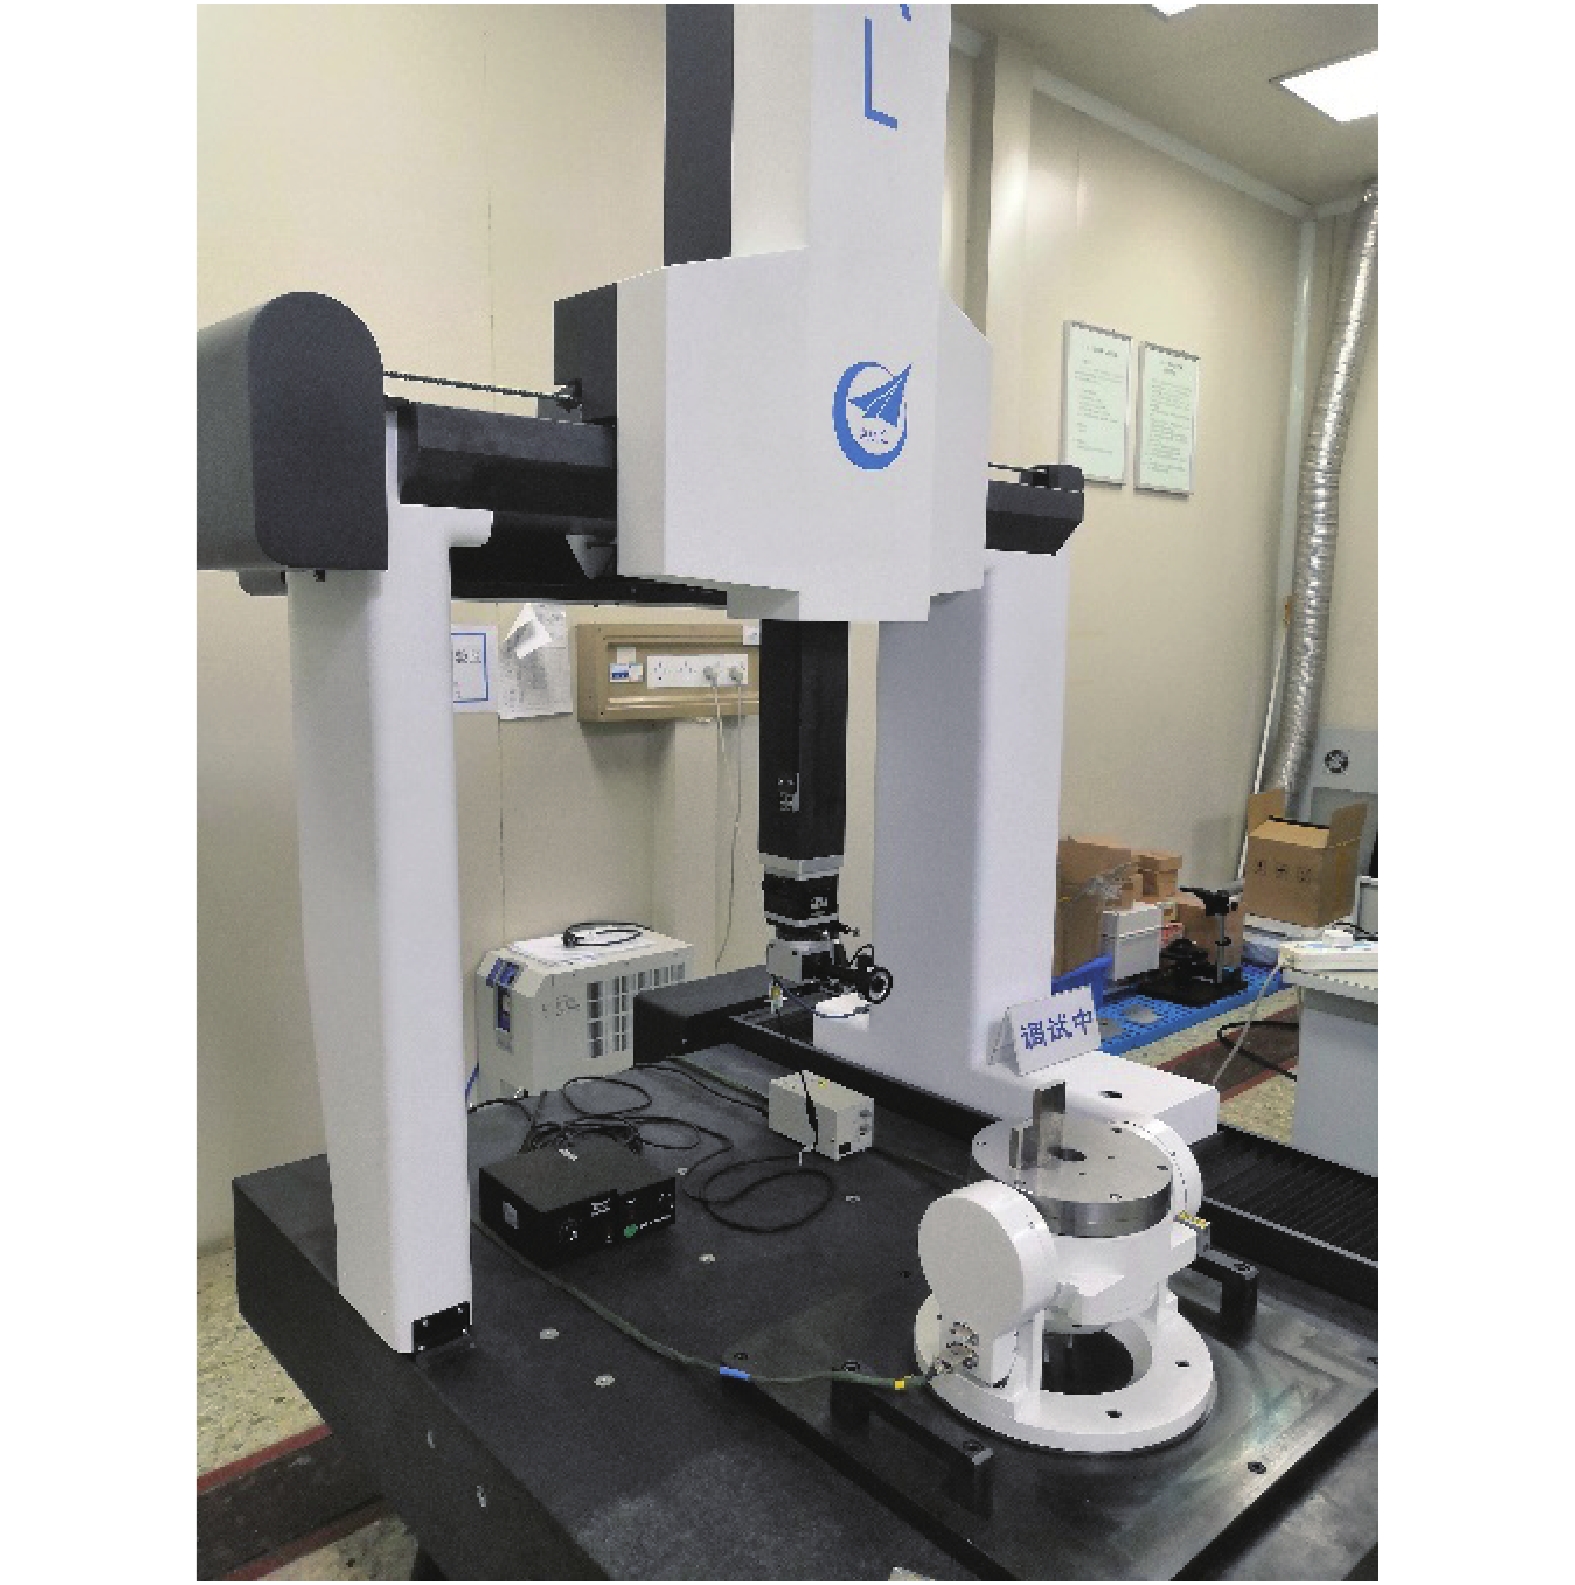
    • 三轴系统的运动机构由XYZ三个直线轴构成。其中XYZ轴是三轴运动装置的三个直线轴。三维姿态调整机构和相机是安装在Z轴末端。相机可以单独沿着XYZ轴运动,或者可以三轴联动,实现相机在XYZ构成的直角坐标系内任意一点的精确定位,三轴视觉测量系统如图1所示。

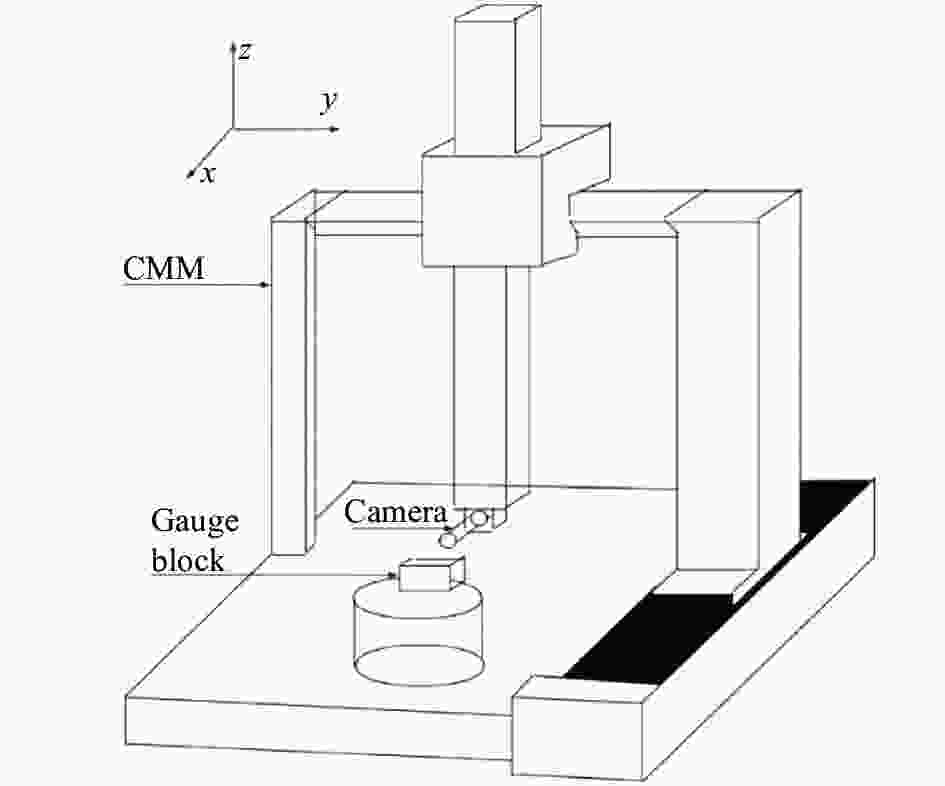
      Figure 1.  Composition diagram of three-axis visual coordinate system

      三轴运动装置的X轴行程为600 mm,Y轴行程400 mm,Z轴行程400 mm,各轴的光栅尺的分辨率为0.5 μm,测量不确定度(2.5+3×L/1000) μm(L为运动范围),重复定位精度为2.8 μm。

    • 在理想光学成像系统中,物方焦点处的一个物点通过光学镜头成像在像方焦平面上为一个点。但是在实际的成像系统中很难使得被拍摄物体处于物方焦点处,当被拍摄物体不在物方焦点时,成像系统处于离焦状态,此时物方的一个点成像在像平面上为一个弥散圆[12]。物点距离焦点越远,弥散圆半径越大,所成的像就越模糊。光学成像系统离焦模型如图2所示,P为物方的一个点P'为理想像点,P"为弥散圆中心,R为弥散圆半径,A为弥散圆边缘上的一个点。

      Figure 2.  Defocus model of optical system

      弥散圆中每个像素点的能量为$ 1/\pi {R}^{2} $,当计算其对焦评价函数值时,弥散圆里面的像素点能量可以相互之间抵消,只有弥散圆圆周上的像素点参与计算。所以在计算对焦评价函数值时,只需计算弥散圆圆周的长度和每个像素点的能量即可。对于弥散圆圆周上的弧长,当取$ \theta $很小时,其可以看作是一段直线段,对应的长度可以近似为$R{\rm d}\theta$,将其分成水平和垂直两个分量,分别表示为$R{\rm d}\theta {\rm sin}\theta$$R{\rm d}\theta {\rm cos}\theta$。所以弥散圆对应的对焦评价函数值$ f\left(I\right) $用圆周上的线积分表示为:

      式中:C为常量,所以图像的对焦评价函数值与弥散圆半径成反比,即图像的清晰度评价值和离焦量成反比。

      因此,令成像系统的离焦量用$ |x-c| $表示,x表示相机位置,c表示正焦位置,则通过以下模型表示光学成像系统的离焦量和图像清晰度评价值之间的关系:

      式中:ab为常量,b用于表征相机和镜头的参数,并且避免模型的分母为0。可以看出模型中有三个未知数,需要三组数据代入模型求解。数据代入模型后得到一个非线性方程组,但是在非线性方程组的求解中涉及到大量的运算,增加程序的负担,且在实际求解过程中时常出现无解的情况,甚至解出的c值与实际的正焦位置相差甚远,存在不可控因素。对于搭载精密光学器件的三轴运动机构而言,运动范围不可知,这是不允许的,随时会发生碰撞,损坏器件。

      因此,从新分析模型,得到下式:

      可知,当相机位于峰顶左侧时,清晰度评价函数值与相机位置的函数关系曲线呈开口向左的反函数状,当相机位于峰顶右侧时,对焦评价函数值与相机位置的函数关系曲线呈开口向右的反函数状,如图3所示。

      Figure 3.  Intersection point picture of two curves

      两条双曲线交点的横坐标c可以作为正焦位置的近似值。对焦过程首先确定对焦范围(x1~x4),对于x1x4位置的选取,首先将相机移动到一个被测物成像模糊的位置,定该位置为x1,然后沿着光轴方向移动相机靠近被测物,此时图像的清晰度由模糊逐渐变清晰再到模糊,直到图像模糊程度与x1位置图像模糊程度相似,此时位置定为x4。接着在x1x2位置各采集一张图像,并计算其清晰度值y1y2(由公式(7)计算得出),将(x1,y1)和(x2,y2)代入公式(3),求出a1b1。同理,求出a2b2。在求解ab参数时,将两个点代入后,可以将方程组变换成下式:

      先求出b1,然后将b1代入第二个式子求a1。将方程组求解问题转化为数字运算,简化计算过程,同理求出a2b2。得到两条曲线的表达式后,求出交点c

      x1(x3)和x2(x4)之间的间隔d选取需合理,才能使求出的交点坐标更接近正焦位置。d一般取(x4-x1)×30%,满足两点覆盖曲线大部分区域,又不至于使得当(c-x1)与(x4-c)出现较大差别时,x2x3取值超过峰顶对应的值。如图4所示,为当确定的对焦范围的中心位置与正焦位置有较大偏差时,且x1(x3)与x2(x4)之间的间隔d选取过大时的情况,可以看到x3已经越过峰顶,此时x3求得的清晰度值为曲线1对应的值,使用该值计算得到的曲线的交点会往左偏移。

      Figure 4.  Schematic diagram of the large difference between the focus range center point and the on-focus point

      通过两条曲线求得的交点只是对正焦位置进行粗定位,若想达到更高的精度仍需在交点处采集一张图像以及交点两边各采集两张图像。通过这5张图像的清晰度值及其位置进行高斯函数拟合,高斯函数如下:

      式中:b为精确的正焦位置。

      对于交点左右图像采集的间隔有一定要求,5张图像只需把整个峰顶覆盖即可,不宜取过大的间隔,如图5所示,图像采集点应在蓝色方框内,以保证求出的b有较高的精度。当采集图像的位置越远离交点,其点分布与高斯分布差别越大,对应的b值也会有一定的偏差。以文中实验与结果分析中实验为例,实验中对焦范围为1000 μm,5张图像的间隔为10 μm,则5张图像覆盖了顶点左右各20 μm区域。

      Figure 5.  Schematic diagram of image collection point range

      文中提出的搜索算法不需要解方程组,解决了非线性方程组无解问题,且两条曲线的交点位置是可预知的,交点必然位于预设的搜索范围内,三轴运动机构的运动范围是可控的。

    • 在基于数字图像的被动对焦方式中,通过对焦评价函数的值判断所拍摄的图像正焦和离焦状态,对焦评价函数值最大的位置为正焦位置,且正焦位置两边图像的清晰度值随着远离正焦位置是逐渐减小的。因此,所选取的对焦评价函数因具有以下特性:单峰性、无偏性、灵敏度高、计算量小以及稳定性好[13-14]

      文中选取的对焦评价函数Tenengrad梯度函数,该函数以Sobel算子为基础,分别计算图像的水平梯度值和垂直梯度值[15]。其表达式如下:

      式中:${G}_{u}\left(u,v\right)$${G}_{v}\left(u,v\right)$分别表示图像像素点(u, v)与Sobel算子水平模板和垂直模板的卷积。Sobel算子模板如下:

      通过图像与模板的卷积然后对卷积结果进行求和的值即为图像的清晰度,计算公式如下:

      式中:“*”表示卷积。

    • 该系统包含三轴运动机构,工业相机,远心镜头,LED光源。三轴运动机构选用北京航空精密机械研究所生产的PEARL 555型三坐标测量机,如图6所示。在测量机Z轴末端搭载图像采集系统用于采集图像。该型测量机X,Y,Z轴以及工作平台均采用大理石制作,具有相同的热应力[16]

      Figure 6.  Three-axis vision coordinate measuring system

      工业相机选用大恒生产的水星MER系列工业面阵黑白数字相机,具有高清晰度、低噪声、安装及使用方便等特点。为使镜头与相机可以配合使用,选择日本MORITEX公司的MMLST系列工业远心镜头。

    • 为了验证自动对焦搜索算法的有效性和准确性,按照文中所述自动对焦算法,对不同被测物(航空发动机静子环表面、气膜孔等)分别进行多次实验,下面选取具有代表性的标准量块进行说明。同时,实验采用可控光源进行照明,保证实验图像质量以及实验过程中光照环境不变。

      实验所拍摄的物体为一个标准量块,量块被拍摄面是经过研磨的平整表面,量块厚度T为10 mm,如图7所示。

      Figure 7.  Schematic diagram of gauge block

      将量块放置在气浮转台的工作平面上(气浮转台工作平面与三坐标测量机的Z轴垂直),通过千分表调整量块方位,使量块的拍摄面与相机的光轴垂直,如图8所示。

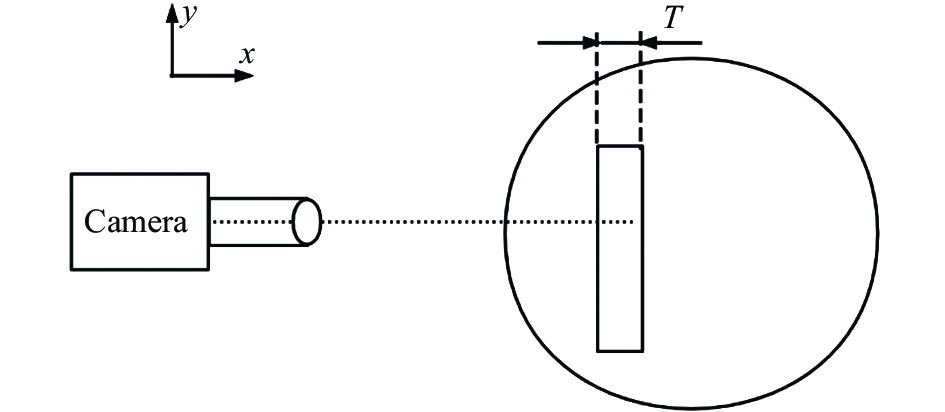
      Figure 8.  Schematic diagram of the gauge block perpendicular to the optical axis of the camera

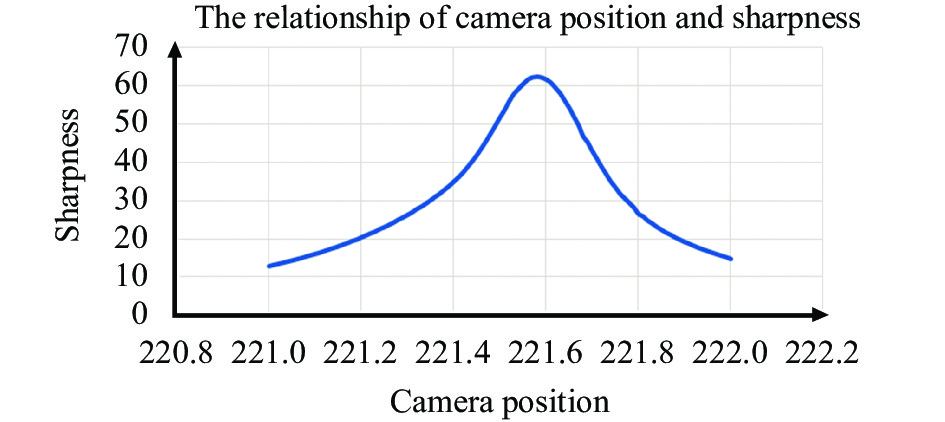
      通过三轴运动机构调整相机位置,使量块拍摄面成像与相机上。首先使用传统的全局搜索法确定正焦位置,确定对焦范围从三轴运动机构X轴的坐标值221~222 mm,对焦长度
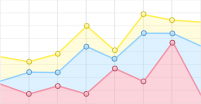
$ {l}_{f}=1\;{\rm{mm }}$,步长$ ∆=5$ μm。相机沿着X轴正方向以5 μm步长前进采集图像,并计算图像的清晰度值。相机位置与图像清晰度关系曲线如图9所示。图像清晰度值最大的位置为221.584 6 mm。

      Figure 9.  Relationship curve between camera position and image sharpness

      将相机分别移动到X1X2X3X4,采集图像并计算其清晰度值。三轴运动机构本身存在误差,无法准确移动到设定位置,但是误差在可接受范围。根据得到的相机位置以及相应位置图像的清晰度值求出两条曲线的交点位置,如此重复10次实验。得到粗定位正焦位置值如下表1所示。

      No.Curve intersection position/mm
      1221.5709
      2221.5702
      3221.5724
      4221.5714
      5221.5720
      6221.5705
      7221.5737
      8221.5740
      9221.5746
      10221.5737

      Table 1.  Curve intersection position of 10 times approximate positioning

      表1可以看出,通过两条曲线交点进行粗定位算法的重复性最大误差为4.1 μm,与通过全局搜索算法得到的正焦位置10次最大误差为14.1 μm。由于该算法第二部分是在得到的曲线交点两边以图像间隔距离10 μm各采集2张图像,则5张图像的覆盖范围为以交点为中心的左右20 μm,可以把最高点包含,所以对于粗定位而言,14.1 μm的误差在可接受范围。

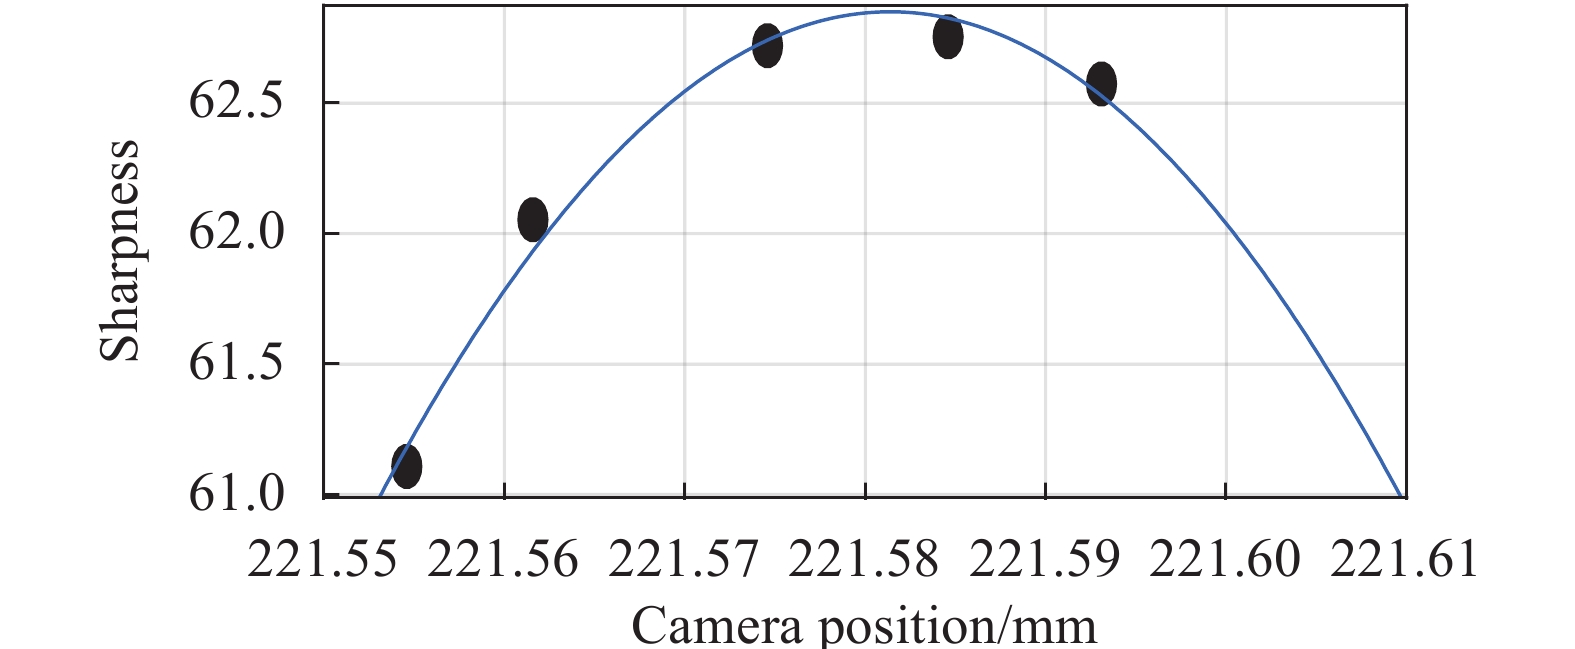
      得到正焦位置的粗略位置X0后,将相机移动到该位置采集图像并计算图像的清晰度值。然后分别在曲线交点左右按10 μm间隔(X0−20,X0−10,X0+10,X0+20)各采集2张图像并计算图像的清晰度值。对得到的5组数据进行高斯曲线拟合,拟合曲线如图10所示,求出拟合高斯函数峰顶对应的横坐标值$ {X}_{f} $

      Figure 10.  Gaussian fitting curve

      对上文得到的10个曲线交点依次在其左右按10 μm间隔各采集2张图像并计算其图像清晰度值,然后进行高斯曲线拟合曲线求出$ {X}_{f} $,得到的10组数据如表2所示。

      No.$ {X}_{f} $/mm
      1221.5810
      2221.5853
      3221.5856
      4221.5856
      5221.5868
      6221.5846
      7221.5819
      8221.5827
      9221.5845
      10221.5855

      Table 2.  The on-focus position of 10 times Gaussian curve fitting

      表2数据可知,通过高斯曲线拟合的到的正焦位置与全局搜索算法的到的正焦位置相差无几,10次拟合得到正焦位置的重复性最大误差为5.3 μm。

      在上述实验过程中,合成不标准确定度的主要影响因素为:(1)测量重复性引起的不确定度;(2)三轴运动机构示值误差引起的不确定度。

      第一,对标准量块的拍摄面进行10次重复性对焦实验,其不确定度分量$ {u}_{1} $为:

      第二,三轴运动机构的示值误差为(2.5+3×L/1000) μm (L为运动范围),在对量块的拍摄面进行对焦实验中,三轴运动机构最大移动范围为1 mm,则分布区间半宽a为:

      假设示值误差服从均匀分布,取包含因子$ k=\sqrt{3} $,则三轴运动机构示值误差引起的不确定度分量$ {u}_{2} $为:

      不确定度分量$ {u}_{1} $$ {u}_{2} $相互独立,则标准量块拍摄面对焦实验结果的合成标准不确定度u为:

      为了进一步验证文中算法的准确性,在量块后面再放一块量块,两个量块表面紧紧贴合,如图1112所示。使用文中自动对焦算法分别求出第一个量块的拍摄面与第二个量块拍摄面的正焦位置,然后用后面量块正焦位置减去前面量块正焦位置的值与前面量块厚度T=10 mm比较。使用文中自动对焦算法对第一个量块的拍摄面进行对焦,得到正焦位置为x1=211.584 5 mm;对第二个拍摄面进行对焦,得到正焦位置为x2=221.585 3 mm,所以第一个量块的厚度为$T’$=x2x1=10.000 8 mm。文中自动对焦算法得到的量块厚度与实际量块厚度差值为∆$={T’}-T=0.8\;\text{μ}{\rm{ m}}$。虽然相机景深大于0.8 μm,但是在实验中发现相机在景深范围内移动拍摄多张图像,多张图像之间的清晰度值有较大的差别,且越靠近正焦位置的图像清晰度值越大,最后通过高斯曲线拟合进一步提高对焦精度,所以景深远大于结果数值是合理的。

      Figure 11.  Placement diagram of two gauge blocks

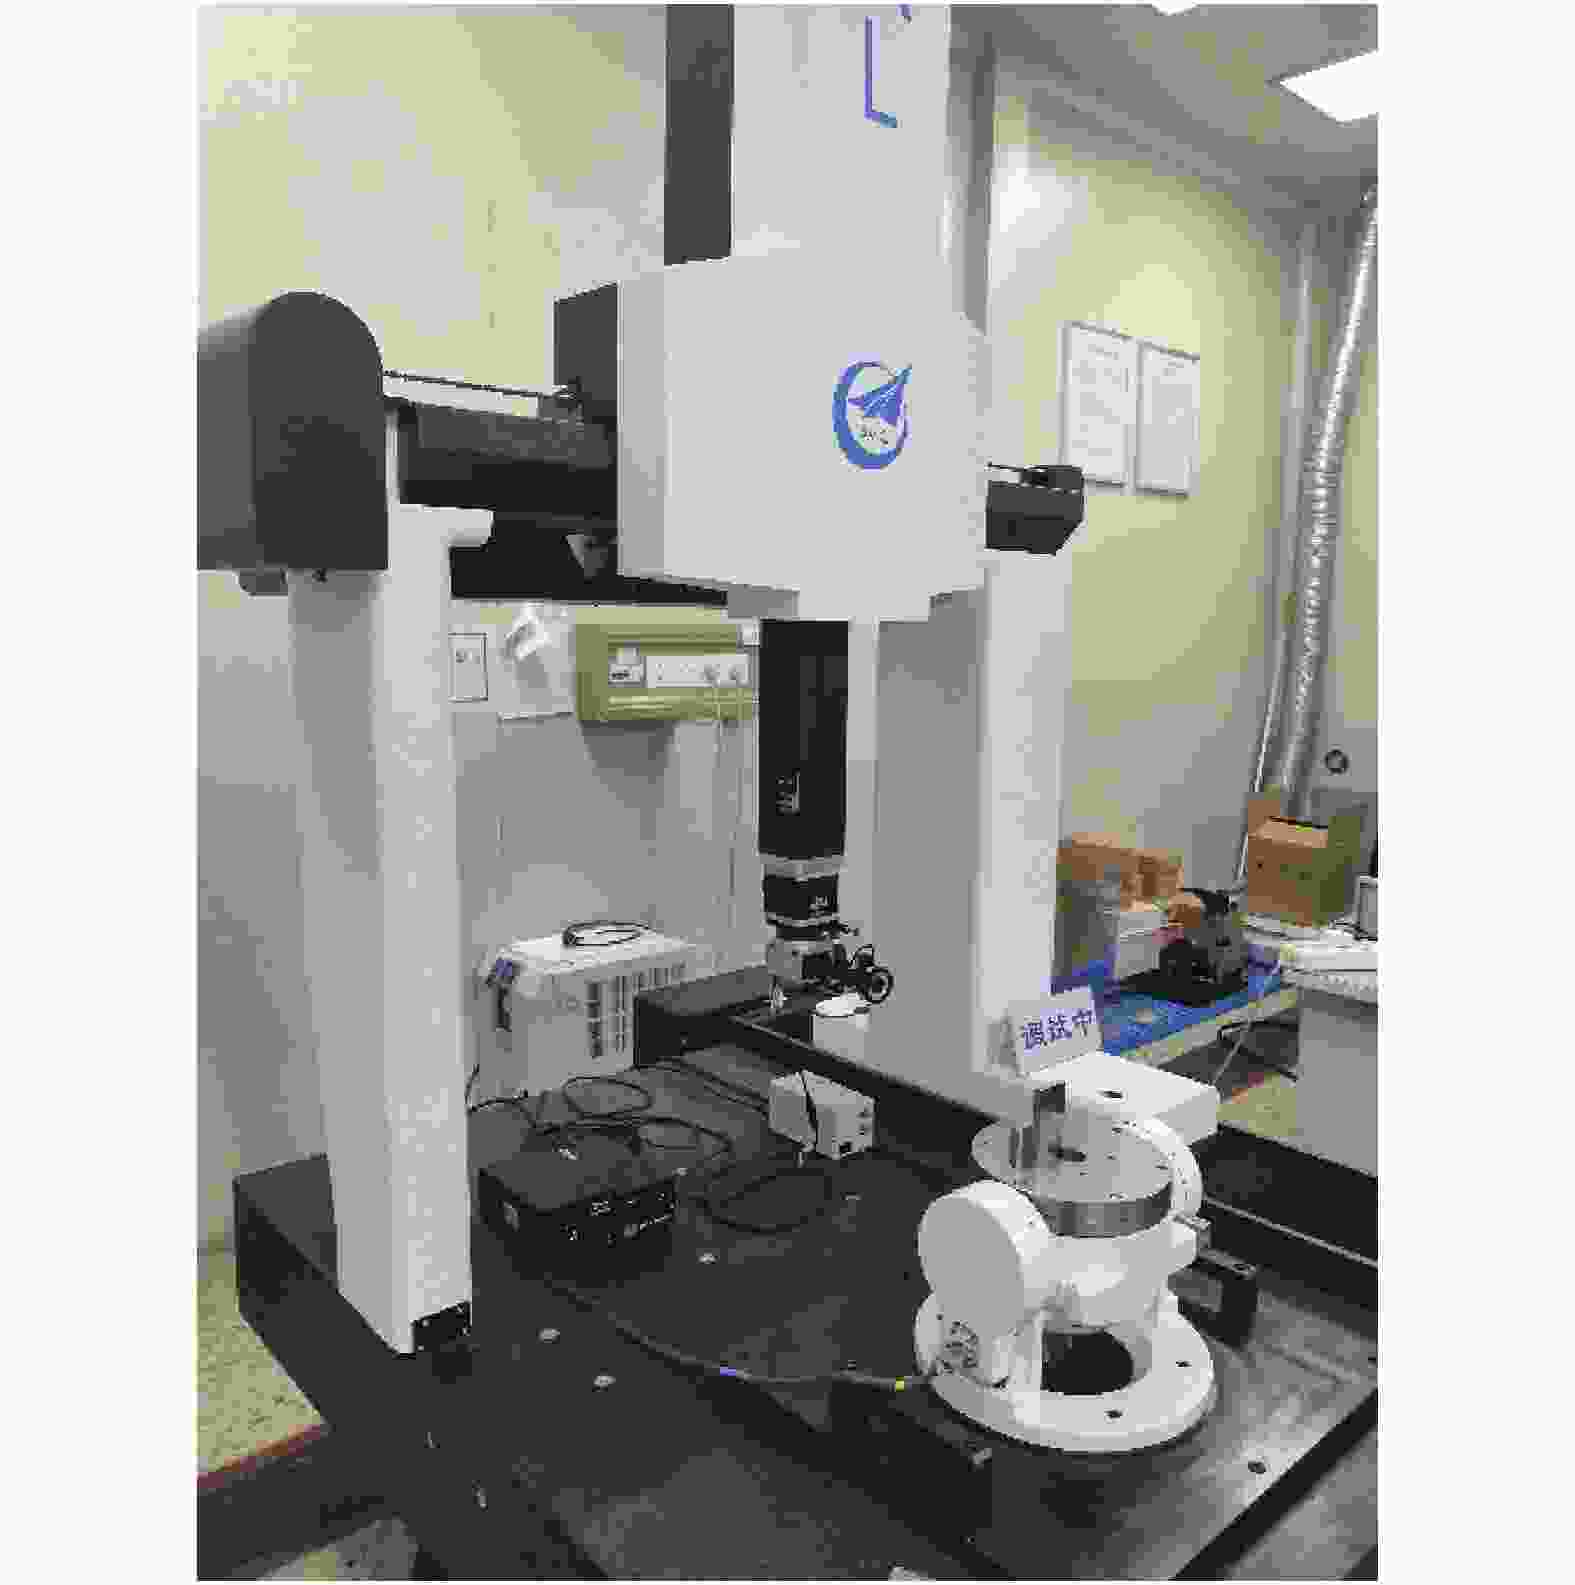
      Figure 12.  Measuring the thickness of the gauge block

      实验验证了文中自动对焦算法的正确性和有效性。文中算法还可以用于测物体间距、测物体厚度等。对于物体间距测量,通过对焦算法找到两个物体表面的正焦位置,两物体表面的正焦位置值的差值即为物体间距。对于厚度测量,文中实验与结果分析中测量量块厚度即是实例,且得到很好的测量精度。

    • 文中提出的自动对焦算法使用Tenengrad梯度函数对图像的清晰度进行评价,搜索算法基于成像系统的离焦原理建立光学离焦模型,但是由于光学离焦模型是非线性方程,求解该非线性方程组时常出现无解或解的值远远超出对焦范围,所以将光学离焦模型分解为两个曲线方程,曲线方程通过转换后不需要解非线性方程组这一步骤,简化计算流程,且两条曲线交点可控,必然位于对焦范围内。然后通过求两曲线交点进行正焦位置的粗定位,最后在交点位置采集1张图像以及交点左右各采集2张图像并计算清晰度值,进行高斯曲线拟合得到准确的正焦位置。经过实验验证,文中提出的自动对焦算法仅需要采集9张图片,就可以达到合成不确定度u=2.12 μm,大大提高了对焦效率和精度。

Reference (16)

Catalog

    /

    DownLoad:  Full-Size Img  PowerPoint
    Return
    Return