


-
探测器阵列靶[1]是测量激光强度时空分布的重要设备,一般测量过程为待测激光束经空间取样衰减后由阵列探测器进行光电信号转换,再由数据采集处理系统进行模数变换后计算质心、环围功率比BQ值、入射激光功率(密度)等光斑信息参数[2],用于入射激光光束特性分析与质量评价[3]。受光电探测器动态响应范围以及设备所使用的光学元件损伤阈值限制,需要对入射到靶的激光强度进行空间取样衰减[4]。取样衰减方式对阵列靶激光参数测量具有重要意义,常用的实现激光功率密度衰减的方式是光学衰减片法,分为吸收型和反射型。吸收型不能承受高功率密度激光长时间辐照,反射型主要是通过镜片镀反射膜的方式,杨鹏翎等[5]采用圆锥形取样孔后安装衰减片,通过衰减片所镀膜系与膜层数改变透过率,这种取样衰减方式对镀膜工艺要求高,且对入射激光波长、偏振态等较为敏感。王振宝等[6]通过在传统积分球出入光孔接出一段圆柱孔,利用球腔漫反射特性进行取样衰减,得出积分球取样透过率与测试点到出光孔距离呈指数关系,积分球取样方式由于球腔结构限制难以做到高分辨力且对入射激光衰减倍率一般需要由实验标定获取,在设计阶段难以进行较为准确的模拟。庞淼等[7]提出一种漫散射取样衰减方法,入射激光经漫散射后通过调节衰减腔长度与增减衰减片的方式进行取样衰减,但是理想的漫散射材料不易获取且抗激光损伤能力有限。
文中针对探测器阵列靶现有取样衰减技术存在的抗激光损伤能力较差[8]、波长响应单一、衰减倍率不能定量设计等问题,基于材料对入射光透射散射特性分析,建立透射材料散射数值仿真模型,设计了毛玻璃与工程漫射体组合的散射取样衰减单元,分析了到探测面散射光分布均匀性与光强衰减特性,针对单通道单元设计了相机成像实验加以验证。结果表明,仿真模拟与实验实测结果具有较好的吻合度,针对探测器阵列靶设计的组合透射散射取样衰减结构具有光斑匀化效果好、到靶激光强度定量衰减、抗激光损伤能力强及宽光谱响应等优点,具有很好的工程应用价值。
-
透射材料分为光学玻璃、光学晶体、光学塑料三大类,它们的光学特性主要由其对各种色光的透过率和折射率决定,一般光学玻璃能透过波长为350~2500 nm的各种色光。在实际应用中,大多数物体表面既不是完全的漫散射,也不是完全的镜面反射或直接透射,多数是强度不一的方向散射[9-10],其中方向透射材料的透射散射光强分布可以用双向透射分布函数(BTDF)[11]表达,如图1所示,

Figure 1. Schematic diagram of BTDF geometry
图中,N为材料法线方向,光束以与材料表面夹角(
$ {\theta }_{\mathrm{i}},{\varphi }_{\mathrm{i}} $ )入射,($ {\theta }_{\mathrm{T}},{\varphi }_{\mathrm{T}} $ )出射,出射光辐射亮度$ \mathrm{d}{L}_{\mathrm{T}} $ 与入射光辐射照度$ \mathrm{d}{E}_{\mathrm{i}} $ 的比值,如公式(1)所示:式中:
$ {f}_{\mathrm{T}}\left({\theta }_{\mathrm{i}},{\varphi }_{\mathrm{i}},{\theta }_{\mathrm{T}},{\varphi }_{\mathrm{T}}\right) $ 为BTDF函数;$ \lambda $ 为入射光波长。 -
对于均匀光源,设入射光功率为
${P}_{\rm i}$ ,透射散射到探测器感光面功率为$ P $ ,${f}_{\rm T}$ 可以表示为[12]:式中:
$\varOmega$ 为立体角,则一定立体角散射功率${P}_{\rm s}$ 可表示为:立体角定义式为:
式中:dS为探测面元;
L为散射距离。若散射材料受照面积为 ${S}_{\rm in}$ ,探测器感光面积为${S}_{\rm d}$ ,则光强衰减倍率k表示为:式中:
${I}_{\rm in}$ 为入射光强;${I}_{\rm out}$ 为出射光强。由公式(5)可得光强衰减倍率与材料透射散射特性相关,与散射距离平方成正比,与入射面积成反比。 -
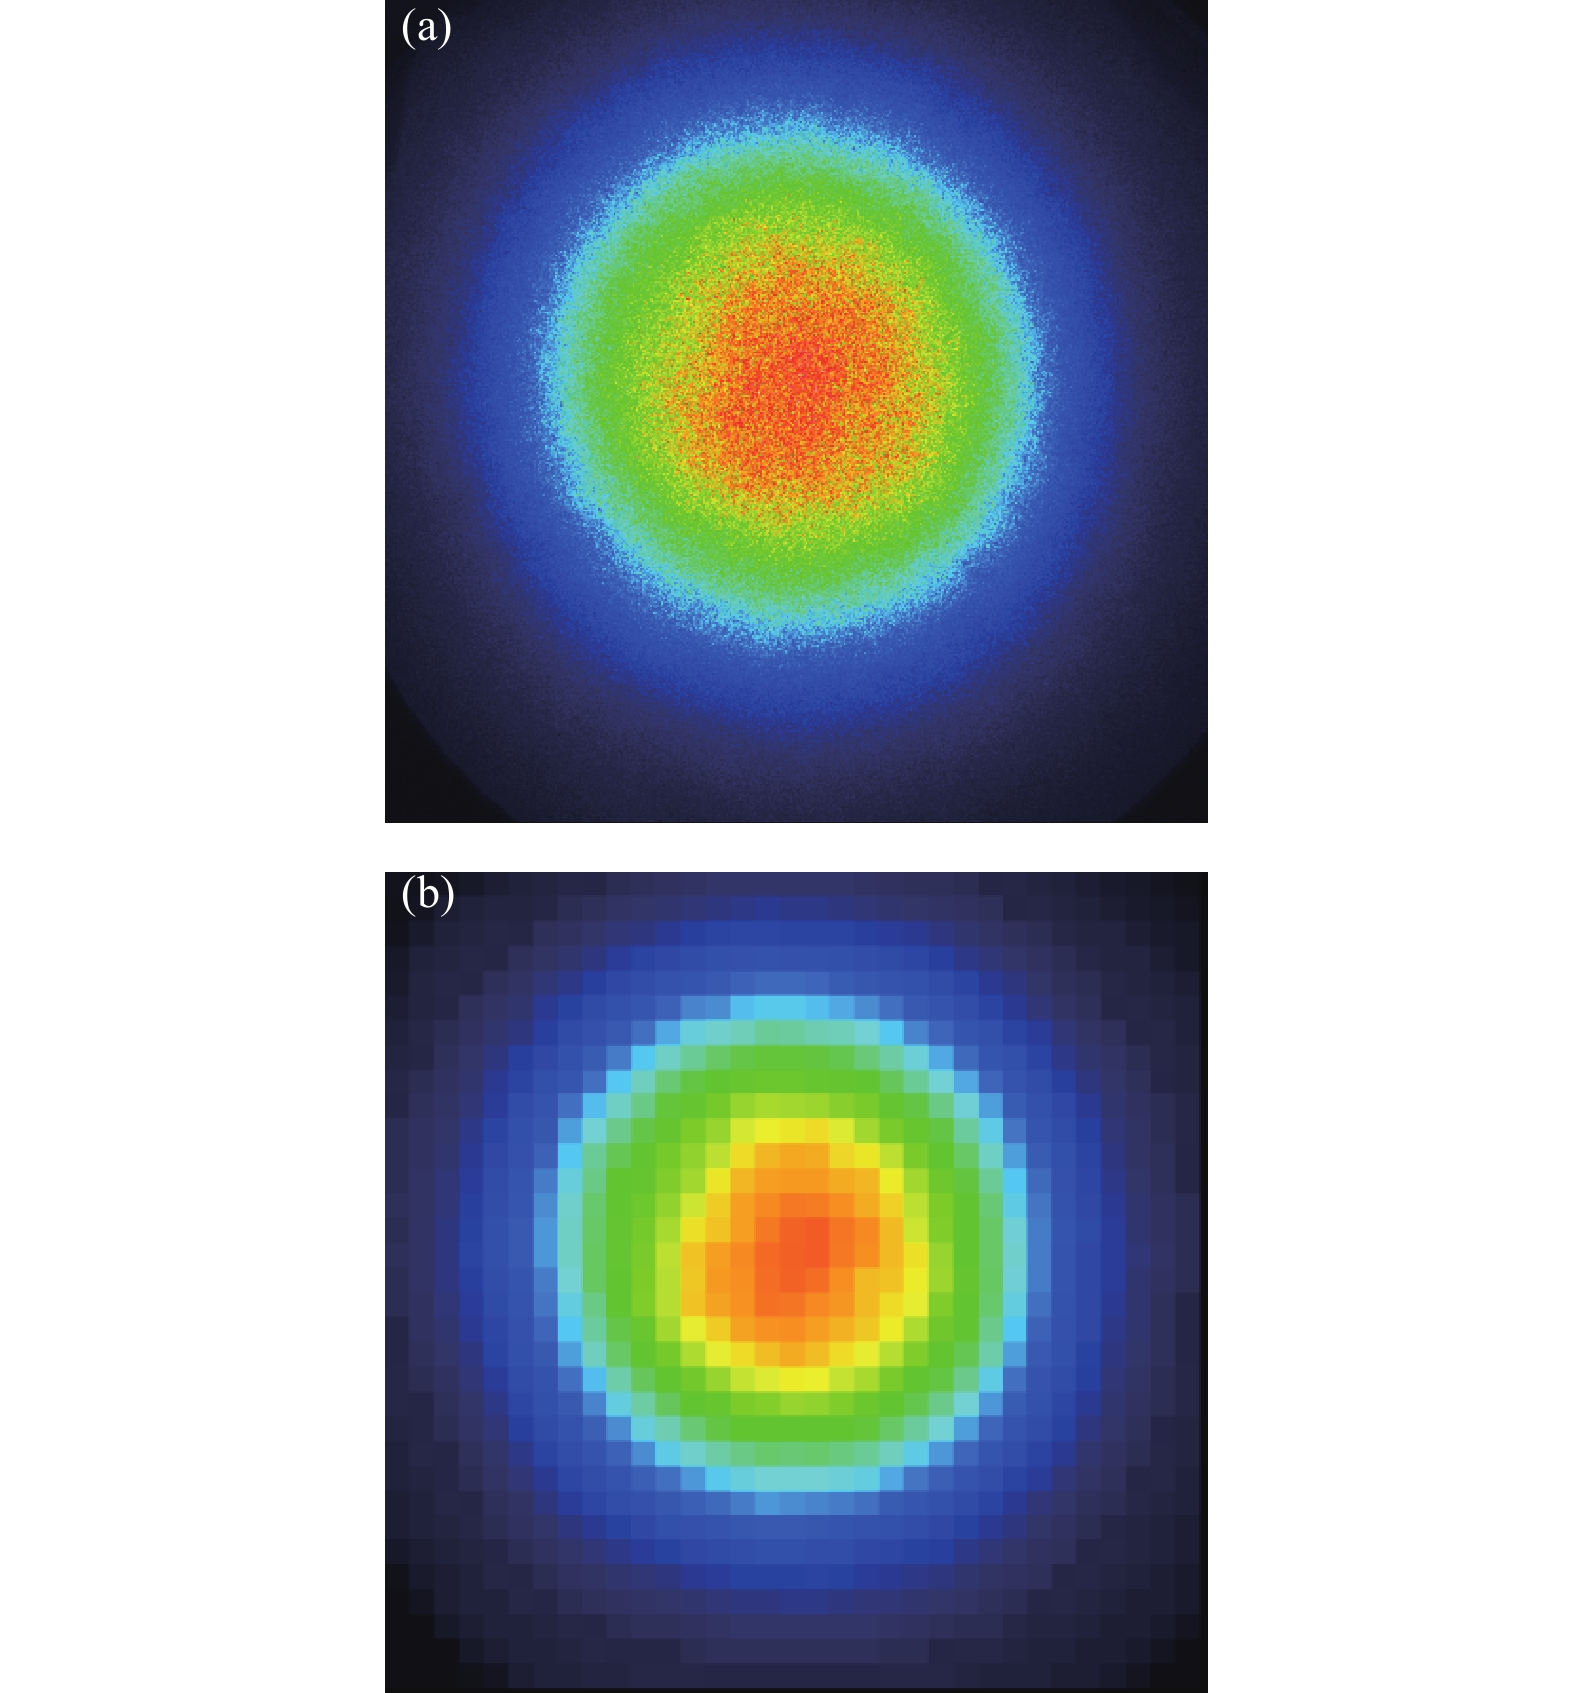
根据透射材料对入射激光散射特性与衰减特性分析,为提高探测器阵列靶测量系统的抗激光损伤能力,选用可以承受激光功率密度10 kW/cm2的石英毛玻璃作为第一取样面。毛玻璃散射特性与其表面颗粒分布及粒径大小等因素相关,透射散射光一般呈高斯状分布,如图2(a)所示,可见,仅使用毛玻璃对入射激光取样的匀化散射作用有限,在毛玻璃后加上工程漫射体,其散射光分布在±20°范围内有一定起伏的类平顶区域,如图2(b)所示,但是工程漫射体由于其材料属性,抗激光损伤能力有限。
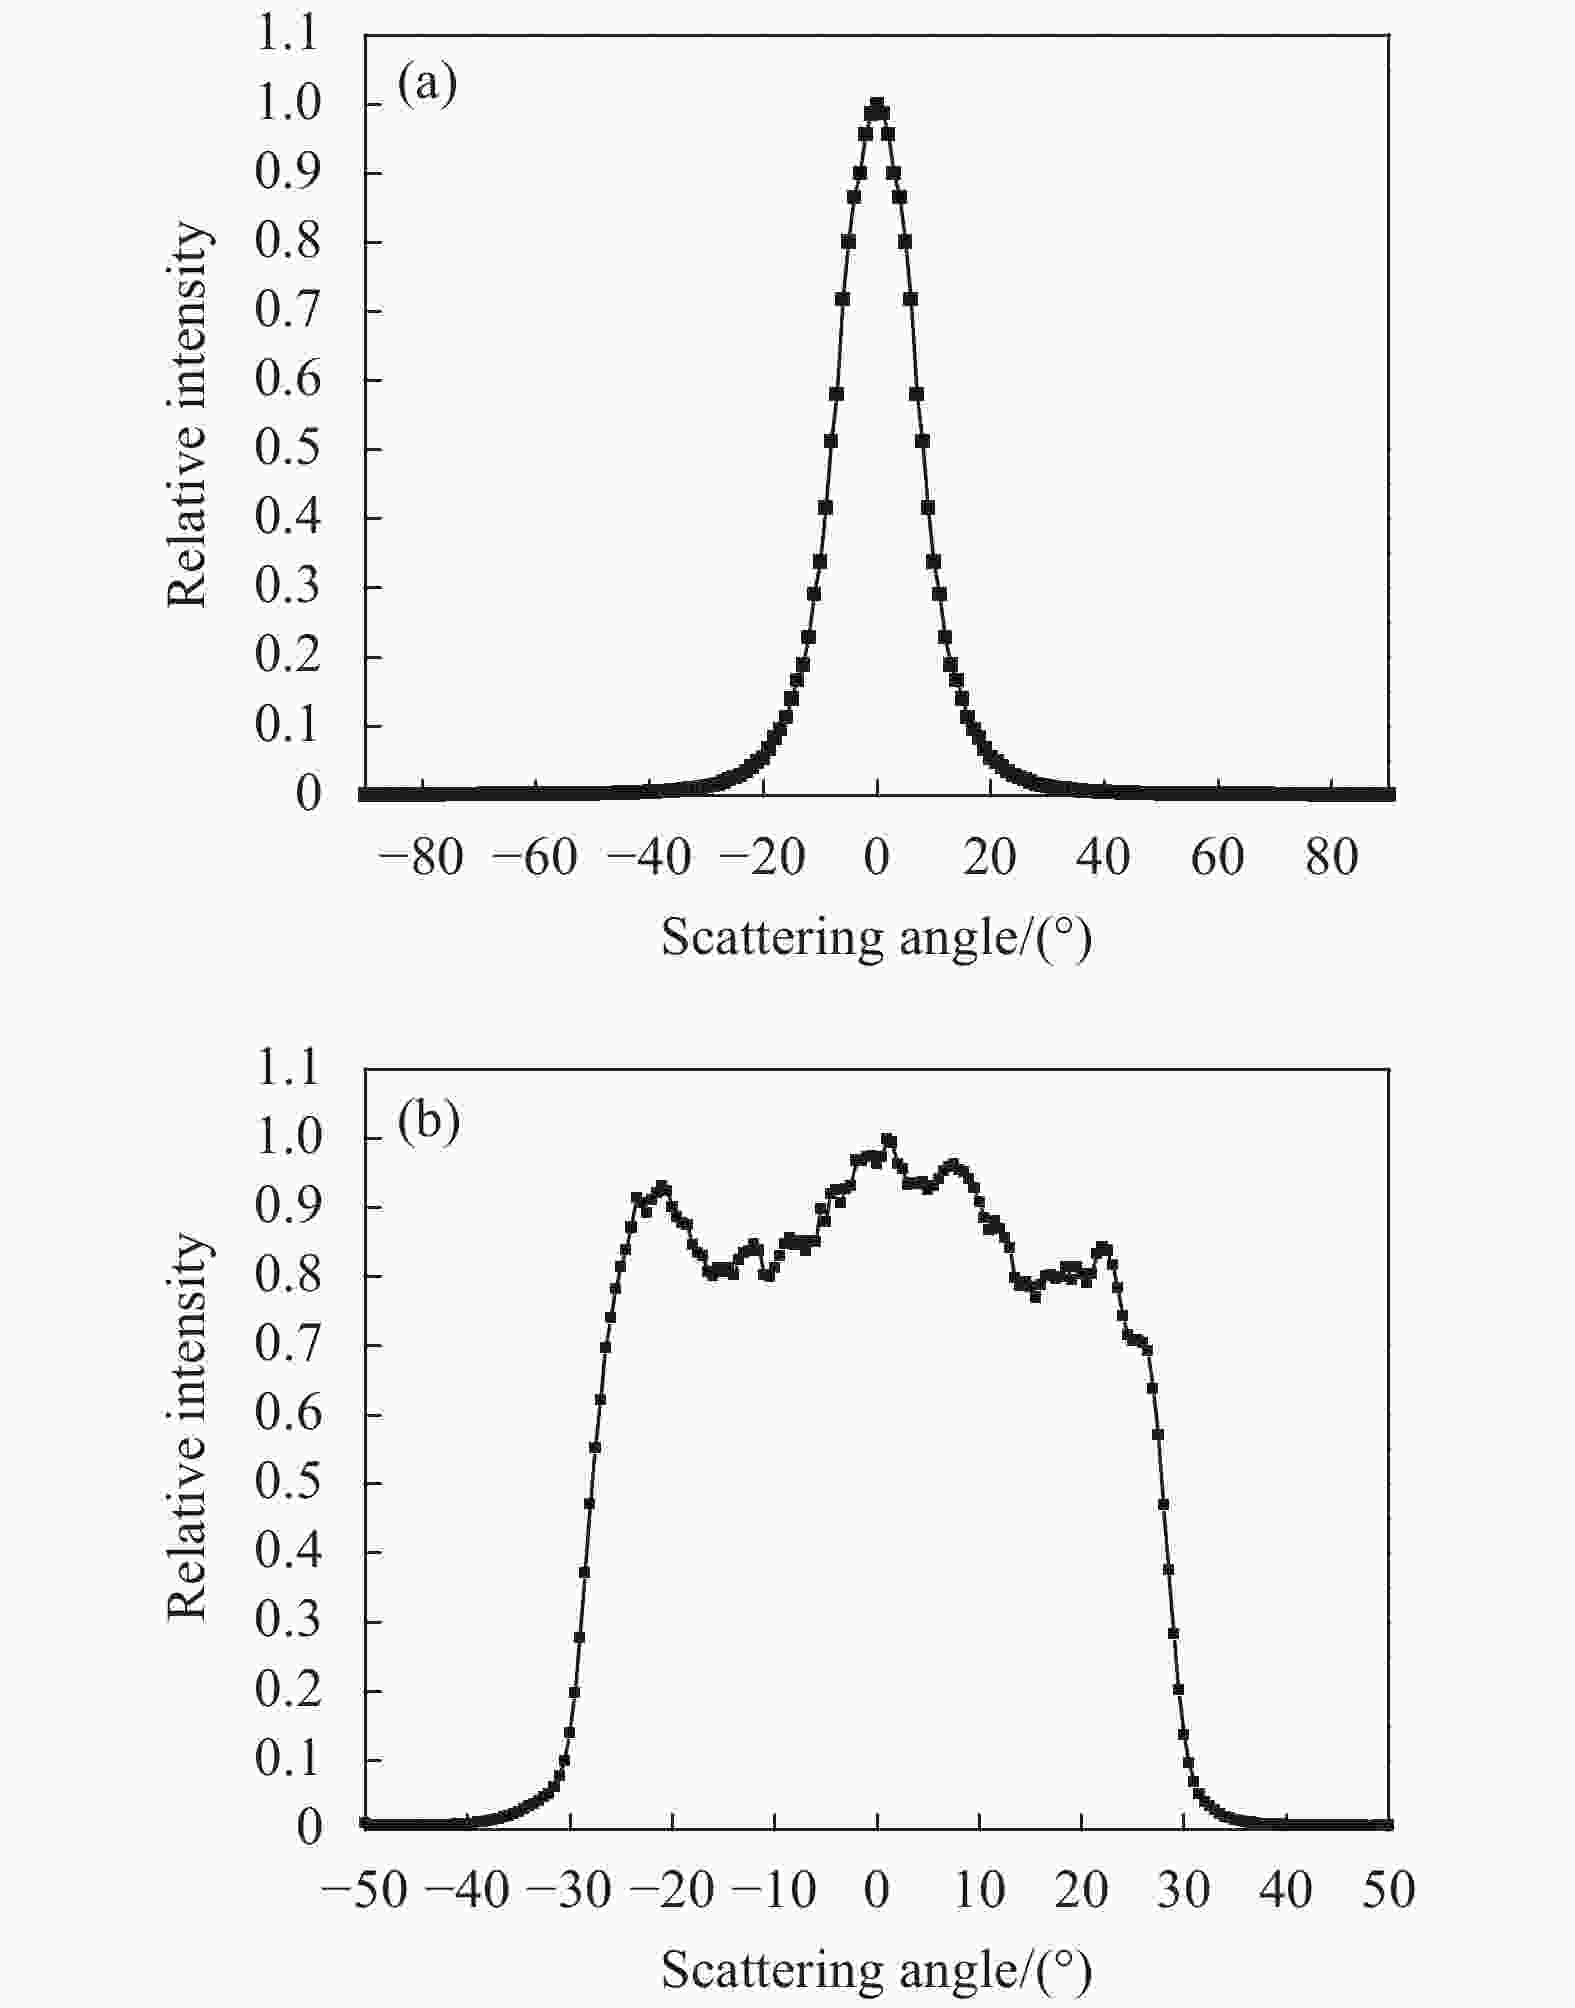
Figure 2. Distribution characteristics of transmission and scattering angle. (a) Ground glass; (b) Engineering diffuser
基于上述对取样材料属性的分析,设计了毛玻璃与工程漫射体组合的散射取样衰减单元,结构设计如图3所示,由毛玻璃、工程漫射体、消光通道、探测单元组成,消光通道用于吸收大角度散射光,防止阵列通道间相互串扰。毛玻璃与工程漫射体具有透射材料的光学特性,组合结构在可见光至中红外较宽光谱范围内都能适用。在常用的近红外测量波段1000~1100 nm,透过率基本不变。

Figure 3. Structure of scattering sampling attenuation unit
采用实验室高功率激光器进行取样衰减材料抗激光损伤测试,出射光功率940 W,聚焦发射,到材料表面功率密度可达2 000 W/cm2。测试单片毛玻璃、工程漫射体材料以及两种材料组合时不同间距的激光损伤情况,实验结果如表1所示,组合间距为d。结果显示:工程漫射体放至毛玻璃后表面1.5 mm处,辐照时长20 s未有实验元件损坏,实际应用中,为了提高集成度,以1.5 mm为设计间隔。
Materials Power density/W·cm−2 Irradiation time/s Damaged condition Ground glass 2 000 20 Undamaged Engineering diffuser 2 000 1 damaged Ground glass + engineering diffuser (d=0.5 mm) 2 000 8 Damaged Ground glass + engineering diffuser (d=1 mm) 2 000 12 Damaged Ground glass + engineering diffuser (d=1.5 mm) 2 000 20 Undamaged Ground glass + engineering diffuser (d=2 mm) 2 000 20 Undamaged Ground glass + engineering diffuser (d=2.5 mm) 2 000 20 Undamaged Table 1. Laser damage test of sampling attenuation materials
-
多片材料组合使用时,若散射距离与接收面积比值系数较小,散射特性及衰减倍率无法由公式直接表达,采用TracePro[13]仿真软件进行蒙特卡洛数值模拟。从材料的透射散射特性理论分析出发,结合ABg散射模型,有:
式中:A为散射率参数;B、g是根据材料散射角分布数据拟合得出的角分布参数;
$ \;{\boldsymbol{{\beta} }}_{0} $ 为直接透射方向的单位向量在材料表面上的投影;$ \;\boldsymbol{{\beta} } $ 为散射方向的单位向量在材料表面的投影。将图2所示的材料散射角分布特性数据拟合,导入仿真软件建立单片材料透射散射数值模拟模型,选用的毛玻璃ABg仿真参数为A=0.01425,B=0.00236,g=3.09868;工程漫射体ABg仿真参数为A=2.1327e-7,B=1.6469e-7,g=20.49387。散射出射角0°~35°的毛玻璃及工程漫射体透射散射光强分布仿真数据与原数据对比如图4所示,由图可得,毛玻璃、工程漫射体散射角度特性原数据与仿真数据相关性系数分别为0.9993、0.97573,结果表明,单片透射材料散射模型仿真散射光分布与原数据具有一致性。
Figure 4. Comparison of the simulation results of the scattering angle characteristics of transmitted materials. (a) Ground glass; (b) Engineering diffuser
基于单片材料散射仿真模型的建立,进一步进行组合取样衰减单元数值模拟,模拟光源是直径为1 mm的均匀光源,根据损伤实验结果,两片材料间距设置为1.5 mm,设置观测面接收X、Y方向相对光强分布,Z方向设置不同散射距离的直径1 mm接收屏,换算成光强衰减倍率,毛玻璃与工程漫射体组合的取样衰减结构透射散射光强三维空间分布见图5(a)~(c),从图中可以看出,出射光斑强度分布在X、Y方向较为对称,在Z方向衰减倍率随散射距离增加而增大。

Figure 5. Three-dimensional spatial distribution of the emitted light from the combined sampling attenuation structure
-
理论仿真模型的可靠性需要通过实验验证,设计相机成像的实验方法对探测器阵列靶单个通道单元入射光散射特性进行研究,实验光路如图6所示,实验激光器中心波长为1064 nm,出射激光束依次垂直经过准直扩束器、口径1 mm光阑、取样材料、成像屏、相机。成像屏选用较薄的、具有较高的透过率、朗伯特性良好的材料,相机采集成像屏上的光斑图像信息,成像屏的位置对应探测器感光面位置。

Figure 6. Experimental optical path diagram of transmission and scattering characteristics of sampling materials
将相机采集图像数据通过网格化处理转换为探测器感光靶面尺度进行分析,方法如下,设实际用探测器靶面直径为d mm,实验测量相机像素标尺为k mm/pixel,圆面积与方形面积比值为
$ \dfrac{\pi }{4} $ ,则单个圆形探测器单元径向覆盖的像素点数a计算如下: 统计以a为边长的网格区域相机响应平均值,选取中心区域网格输出数据作为探测器单元通道响应值
${{I}}_{\mathrm{d}}$ ,计算公式为:式中:
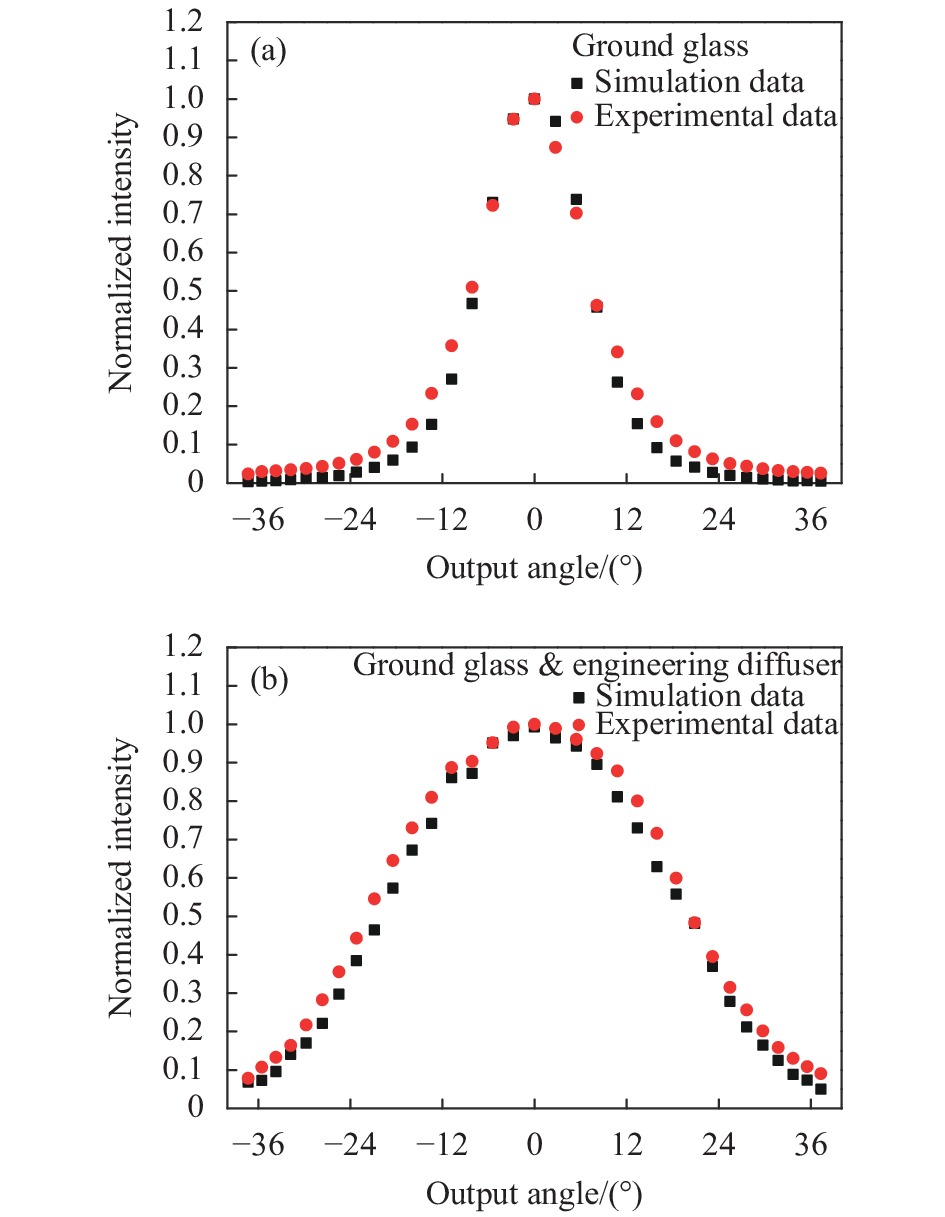
$ {I}_{ij} $ 为第i行第j列像素点相机输出的响应值。实验数据网格化处理如图7所示,由图可得,散射光斑基本呈对称分布,提取中心一列网格化数据表示屏上光斑分布,单片毛玻璃与组合后的仿真实验对比如图8所示,横坐标为屏上光斑径向尺寸与出射距离换算的正切角度值。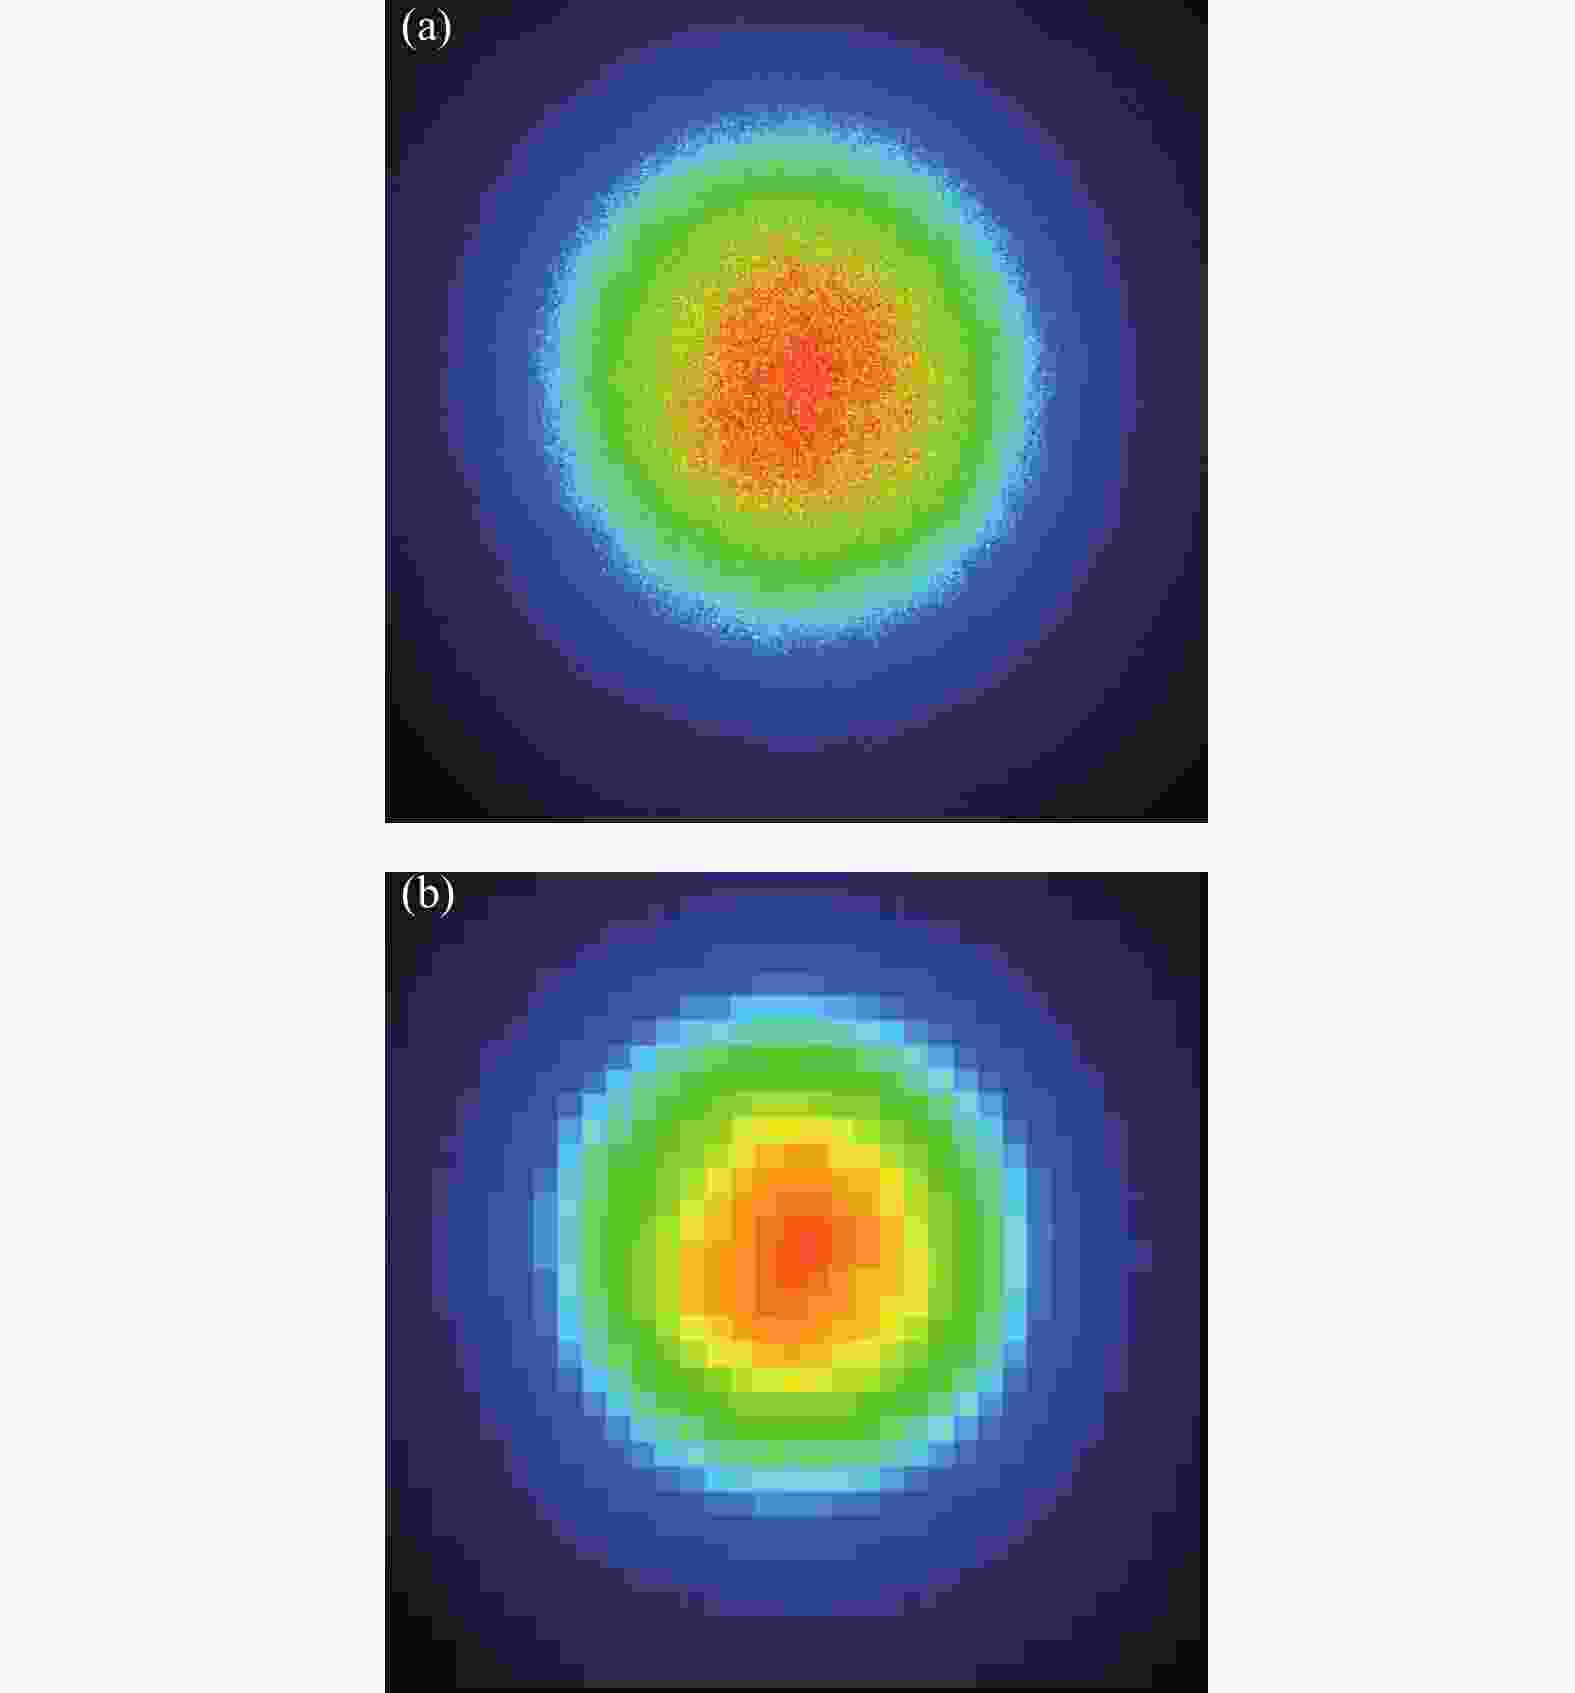
Figure 7. Grid processing of experimental spots. (a) Acquired spot image; (b) Gridded spot image

Figure 8. Comparison of simulation and experiment of transmitted scattered light distribution. (a) Single piece of ground glass; (b) Combin-ation of ground glass and engineering diffuser
单片毛玻璃与组合的仿真实验相关性系数分别为0.99613、0.99781,可见,仿真结果与实验结果相关性高,两者基本吻合。
-
实际应用中,到达探测器感光靶面散射光分布的均匀性越高,对探测器单元在安装过程中的精度要求越低,由此引入的测量误差越小,即可以降低对探测器单元安装精度的要求;到达探测器感光面光斑有较好的均匀性,也能间接说明探测通道具有较好的角度特性;同时单个通道具有较好的精度及角度特性可以有效提升由多个通道组成的探测器阵列的一致性和测量精度。
散射均匀性主要与取样材料散射特性及组合材料间距相关。选取探测平面一定区域内所有网格化输出数据的偏差情况表示散射出射光在探测平面的不均匀性。探测平面中心4 mm区域范围,散射距离21 mm,与正入射激光光轴夹角通过正切关系换算,出射角范围约
$ \pm $ 5.44°,单片毛玻璃的散射不均匀性为0.18872,组合后的散射不均匀性为0.03337,结果表明,组合后的探测面均匀性显著提高,有利于提升探测单元测量精度。 -
通过实验结果验证光强衰减倍率仿真数据的可靠性,相机采集未经任何取样材料直接在屏上所成的图像为入射光斑原始图像,统计图像所有像素点响应值总和作为入射激光功率
${{P}}_{\mathrm{i}\mathrm{n}}$ ,计算公式如下:式中:n为相机采集靶面的所有像素点数。经过散射取样衰减后,统计探测器感光面所覆盖像素点对应的响应值,即为探测器接收到的功率值
${{P}}_{\mathrm{a}\mathrm{c}}$ 计算公式为:实测实验中毛玻璃与工程漫射体位置间隔1.5 mm,探测屏距离毛玻璃第一散射面距离21 mm,入射光斑直径为1 mm,网格化探测器感光面直径也为1 mm,则光强衰减倍率为:
由图5Z向衰减倍率仿真数据得出的光强衰减倍率为592.46,误差约0.805%,仿真实验结果基本一致,表明通过仿真模拟在设计阶段实现光强衰减倍率定量设计是可行的。
实际应用中,探测器阵列靶对各个通道间的一致性要求较高。通过对散射材料衰减特性的理论分析得出衰减倍率与散射距离平方成正比,散射距离的误差主要与取样衰减材料安装支撑件的加工精度和安装精度相关,现有的加工精度可以保证公差在十微米级。对于文中的系统,Z方向的误差区间为(21±0.05) mm,阵列通道间由加工与安装引起的初始误差可以通过衰减倍率整体标定来校正,以提升各个通道间衰减的一致性。
-
实际应用中,需要对取样衰减结构进行入射激光光强响应线性度测试,按照图6所示的实验光路,通过调节入射光强度,得到相应的探测单元响应值。图9为不同激光功率密度辐照时,毛玻璃与工程漫射体组合的散射取样衰减单元输出响应值线性度测量数据与拟合直线,纵坐标为输出相对强度,由图可得,所设计的散射取样衰减结构响应输出值非线性约为0.86%。
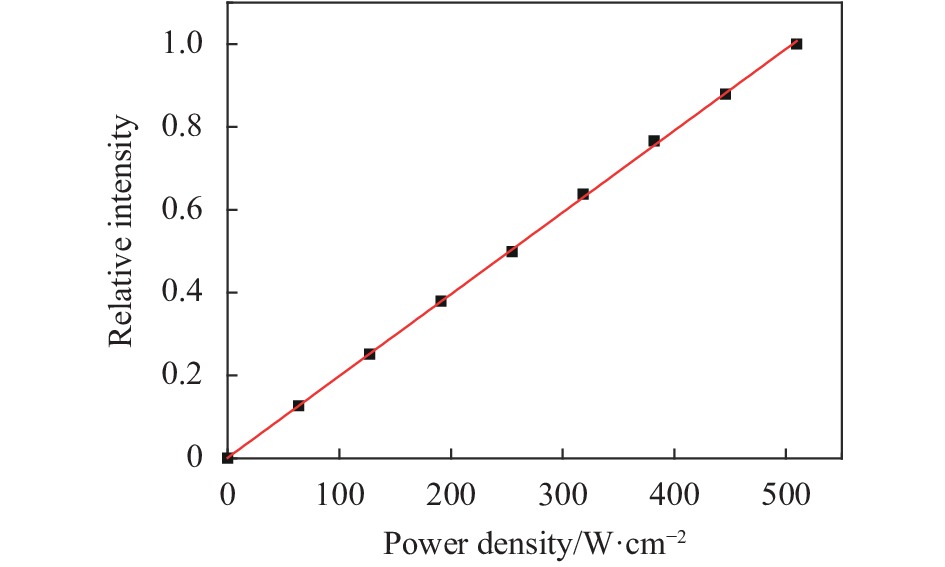
Figure 9. Response linearity of combined scattering sampling attenuation structure
-
针对用于高功率密度激光参数测量的探测器阵列靶散射取样衰减单元设计,对入射激光透射散射特性进行理论分析、数值模拟及实验研究。推导了到探测器感光面激光强度衰减倍率的计算公式,建立了透射材料散射特性的仿真模型,设计了抗激光损伤能力强的石英毛玻璃与散射特性良好的工程漫射体组合的散射取样衰减结构。结果表明,设计的取样衰减结构可以承受入射激光功率密度2 000 W/cm2,辐照时间20 s;散射出射角
$ \pm $ 5.44°范围内,探测面不均匀性约为3.34%;探测面激光强度衰减倍率仿真数据与实验结果误差约为0.805%。综上所述,该种透射散射取样衰减方式具有宽光谱测量、抗激光损伤能力强、测量精度高、光强衰减倍率可定量设计、测量响应线性度良好等优点,具有很好的工程应用价值。
Design of scattering sampling attenuation unit for detector array target
doi: 10.3788/IRLA20210150
- Received Date: 2021-03-10
- Rev Recd Date: 2021-06-01
- Available Online: 2022-01-06
- Publish Date: 2021-12-31
-
Key words:
- detector array target /
- power density /
- sampling attenuation /
- bidirectional transmission distribution function
Abstract: The detector array target is a common equipment for measuring the spatial and temporal distribution of laser intensity. In order to achieve high-precision measurement of target laser parameters, the sampling attenuation method is its key point. Aiming at scattering sampling attenuation technology for detector array target, based on the bidirectional transmission distribution function, the transmission and scattering characteristics of ground glass and other materials were studied. And the calculation formula of the laser intensity attenuation magnification which was scattered to the photosensitive surface of the detector was deduced. The scattering sampling attenuation unit combined with ground glass and engineering diffuser was designed. Combined with the ABg scattering model, the simulation model of scattering sampling attenuation materials were established by TracePro software. The results show that the designed sampling attenuation structure is able to withstand the power density of 2 000 W/cm2 laser irradiation for 20 s; within the scattering emission angle of ±5.44°, the sampling unevenness of the detection surface is about 3.34%; the attenuation magnification simulation design result and experimental measurement error is about 0.805%. The scattering sampling attenuation method has the advantages of strong resistance to laser damage, better spot homogenization effect, quantitative attenuation of laser intensity and broad spectral response. This manner has a good application prospect.


 DownLoad: