Volume 51 Issue 4
May  2022
Turn off MathJax
Article Contents

Zhou Hao, Mao Qingzhou, Li Qingquan. Influence of sampling frequency and laser pulse width on ranging accuracy of full-waveform LiDAR[J]. Infrared and Laser Engineering, 2022, 51(4): 20210363. doi: 10.3788/IRLA20210363
Citation: Zhou Hao, Mao Qingzhou, Li Qingquan. Influence of sampling frequency and laser pulse width on ranging accuracy of full-waveform LiDAR[J]. Infrared and Laser Engineering, 2022, 51(4): 20210363. doi: 10.3788/IRLA20210363

Influence of sampling frequency and laser pulse width on ranging accuracy of full-waveform LiDAR

doi: 10.3788/IRLA20210363
Funds:  National Natural Science Foundation of China (41971413, U1934215)
  • Received Date: 2021-06-01
  • Rev Recd Date: 2021-07-18
  • Publish Date: 2022-05-06
  • The ranging accuracy of full-waveform LiDAR, also known as ranging repetition accuracy or ranging standard deviation, is affected by laser output light stability, laser pulse width, detector response time jitter, circuit noise, waveform shape, waveform sampling frequency, waveform processing algorithm and so on. The effects of different sampling frequencies and pulse widths of full-waveform LiDAR on ranging accuracy were analyzed theoretically. The waveform data under different sampling frequency (1.25, 2.5, 5 GHz) and pulse width (1, 2, 3,···, 10 ns) were collected and preprocessed by filtering, interpolation and waveform extraction. Linear Gaussian fitting, weighted linear Gaussian fitting, iterative weighted linear Gaussian fitting, expectation maximization algorithm and Levenberg Marquardt algorithm were used to calculate the ranging value and the ranging accuracy. The experimental results show that the ranging accuracy obtained by EM algorithm is least affected by waveform distortion compared with the other four algorithms, and that the ranging accuracy obtained by weighted linear Gaussian fitting algorithm is least affected by the change of sampling frequency. Under the condition of the same waveform amplitude, the actual pulse width increases 2.47 times, and the ranging accuracy obtained by EM algorithm is reduced from 0.97 mm to 1.18 mm, so increasing the pulse width will reduce the ranging accuracy. When the optical pulse width is 4 ns, the ranging accuracy of 5 GHz sampling frequency data obtained by EM algorithm is 1.71 and 3.07 times of that of 2.5 GHz and 1.25 GHz sampling frequency data, respectively, while when 2.5 GHz and 1.25 GHz data are interpolated 2 times and 4 times to 5 GHz, they are only 1.17 times and 1.29 times, so increasing the sampling frequency can improve the ranging accuracy. On the other hand, the ranging accuracy close to the high sampling frequency data can be obtained by interpolating the low sampling frequency data.
  • [1] Li Qingquan, Mao Qingzhou. Progress on dynamic and precise engineering surveying for pavement and track [J]. Acta Geodaetica et Cartographica Sinica, 2017, 46(10): 1734-1741. (in Chinese) doi:  10.11947/j.AGCS.2017.20170323
    [2] Xu Xianze, Weng Mingjie, Xu Fengqiu, et al. Phase laser ranger based on quadrature modem and frequency reduction [J]. Optics and Precision Engineering, 2017, 25(8): 1979-1986. (in Chinese) doi:  10.3788/OPE.20172508.1979
    [3] Qu Xinghua, Zhi Guangtao, Zhang Fumin, et al. Improvement of resolution of frequency modulated continuous wave laser ranging system by signal splicing [J]. Optics and Precision Engineering, 2015, 23(1): 40-47. (in Chinese) doi:  10.3788/OPE.20152301.0040
    [4] Li Xiaolu, Zeng Jingjing, Wang Hao, et al. Design and real-time imaging technology of three-dimensional scanning LiDAR [J]. Infrared and Laser Engineering, 2019, 48(5): 0503004. (in Chinese) doi:  10.3788/IRLA201948.0503004
    [5] Kurtti S, Nissinen J, Kostamovaara J. A wide dynamic range CMOS laser radar receiver with a time-domain walk error compensation scheme [J]. IEEE Transactions on Circuits and Systems I: Regular Papers, 2017, 64(3): 550-561. doi:  10.1109/TCSI.2016.2619762
    [6] Li X, Yang B, Xie X, et al. Influence of waveform characteristics on LiDAR ranging accuracy and precision [J]. Sensors, 2018, 18(4): 1156. doi:  10.3390/s18041156
    [7] Jardan D M, Naikoa A, David J M, et al. Analysis of waveform lidardata using shape-based metrics [J]. IEEE Geoscience and Remote Sensing Letters, 2013, 10(1): 106-110. doi:  10.1109/LGRS.2012.2194472
    [8] Bai Yang, Tang Wei, Xu Shiyue, et al. Real-time and high-precision ranging method for large dynamic range of imaging lidar [J]. Infrared and Laser Engineering, 2020, 49(S2): 20200179. (in Chinese)
    [9] Caruana R A, Searle R B, Heller T, et al. Fast algorithm for the resolution of spectra [J]. Analytical Chemistry (Washington), 1986, 58(6): 1162-1167. doi:  10.1021/ac00297a041
    [10] Guo Hongwei. A simple algorithm for fitting a gaussianfunction [J]. IEEE Signal Processing Magazine, 2011, 28(5): 134-137. doi:  10.1109/MSP.2011.941846
    [11] Soederman U, Persson A, Toepel J, et al. On analysis and visualization of full-waveform airborne laser scanner data[C]//SPIE, 2005, 5791: 184 – 192.
    [12] Wang Binhui, Song Shalei, Gong Wei, et al. Optimization decomposition method of full-waveform LiDAR [J]. Acta Geodaetica et Cartographica Sinica, 2017, 46(11): 1859-1867. (in Chinese) doi:  10.11947/j.AGCS.2017.20170045
    [13] Li D, Xu L, Xie X, et al. Co-path full-waveform LiDAR for detection of multiple along-path objects [J]. Optics and Lasers in Engineering, 2018, 111: 211-221. doi:  10.1016/j.optlaseng.2018.08.009
    [14] Hartzell P J, Glennie C L, Finnegan D C. Empirical waveform decomposition and radiometric calibration of a terrestrial full-waveform laser scanner [J]. IEEE Transactions on Geoscience and Remote Sensing, 2015, 53(1): 162-172. doi:  10.1109/TGRS.2014.2320134
    [15] Wang Xiankun, Yang Fanlin, Zhang Hande, et al. An algorithm of airborne LiDAR bathymetric waveform simulation based on generalized Gaussian model [J]. Journal of Geodesy and Geodynamics, 2018, 38(11): 1180-1185. (in Chinese)
    [16] Liu Rujun, Ma Cheng, Shi Wei, et al. Study on time jitter and trigger synchronization characteristics of ns pulsed laser diode [J]. Infrared and Laser Engineering, 2020, 49(6): 20200147. (in Chinese) doi:  10.3788/IRLA20200147
    [17] Liu Rongrong, Mao Qingzhou. Amplitude and phase error correction method for full-waveform light detection and ranging [J]. Optical Instruments, 2019, 41(3): 27-34. (in Chinese)
  • 加载中
通讯作者: 陈斌, bchen63@163.com
  • 1. 

    沈阳化工大学材料科学与工程学院 沈阳 110142

  1. 本站搜索
  2. 百度学术搜索
  3. 万方数据库搜索
  4. CNKI搜索

Figures(3)  / Tables(2)

Article Metrics

Article views(513) PDF downloads(71) Cited by()

Related
Proportional views

Influence of sampling frequency and laser pulse width on ranging accuracy of full-waveform LiDAR

doi: 10.3788/IRLA20210363
  • 1. School of Remote Sensing and Information Engineering, Wuhan University, Wuhan 430079, China
  • 2. MNR Key Laboratory for Geo-Environmental Monitoring of Great Bay Area, Shenzhen University, Shenzhen 518060, China
Fund Project:  National Natural Science Foundation of China (41971413, U1934215)

Abstract: The ranging accuracy of full-waveform LiDAR, also known as ranging repetition accuracy or ranging standard deviation, is affected by laser output light stability, laser pulse width, detector response time jitter, circuit noise, waveform shape, waveform sampling frequency, waveform processing algorithm and so on. The effects of different sampling frequencies and pulse widths of full-waveform LiDAR on ranging accuracy were analyzed theoretically. The waveform data under different sampling frequency (1.25, 2.5, 5 GHz) and pulse width (1, 2, 3,···, 10 ns) were collected and preprocessed by filtering, interpolation and waveform extraction. Linear Gaussian fitting, weighted linear Gaussian fitting, iterative weighted linear Gaussian fitting, expectation maximization algorithm and Levenberg Marquardt algorithm were used to calculate the ranging value and the ranging accuracy. The experimental results show that the ranging accuracy obtained by EM algorithm is least affected by waveform distortion compared with the other four algorithms, and that the ranging accuracy obtained by weighted linear Gaussian fitting algorithm is least affected by the change of sampling frequency. Under the condition of the same waveform amplitude, the actual pulse width increases 2.47 times, and the ranging accuracy obtained by EM algorithm is reduced from 0.97 mm to 1.18 mm, so increasing the pulse width will reduce the ranging accuracy. When the optical pulse width is 4 ns, the ranging accuracy of 5 GHz sampling frequency data obtained by EM algorithm is 1.71 and 3.07 times of that of 2.5 GHz and 1.25 GHz sampling frequency data, respectively, while when 2.5 GHz and 1.25 GHz data are interpolated 2 times and 4 times to 5 GHz, they are only 1.17 times and 1.29 times, so increasing the sampling frequency can improve the ranging accuracy. On the other hand, the ranging accuracy close to the high sampling frequency data can be obtained by interpolating the low sampling frequency data.

  • 激光雷达(Light Detection and Ranging, LiDAR)是一种广泛应用于测绘、目标检测、轨道检测、导航等领域的新兴技术[1]。常见的激光雷达测距方法可分为三角法、直接飞行时间法(direct Time of Flight, dTOF)和间接飞行时间法(indirect Time of Flight, iTOF)。dTOF法又称脉冲飞行时间法,其探测距离较远但测距精度较低,iTOF法主要有调幅连续波[2] (AmplitudeModulated Continuous Wave, AMCW)和调频连续波[3] (Frequency Modulated Continuous Wave, FMCW),其测距精度较高,但工作距离较近,且存在多值解的问题。dTOF激光雷达一般基于时间差测量的方法,主要有脉冲计数法、时间拓展法、基于时间数字转换器(Time-to-Digital Converter, TDC)的时刻鉴别法和基于模数转换器(Analog to Digital Converter, ADC)的波形数字化的方法。前3种方法本质上都是产生较高的时间分辨率,测距精度主要由时间分辨率大小决定,一般在分米级到亚厘米级[4],且在用于大动态范围探测时,回波波形幅度变化大,时刻鉴别阈值的存在会产生较大的测距误差,因此需要进行校正[5]。基于波形数字化的方法能够获得波形的幅值、相位等波形信息,并能够利用较复杂的算法获得更高的时间分辨率,理论上精度更高[6]

    基于波形数字化的处理算法主要有波形形心法[7]、模板匹配法[8]、高斯拟合法和反卷积法等。高斯拟合法包括线性高斯拟合法[9] (Linear Gaussian Fitting, LGF),以及在此基础上优化的加权线性高斯拟合法(Weighted Linear Gaussian Fitting, WLGF)以及迭代加权线性高斯拟合法[10] (Iterative Weighted Linear Gaussian Fitting, IWLGF),但这3种方法都只能拟合单个波形,无法分解重叠波形。对重叠波形的分解算法主要有期望最大化(Expectation Maximation, EM)算法[11]和Levenberg Marquardt (LM)算法[12]等。

    全波形激光雷达测距精度受激光器出光稳定性、激光脉宽、探测器响应时间抖动、电路噪声、波形形态、波形采样频率和波形处理算法等因素影响。文中通过理论分析推导出采样频率和激光脉宽对测距精度的影响,并通过实验设置不同的采样频率及激光脉冲宽度,利用不同算法计算测距精度,由此分析和验证采样频率和激光脉冲宽度对测距精度的影响。

    • 全波形激光雷达使用了高采样率的ADC芯片,能够得到数字化后的参考光波形及回波波形,从而使得能够通过数字信号处理的方法得到参考光及回波的时间差,若计算出的参考光的时间坐标为$ {\mu }_{1} $,回波的时间坐标为$ {\mu }_{2} $,即可计算激光雷达与目标之间的距离$ d $$ d $的表达式为:

      式中:$ c $为光在空气中的传播速度;$ {F}_{s} $为ADC采样频率。

    • 脉冲式激光雷达参考光波形和回波波形可近似为高斯波形[13],表达式为:

      式中:${y}$为波形采样点幅值;$ x $为采样点横坐标;${A}\rm{、}\mu \rm{、}\rm{\sigma }$为高斯函数参数,$ \mu $为中心点横坐标。

      真实波形由于激光器、电路接收放大、目标物特性等影响,会产生一定形变,使得其不再是高斯波形,因此也有学者使用卷积模型[14]和广义高斯模型[15]描述波形。

    • 波形预处理主要包括波形滤波、插值和波形提取。

      波形在采集过程中由于多方面原因会产生背景噪声,文中使用FIR (Finite Impulse Response)滤波器对波形进行平滑去噪,其对波形形态影响小,且易于在硬件平台如FPGA中实现。

      插值,常用的方法有牛顿插值、拉格朗日插值、三次样条插值和CIC插值滤波等。文中使用的CIC插值滤波由于其特殊的形式,易于在FPGA中实现,且能进行任意倍的插值。

      根据非有效波形区域的波形数据获得背景噪声的期望$ {\mu }_{noise} $和标准差$ {\sigma }_{noise} $,并设置阈值$ {th}_{noise} $用以提取有效波形[12]

    • 线性高斯拟合法[9]的原理是对高斯模型进行对数化:

      ${\rm{ln}}\;y={\textit{z}}$,将获得的n个波形数据写成矩阵形式有:

      记为:

      可以利用最小二乘原理得到$ \boldsymbol{B} $的值,即:

      进而获得波形中心点坐标:

      加权线性高斯拟合法[10]分析了LGF法的噪声影响,并根据噪声影响特点使用了加权最小二乘法:

      式中:

      通过加权,减小了信噪比较低部分的噪声带来的影响,从而提高拟合精度。

      由于WLGF法中权重是以测量值代替真值进行计算,在信噪比极低的情况下,权重将出现错误,因此迭代加权线性高斯拟合法[10]通过迭代计算估计值,并通过估计值重新分配权重,以此实现对权重计算和对高斯曲线的拟合。

      EM算法将波形幅值和时间作为概率密度函数,通过E步骤和M步骤不断迭代分解,获得所设定模型的各个参数。LM算法将模型参数求解的非线性过程线性化,并利用最小二乘法不断迭代,最终获得模型与真实波形的残差平方和最小的模型参数。

    • 由测距原理可知测距精度与参考光和回波之间的时间差的抖动直接相关,而参考光和回波之间的时间差抖动会受到许多因素影响,文中将这些因素主要分为两类误差:第一类误差为波形的时间抖动误差,主要表现为多个重复波形在时间轴上存在抖动;第二类误差为波形幅值信号的误差,主要表现为单个波形在不同算法或信噪比下计算出的时刻不同。总的时间误差可认为是:

      式中:$ {\sigma }_{1}^{2} $为第一类误差;$ {\sigma }_{2}^{2} $为第二类误差。

    • 第一类误差主要与器件和环境造成的时间抖动有关,其即使在波形信噪比无穷大的情况下,不同的参考光和回波时间差仍有一定变化。其主要有:

      (1) 激光器的时间抖动:包括触发信号与出射光之间的时间抖动[16]以及参考光和出射光之间的时间抖动;

      (2) 光电探测器的响应时间抖动:指在反射光到达探测器时产生光电流的响应时间的不确定性;

      (3) 大气折射误差:由空气不均匀引起的光线折射,导致光传播路径的抖动。

      第一类误差在激光雷达系统确定好后便也随之确定,要减小第一类误差对测距精度的影响可以对多个回波进行累加平均或者更换时间抖动更小的器件,而前者不适用于扫描式激光雷达。

    • 第二类误差主要由器件和环境造成的噪声误差,其影响波形的形态以及信噪比,因此利用不同算法对同一波形进行处理时,计算出的时刻将会不同。其主要有:

      (1)背景噪声:主要由测量环境的背景光引起的噪声;

      (2)探测器噪声:包括热噪声、散粒噪声、产生-复合噪声、1/f噪声和温度噪声等;

      (3)暗电流噪声:APD探测器的PN结在没有入射光时,仍存在的反向电流噪声;

      (4)量化误差:ADC对模拟信号进行量化引起的误差;

      (5) ADC失配误差:由于文中所使用的是4通道1.25 GHz采样频率的ADC芯片,在进行2.5 GHz及5 GHz的采样时,需要将多个通道数据进行组合,由不同通道间的偏置、增益、相位参数的不同造成的误差被称为ADC失配误差。

    • 一般而言,受第二类误差的影响,波形幅值的测量值可认为是真实值与噪声的叠加,噪声满足高斯分布,即:

      式中:$ y\left[n\right] $为波形第$ n $个点的测量值;$ r\left[n\right] $为波形第$ n $个点的真实值;$ w\left[n\right]~N(0,{\sigma }_{noise}^{2}) $为高斯白噪声。

      以EM算法为例,其将计算出的高斯波形参数$\; \mu $作为波形时刻,在不涉及多波形叠加时,EM算法无需迭代,其波形时刻计算公式为:

      即:

      式中:N为波形点的总个数。由于直接对$\; \mu $求期望和方差将会涉及到$ w\left[n\right] $作为分母的期望求解,其在定义域并不连续,因此无法获得数学上的显式解。为此,将公式(15)化为:

      在信噪比较高的情况下,$\frac{\displaystyle\sum _{n=1}^{N}w\left[n\right]}{\displaystyle\sum _{n=1}^{N}r\left[n\right]}$接近于0,因此可将$\; \mu $近似为:

      则:

      因此可以得到$\; \widehat{\mu } $的方差$ D\left(\widehat{\mu }\right) $

      换算为时间单位有:

      由公式(20)可以得到以下规律:

      (1)当采样频率不变,波形脉宽提高R倍,即$ {F}_{s} $不变,采样点数N提高R倍,则计算出的时刻$ {t}_{W} $的方差$ D\left({t}_{W}\right) $R的关系为:

      即当采样频率不变时,减小波形脉宽能降低计算出的时刻的方差,从而提高测距精度。

      除此以外,在减小波形脉宽时,需要考虑到采样频率是否满足奈奎斯特采样定理。

      (2)当波形脉宽不变,采样频率提高R倍,即$ {F}_{s} $提高R倍,采样点数N也提高R倍,则计算出的时刻$ {t}_{F} $的方差$ D\left({t}_{F}\right) $R的关系为:

      即当波形脉宽不变时,提高采样频率能降低计算出的时刻的方差,从而提高测距精度

      (3)当波形脉宽和采样频率保持不变时,若波形幅值降低,同样会使得计算出的时刻的方差变大,从而降低测距精度。

      (4)尽管EM算法也是假设波形符合高斯模型,但对于单回波而言,EM算法本质上是将波形作为概率密度函数并最终求出期望作为波形时刻,因此在波形不满足高斯模型的情况下,以上结论仍然成立。

    • 文中使用数据来自一套自研全波形激光雷达系统:激光波长为1550 nm,光脉宽为1~10 ns可调;参考光和回波分别使用InGaAs的PIN光电二极管和APD接收,整形放大电路带宽约为350 MHz;ADC芯片采用4通道采样,单通道最高采样频率为1.25 GHz,多通道可进行交织融合获得2.5 GHz和5 GHz的采样频率,采样位数为10 bit。

      文中通过调节光脉宽(1,2,3,···,10 ns)和改变ADC采样频率(1.25, 2.5, 5 GHz)获得共30组数据,每组数据包括1000个波形数据,并分别使用LGF、WLGF、IWLGF、EM和LM算法对参考光和回波求取中心值,获得测距值及其标准差$ {\rm{\sigma }}_{i} $,IWLGF、EM、LM的迭代收敛条件为中心值$ \;\mu $的改正量小于10−3,单位为两相邻采样点对应的时间间隔。

      实验将尽量保证不同条件下回波幅值大致相等,信噪比大于30 dB,在5 GHz采样频率下采集的数据各参数的平均值如表1所示。其中波形脉宽指高于阈值的波形数据个数,根据采样频率换算成时间单位的宽度。半峰全宽(Full Width at Half Maxima, FWHM)的计算公式为:

      Optical pulse
      width/ns
      Amplitude of reference
      light/mV
      Pulse width of
      reference light/ns
      FWHM of reference
      light/ns
      Amplitude of
      the echo/mV
      Pulse width
      of echo/ns
      FWHM
      of echo/ns
      161.153.711.82157.383.041.42
      2125.784.382.06170.693.811.81
      3163.995.122.42177.854.62.29
      4175.876.042.92179.725.492.84
      5175.617.193.57174.546.473.48
      6175.998.284.31177.157.54.18
      7175.969.134.96177.578.44.83
      8175.9410.315.82175.029.635.70
      9176.1510.926.26176.0610.256.14
      10177.1012.057.03175.1411.356.89

      Table 1.  Data average parameters under 5 GHz sampling frequency

      式中:$ {\sigma }_{w} $为波形数据经EM算法计算获得。

      之所以将波形脉宽和FWHM一起计算,是因为其比值一定程度上能够反映波形的畸变程度,其比值越偏离2,则畸变越严重。图1所示为5 GHz采样频率下获得的参考光波形,激光器随着激光脉宽的增加,波形畸变程度增加,因此参考光和回波与高斯波形差异也逐渐增大。畸变的波形会被传统基于高斯模型的波形分解算法判定为多回波,从而错误获得与实际情况不符的测距值,对于畸变波形重叠的波形分解算法,还有待进一步的研究。此外,由于电路带宽的限制,随着激光脉宽的减小,参考光幅值会衰减,波形会有一定程度的展宽。

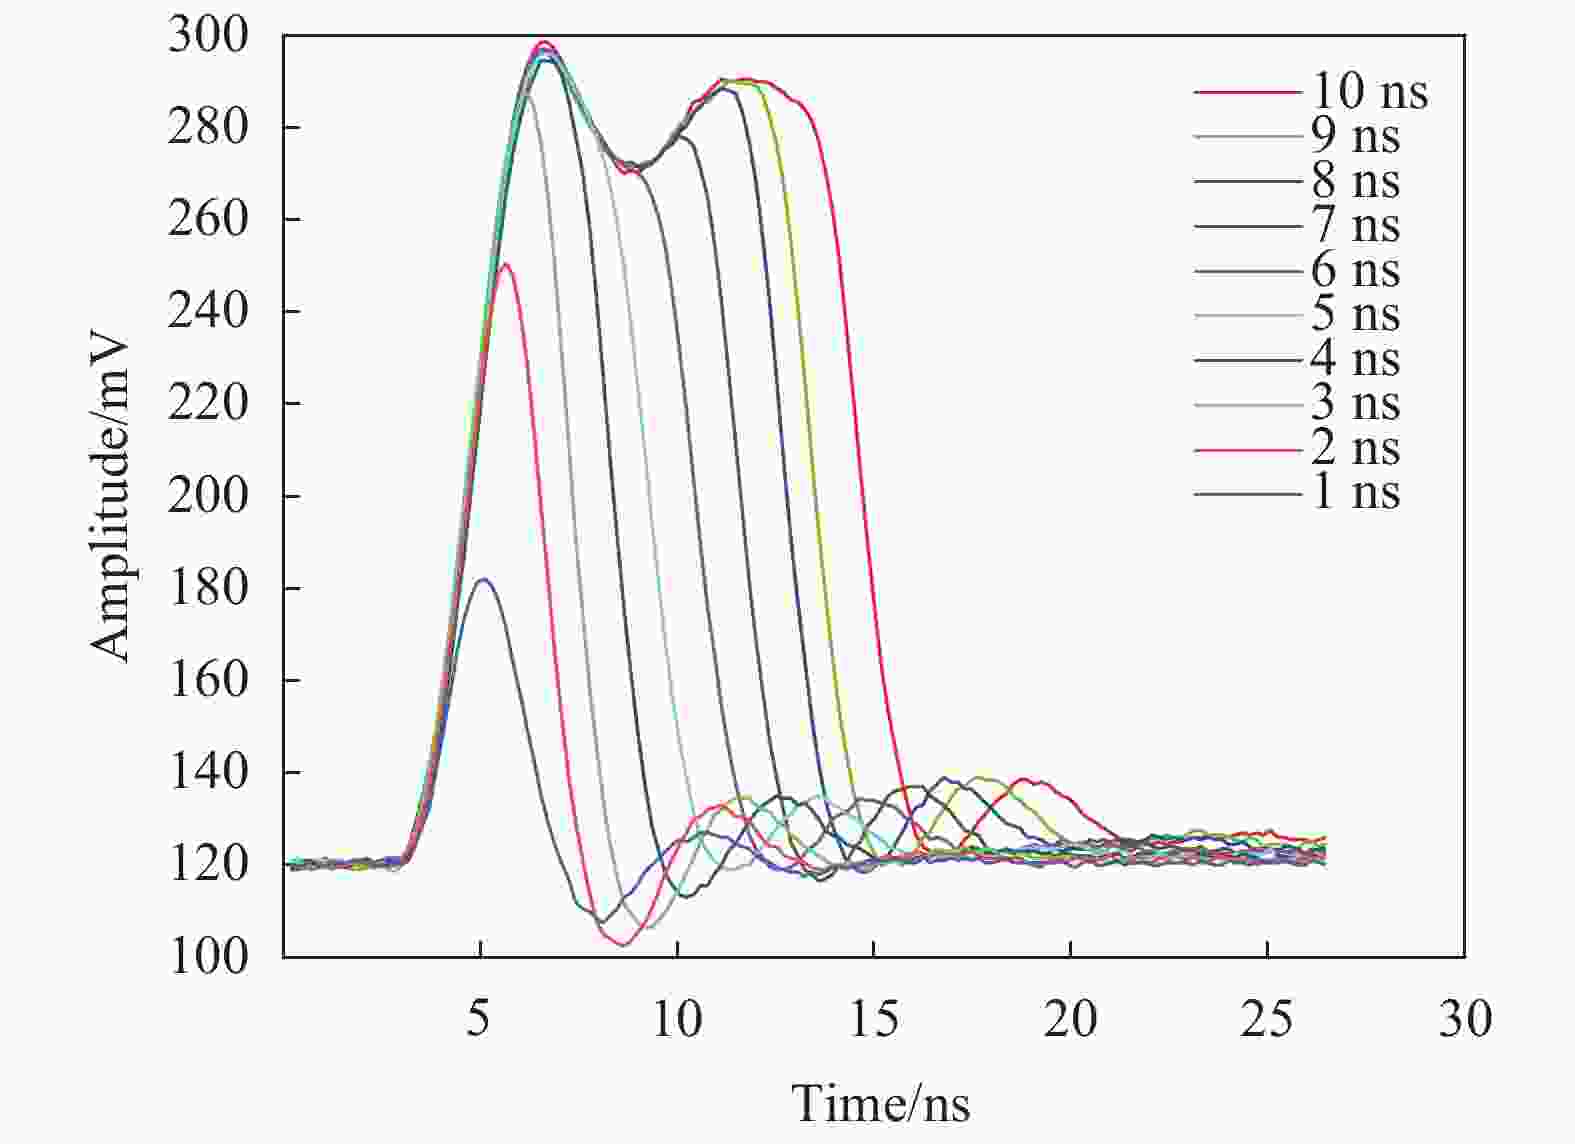
      Figure 1.  Reference light with different pulse widths

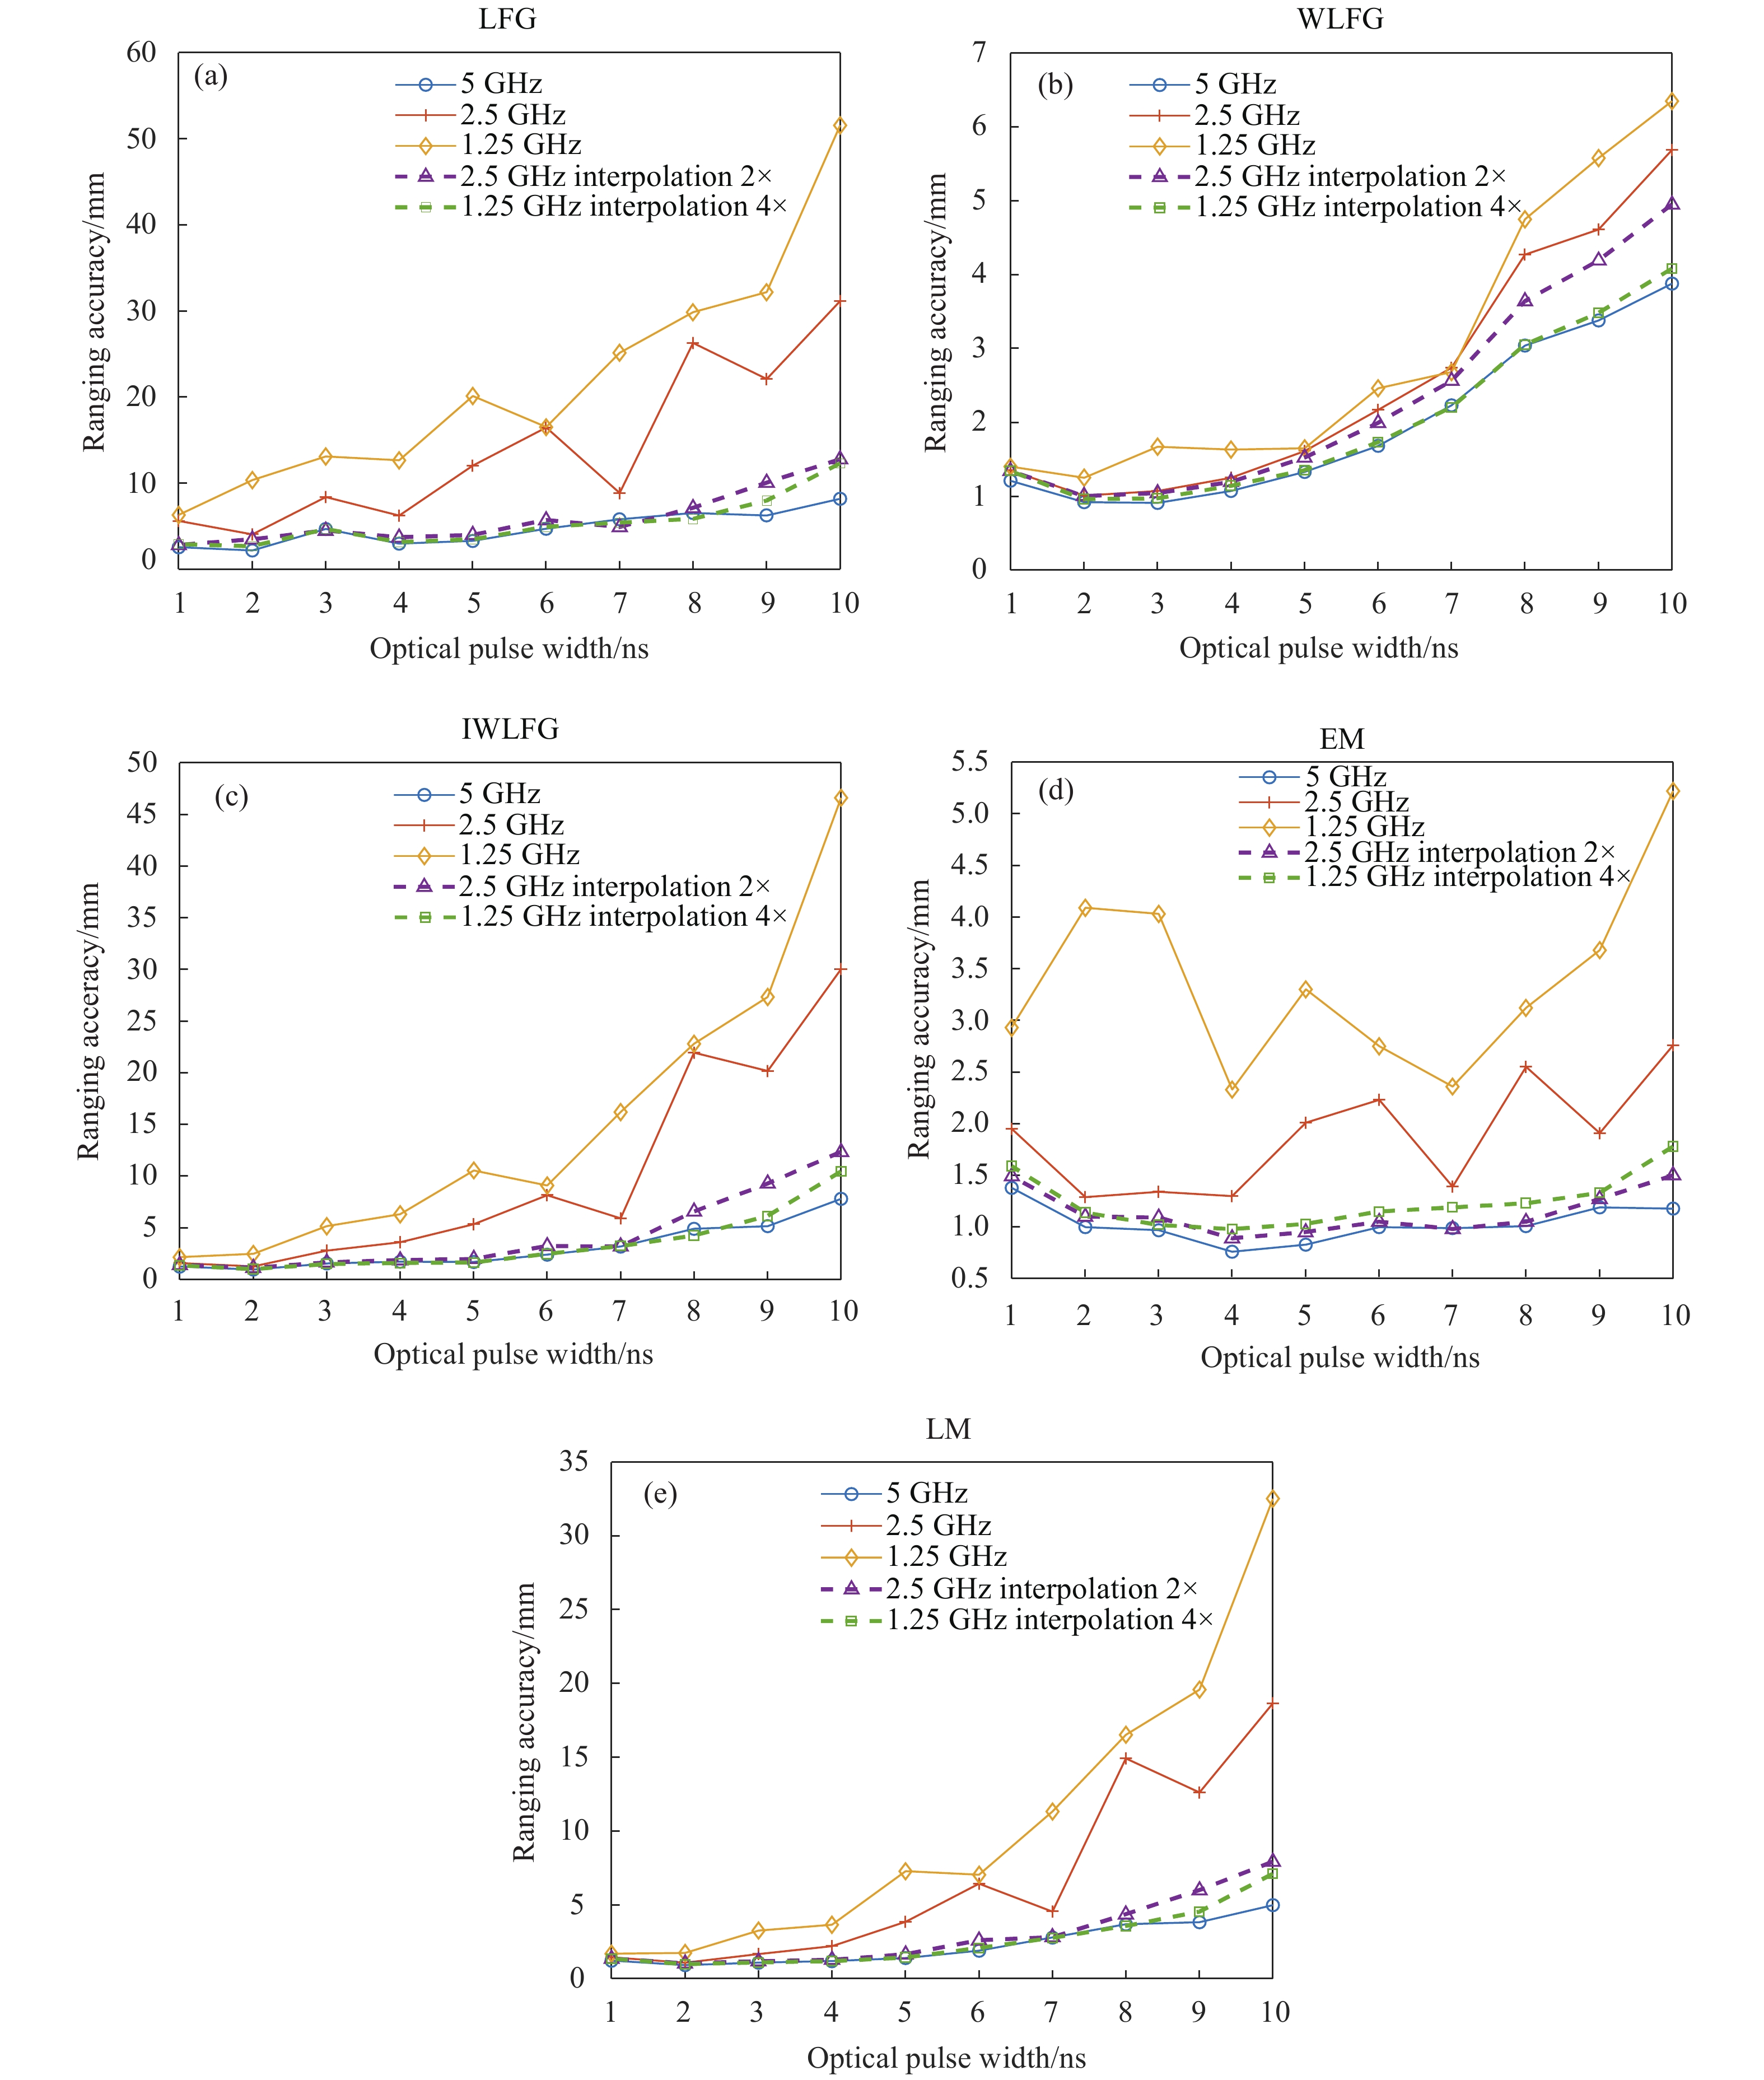
    • 在5 GHz采样频率下,不同算法在不同脉宽下的测距精度如图2所示。

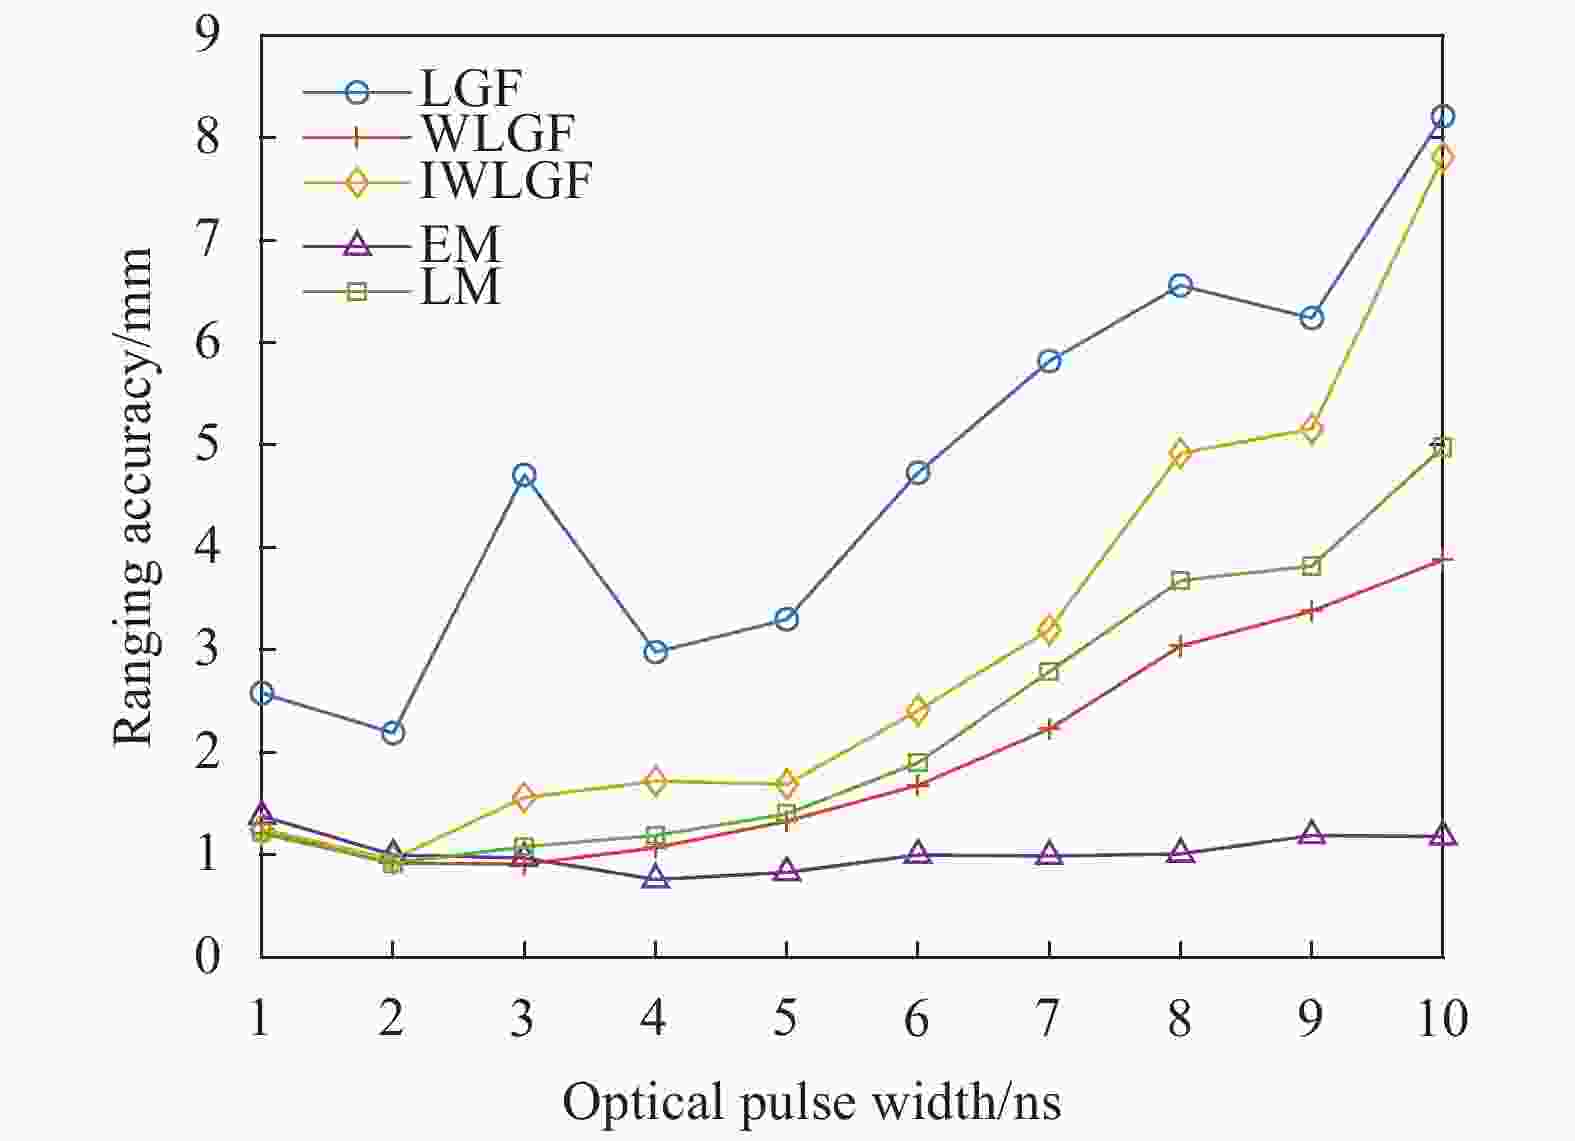
      Figure 2.  Comparison of ranging accuracy of 5 GHz sampling data

      图2中各算法的测距精度对比来看,受噪声影响最大的LGF算法测距精度明显低于其他4种算法,而且IWLGF算法的测距精度也较低,可能的原因是IWLGF能更好地解决存在部分高斯信号小于噪声的波形,而文中实验通过波形提取只将大于阈值的数据作为有效波形信号,因此其在迭代过程中反而更易受到波形畸变带来的影响,测距精度不高。

      图2中发现,随着激光脉冲的增加,LGF、WLGF、IWLGF、LM算法的测距精度都有一定程度的降低,而EM算法的测距精度下降幅度更小,且在畸变较小的窄脉宽条件下,WLGF、EM、LM变化趋势大致相同。这是由于EM算法对单个波形形态不敏感,而其他4种算法都是基于目标波形是高斯波形的假设下进行计算,因此除了受到激光脉宽变化带来的影响外,更易受到波形畸变带来的影响,导致测距精度的降低。

      注意到在1 ns光脉宽的情况下,各算法测距精度反而比2、3 ns光脉宽情况下要低,这是因为从表1中可知此时参考光幅值较低,根据文中2.3节的公式(20)及规律(3)可知,参考光幅值较低,会使得计算出的参考光时刻方差增大,进而参考光和回波之间的时间差的方差增大,最终导致了测距精度的降低。

      在波形幅值大致相同的条件下,光脉冲从3 ns到10 ns,实际回波脉宽增宽2.47倍,EM算法获得的测距精度从0.97 mm下降至1.18 mm,若假设表2中经多倍插值后获得的测距精度0.69 mm的平方为第一类误差,根据公式(12),第二类误差由此增加了1.97倍,符合公式(21)的脉宽与第二类误差的正比关系。

      Equivalent sampling frequency
      after interpolation/GHz
      Ranging accuracy of original
      5 GHz data/mm
      Ranging accuracy of original
      2.5 GHz data/mm
      Ranging accuracy of original
      1.25 GHz data/mm
      1.25NullNull2.33
      2.50Null1.301.19
      5.000.760.890.98
      10.000.720.830.91
      20.000.700.770.89
      40.000.690.760.87
      80.000.690.760.87

      Table 2.  Ranging accuracy of different interpolation ratios

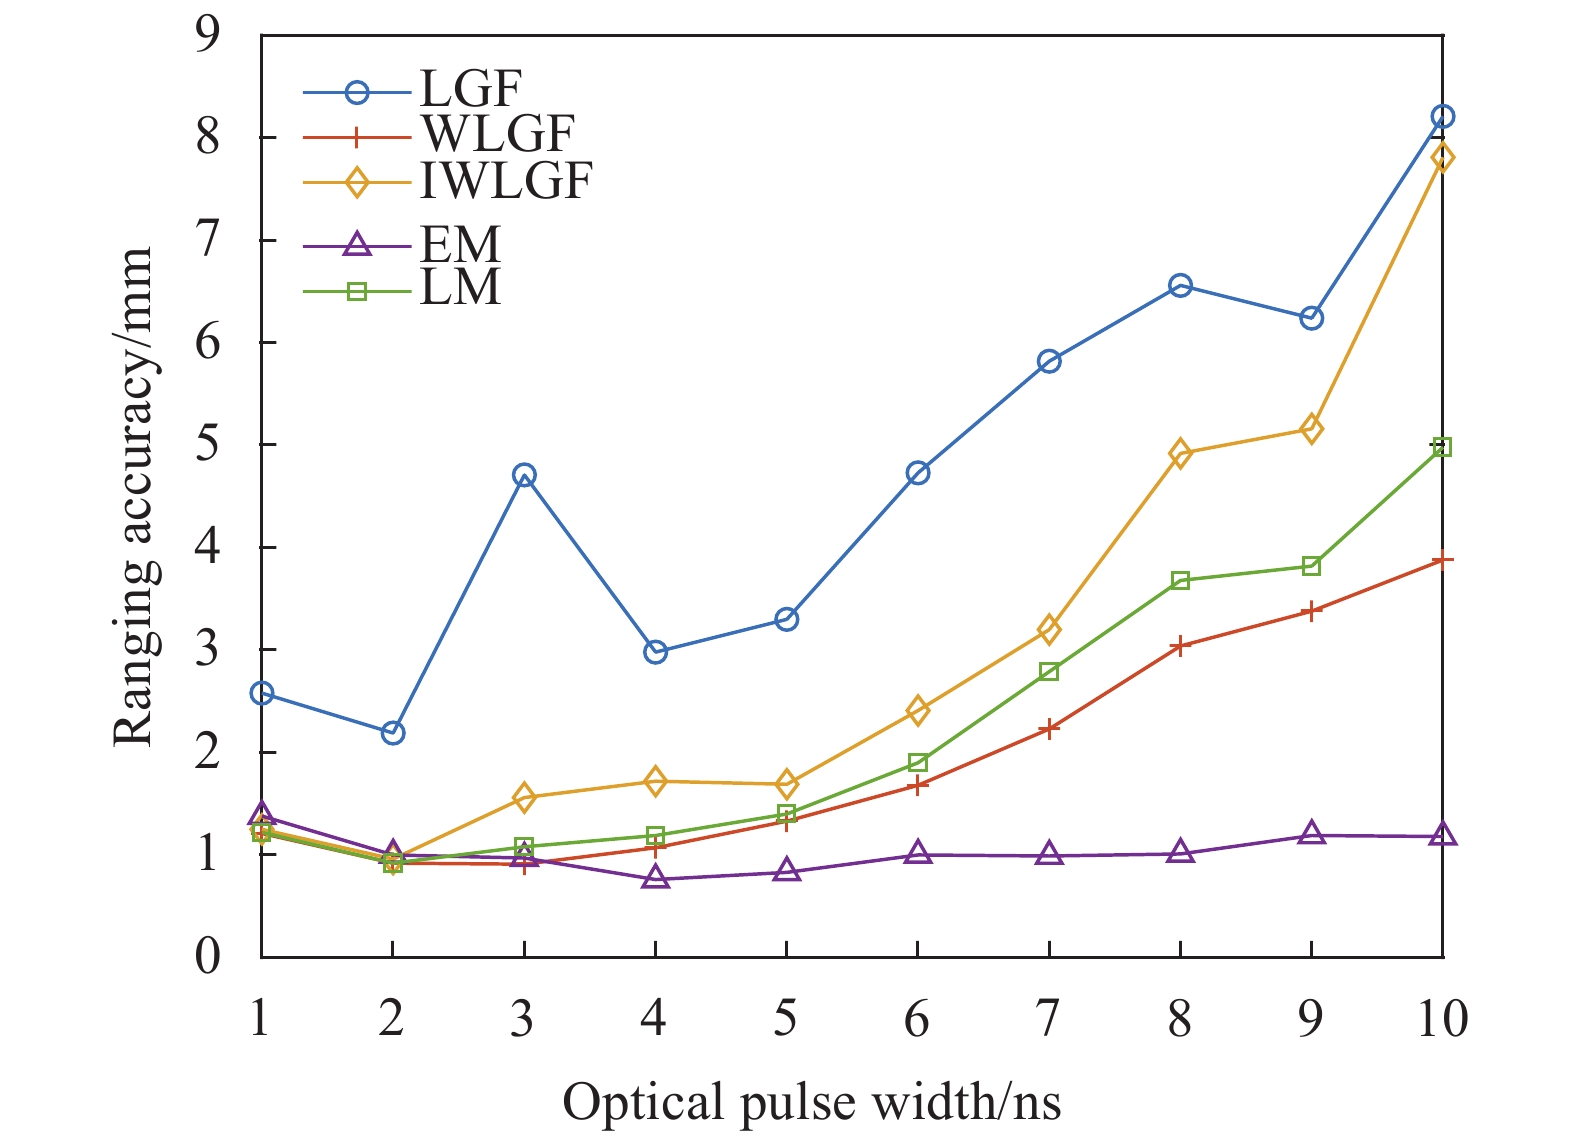
      除此之外,如图3中所示,无论是1.25、2.5 GHz还是插值后数据在5种算法下获得的测距精度变化趋势都与文中2.3节分析的规律(1)一致,即采样频率不变的情况下,增加激光脉宽将会降低测距精度。与此同时,由于波形脉宽还影响着多回波重叠时对两物体的分辨能力[13],因此波形脉宽在采样频率满足采样定理,且电路带宽足够的情况下应尽可能小。

      Figure 3.  Comparison of ranging accuracy under different sampling frequencies

    • 文中实验采集了1.25 GHz、2.5 GHz和5 GHz共3种采样频率的数据,并利用插值法将1.25 GHz和2.5 GHz的数据插值至5 GHz进行对比,结果如图2所示,其中图(a)、(b)、(c)、(d)、(e)分别代表LGF、WLGF、IWLGF、EM和LM算法的结果。

      图3可知,随着采样频率的下降,5种算法获得的测距精度都有不同程度的下降,在对1.25 GHz和2.5 GHz的数据插值至5 GHz时,发现所有算法的测距精度都有了明显改善,几乎都接近但仍低于5 GHz数据的测距精度,例如在光脉宽为4 ns的情况下,5 GHz采样频率数据在EM算法获得的测距精度分别为2.5、1.25 GHz采样频率数据的测距精度的1.71倍和3.07倍,而当2.5 GHz和1.25 GHz数据分别插值2倍和4倍至5 GHz后,仅为1.17倍和1.29倍。无论是1.25、2.5 GHz还是5 GHz采样频率,都高于有效信号绝大多数能量处于的频谱范围的2倍,即满足奈奎斯特定理,因此插值过程能够大致恢复原始波形。由此可见,通过插值也能够达到类似于提高采样频率而获得的测距精度提升的效果。

      为了进一步探究随着插值倍率的增加,测距精度能否一直提高,文中将光脉宽为4 ns的3种不同采样频率的原始数据进行不同倍率的插值,并用EM算法计算其测距精度,其结果如表2所示。

      表2可知,随着插值倍率的提高,测距精度逐渐趋于某一下限值,之后不再发生明显变化。这是由于激光器、探测器以及电路等多方面因素共同影响,使得重复采集的波形之间存在幅值差异以及到达时间的偏移抖动。哪怕不存在波形幅值的背景噪声,也会存在幅相误差[17]和时间抖动误差,其中幅相误差可以通过精确标定减小,时间抖动误差与器件特性有关而与单个波形的数据处理无关,也即第2节中提到的第一类误差。

      综上,实验结果表明,提高采样频率能够提高测距精度,且在低采样频率的情况下,对波形进行适当插值能够显著提高测距精度,实验结果与第2节的理论分析基本吻合。

    • 文中首先介绍了全波形激光雷达的原理,之后分析了测距误差来源以及采样频率和激光脉宽对测距精度的影响,并利用LGF、WLGF、IWLGF、EM、LM算法对不同采样频率和不同激光脉宽下采集的全波形数据进行处理,获得它们的测距精度并作对比分析。实验结果表明:LGF算法获得的测距精度最差,EM算法相较其他4种算法受到波形畸变的影响更小,WLGF算法相较其他4种算法受到采样频率降低带来的影响更小。随着波形脉宽的增加,第二类误差也随之增加,测距精度降低;随着采样频率的提高,第二类误差随之减小,测距精度提高,且对低采样频率的波形数据进行插值处理能显著提升测距精度。

      在文中的实验中,由于器件所限,激光脉宽范围和电路带宽均无法达到理想参数,且随着激光脉宽增加至一定程度时,波形畸变程度也随之增加,容易将因此导致的测距精度的降低全部归因于脉宽的影响,从而高估脉宽对测距精度的影响。未来可以从光斑大小、多回波重叠度、目标面倾斜角度等方面进一步研究其对测距精度的影响。

Reference (17)

Catalog

    /

    DownLoad:  Full-Size Img  PowerPoint
    Return
    Return