


HTML
-
激光超声检测技术是将脉冲激光辐照于被测物体表面,在块状试件内部可同时产生压缩波、剪切波和表面波,短脉冲产生的高频超声波具有空间分辨率高的特点有利于高精度的无损评价工作[1-4]。若利用光学检测法接收超声信号,即可完全实现从激励端到接收端的非接触式检测,利用快速扫描技术可较好地完成产品的在线检测过程,在工业零部件的无损探伤领域有广阔的应用空间[5-6]。但用于接收超声振动的激光干涉仪造价昂贵,检测系统构造复杂,且光学检测法的灵敏度受限于材料表面粗糙度情况,粗糙表面致使接收到的信号信噪比差,不利于数据分析处理[7]。电磁超声换能器(electromagnetic acoustic transducer,简称EMAT)是另一种典型的非接触式超声检测手段,常用于铁路钢轨等导电介质或铁磁性材料的无损探伤工作中。EMAT产生和接收超声波的原理复杂,但其换能器结构相对光学检测系统更加简易,经济适用性相对更好,操作更加灵活[8-10]。
显然,上述两种单一的非接触式超声检测技术都存在着自身的优势和不足,相较于EMAT方式激励超声波,激光激励超声波的信号能量更强,带宽更宽;而在超声信号接收方面,EMAT方式受材料表面粗糙度影响相对较小,因此当对导电金属和非铁磁性材料进行探伤检测时,可将两种技术混合使用,其形式和作用机理如图1所示。

Figure 1. Diagram of laser-electromagnetic ultrasonic
Dixon[11]利用激光激励、EMAT接收超声的实验完成了不锈钢和铝板在不同深度的缺陷的简单信号分析,证实了该项新检测技术的可行性。Zhao[12-13]自主设计并搭建了激光-声-磁检测系统,通过EMAT探头接收由Nd:YAG激光在固体中产生的剪切波,针对接收到的电压信号噪声过大的问题,利用小波阈值法对信号进行数字滤波处理,成功提取出信噪比较高的波形数据,实现了对表面粗糙钢轨的各种缺陷检测、层状结构厚度的测量等实验。为研究该检测技术中声场与板材表面断裂槽相互作用情况,Boonsang[14]通过对接收电压信号进行B扫描成像,同时发现调整EMAT传感器与狭缝的间距,信号幅值增强系数可至2.8±0.3。Pei[15]研究了激光-EMAT对金属内部缺陷的超声检测和评估,阐明了该检测方法用来定位预先未知缺陷的可行性。
研究学者对该新型混合式检测技术的研究工作大多通过实验进行探究性测试,对EMAT换能器的工艺参数及换能机理研究缺乏一定连续性。数值模拟的优势在于经济性和重复性,为数不多的仿真分析只研究了激光在固体中的激励的超声信号的传播过程,但激光-电磁超声在接收端最终通过换能器接收到的电信号进行数据分析和处理却鲜有文献报导,原因在于该过程涉及复杂的热、力、声、磁及电场的多物理场耦合。文中分析了激光激励的声场在固体内部的传播过程和EMAT换能器在接收侧的作用原理,建立了激光-电磁超声的有限元模型,得到了仿真模型在不同参数下的数值结果,研究分析了混合式检测下温度、位移场分布情况以及几大关键参数对压降波形的影响。文中对激光-电磁超声的实验探究、研究换能器的工艺参数对检测灵敏度影响有一定参考意义。
-
激光在固体介质中激励超声波的过程本质属于介质受热膨胀产生热应力,进而材料发生形变的热力学过程。脉冲激光作用在金属物质时,沉积能量在金属表面转化为热量形式,并分布于辐照区域,假定材料的热学性质不随温度变化,忽略对流和热辐射的前提下,根据傅里叶定律,笛卡尔坐标系下热传导的控制方程可表示为[16]:
式中:
$ T\left( {x\,,y,z,t} \right) $ 表示样品内部t时刻的温度分布;$\; \rho $ 是密度;$ C $ 是材料的比热容;$ \kappa $ 是热扩散系数。当激光在空间中垂直(z轴)辐照在金属表面上时,温升情况可用x和y分量来表示。一般地,激光作用面的边界条件为:式中:
$ K $ 为热传导率;$ Q\left( {x,t} \right) $ 表示作用在上表面的脉冲激光的能量分布函数,除上表面外,其他边界按热绝缘处理。激光脉冲的能量分布可表示为:式中:
$ A\left( T \right) $ 为金属材料对激光能量的吸收率;$ E $ 为单脉冲能量;${{{t}}_0}$ 为脉冲宽度;$ \omega _0^{} $ 为激光光斑的半径;$ f\left( x \right) $ 及$ g(t) $ 分别为激光的空间分布和时间分布,可以表示为:若入射脉冲的激光功率密度未达到材料的烧蚀阈值时,样品表层在辐照域吸收脉冲能量后,会发生热膨胀,产生瞬态位移场。根据纳维-斯托克斯方程,在各向同性的弹性固体材料中,超声场的波动方程为[17]:
式中:
${{U}}\left( {x,y,t} \right)$ 为瞬态位移;$ \lambda $ 和$\; \mu $ 为Lamé常数;$ {\alpha _l} $ 为材料的热膨胀系数。 -
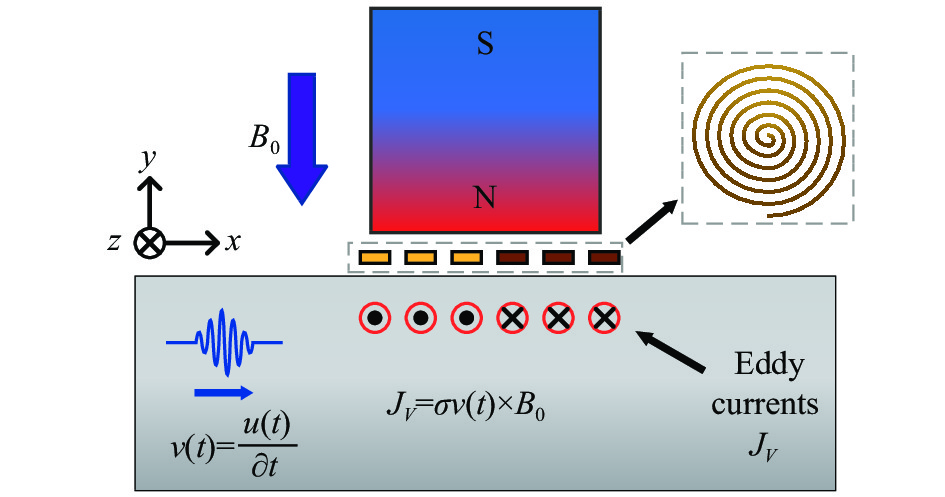
以电导率为
$ \sigma $ 的非铁磁性金属试块为例,如图2所示,当试样内部的超声场传播至EMAT的线圈下方时,被测物体内部及表面发生位移的正电荷晶格在外加偏置磁场${{{B}}_0}$ 的作用下产生涡流[18]:
Figure 2. Working principle of EMAT receiving transducer
被测导体中的动态涡流将在其周围产生一个交变磁场,其磁通密度为
${{{B}}_{{t}}}$ ,在EMAT的换能过程中,求解域的磁场由试件中的涡流密度和线圈的源电流密度共同提供,处于此动态磁场中的接收线圈进一步地生成感应电动势,进而被线圈接收,换能区域所满足的控制方程为[18]:式中:
${{A}}$ 为求解区域的磁矢势。进而线圈中点导体的感应电动势可通过对电场强度作线积分得到,于是: -
在各向同性材料中,垂直于介质表面入射的脉冲激光在试样内部产生的超声场沿径向表现为对称传播,永磁体周围的磁场呈现规律性分布,于是可将空间中激光-EMAT的立体几何模型简化为二维平面有限元模型,几何模型如图3所示,试块长度a=80 mm,宽度b=30 mm,非铁磁性固体材料的基本参数如表1所示;永磁体选取由NdFeB制成的柱形N50磁铁,其宽度w1=6 mm,高度h1=8 mm;线圈为螺旋型线圈,根据PCB工艺,材质为铜,在垂直于平面的导线横切面方向加载电流,线圈截面尺寸为0.2 mm×0.05 mm,线圈间距d1=0.8 mm,线圈提离距离t1=0.1 mm;永磁体与试件表面距离t2=0.5 mm,激光辐照点位于左侧,电磁接收换能器位于距其长为s的另一侧。
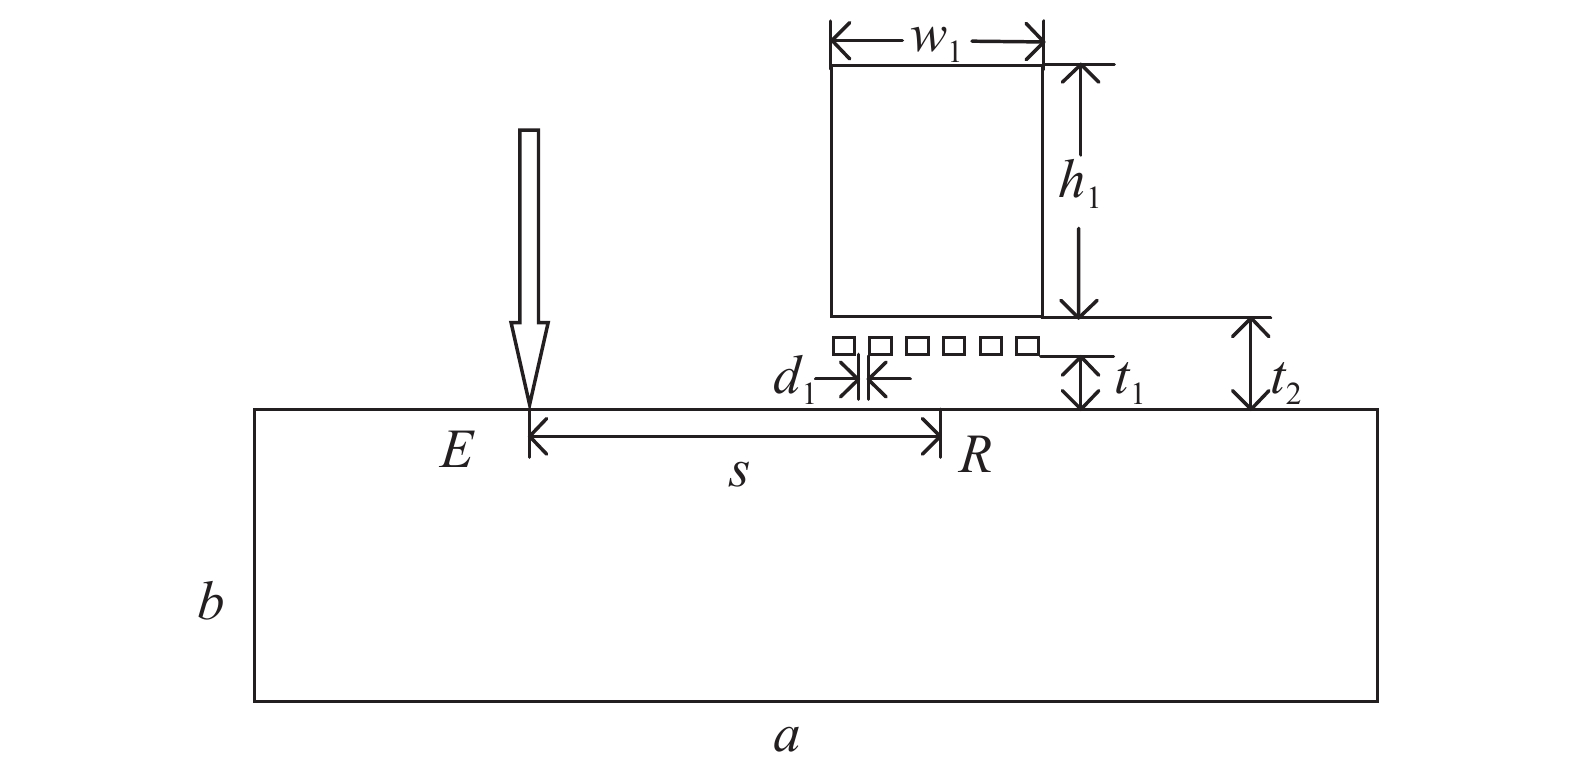
Figure 3. Diagram of the simulation geometric model
Parameter Value Thermal conductivity κ/W·m−1·K−1 238 Heat capacity C/J·kg−1·K−1 900 Thermal expansion α/K−1 2.31×10⁻⁵ Density ρ/kg·m−3 2700 Modulus of elasticity E/Pa 7.02×10¹⁰ Poisson ratio 0.33 Electrical conductivity σ/S·m−1 3.774×10⁷ Table 1. Basic physical parameters of materials
-
脉冲激光垂直于试件表面辐照在图3左侧E点处,脉冲能量为22 mJ,脉冲宽度为10 ns,光斑半径为0.1 mm,单脉冲频率1 Hz,如图4所示为高斯脉冲激光功率密度的时空维度分布图。能量以热源的形式加载于材料的上边界,热扩散深度为
$ L = 2\sqrt {\kappa t/\left( {\rho C} \right)} $ ,激光辐照区域存在较大温度梯度变化,故热扩散深度内的网格需做精细化剖分处理。
Figure 4. Energy distribution of Gaussian pulse beam for temporal and spatial
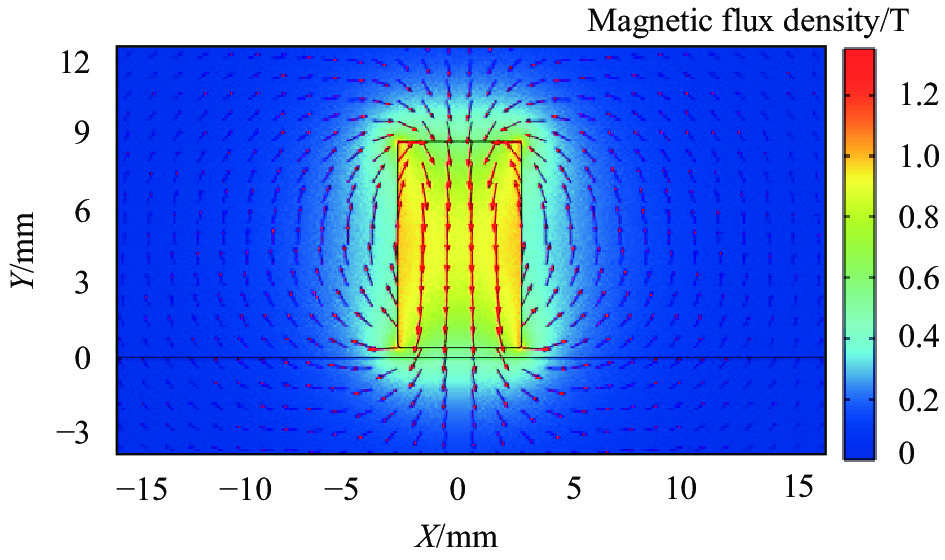
电磁超声接收换能器模型由永磁体、螺旋型线圈、被测试件、空气域构成,图3模型中已略去空气域。为避免长方形永磁铁的棱角可能带来的局部奇异电磁场对感应电流密度产生的影响,永磁体模型改用圆角矩形代替棱角矩形,磁场分布及磁感线方向如图5所示,永磁体宽度对应试件表面下方10 μm处轴向和径向分量的磁通密度绝对值如图6所示,可看出,水平分量在中心和边沿处的磁场分布差距较大,而垂直分量分布较为均匀。为保证磁场均匀分布,建立的空气区域部分需要覆盖换能器。试件左右两侧添加吸声边界条件来模拟无限元域,防止壁反射回波对信号分析造成的干扰。EMAT的换能过程主要集中在线圈正下方的材料表面的驱肤层,驱肤层深度可由
$ 1/\sqrt {\pi \cdot f \cdot \mu \cdot \sigma } $ 计算得出[18],$ f $ 为线圈激励电流频率,$ \mu $ 为试件的相对磁导率,换能区域所在的驱肤层应自上而下做梯次细化分布处理,以便得出更加精准的计算结果。
Figure 5. Magnetic flux density distribution of permanent magnet

Figure 6. Magnetic flux density below the coils
-
该模型是结合热、力、声、磁、电的物理变化所建立而成,研究关于稳态和瞬态过程的计算分析,利用有限元法解决该多物理场耦合的问题时,激发源部分选择传热和结构力学模块进行单向直接耦合,即不考虑应力场产生的几何变形对晶粒温度带来的反作用,接收侧EMAT选择无电流磁场、磁场、结构力学模块进行顺序耦合。有限元法求解的两大关键在于有限单元的网格划分和计算时间步长的选定,在该模型中,被测试件中的网格要求小于
$ \lambda /4 $ ,$ \lambda $ 为波长,光源半径作用范围及换能域中的趋肤深度做前述细化处理,其余部分网格进行自适应划分即可。时间步长的选择既要根据超声波频率考虑到计算的精准度,还涉及到计算资源和计算机性能的问题,根据经验,时间步长可拟选为$ \Delta t = {1 \mathord{\left/ {\vphantom {1 {\left( {180{f_{\max }}} \right)}}} \right. } {\left( {180{f_{\max }}} \right)}} $ ,$ {f_{\max }} $ 为计算超声频率的最大值,总计算时长根据声场在激励和接收点的渡越时间所决定。 -
图7给出了脉冲激光辐照试件表层下方不同节点的温升变化曲线,高斯脉冲作用下,辐照区域的温度场表现出:不同纵深位置的温度在激光辐照结束时达到峰值,随后在短时间内下降快速,所能达到的温度峰值随着深度的增加呈现明显的下降趋势,表面中心温度最高可达535 K,表层下方5 μm最高温度只有366 K,说明传热温升区域主要集中在材料表面。激光辐照试件所产生的能量沉积热在脉宽作用时间结束时上升到最大,通过这一温度变化过程可以直观分析判断脉冲能量是否达到材料的损伤阈值。

Figure 7. Temperature rise curves of irradiated surface center
将温度场分布作为载荷源施加到平面应变计算中,材料受热发生膨胀产生不均匀形变,表现出纳米或微米级的微弱位移场,同时激发出纵波、横波、表面波,特定模态的波形在材料中的传播速度和发散方向一般作为无损检测中试件测厚和缺陷检测的依据[19]。以纵波为例,图8所示为理论解析得出的纵波的指向性与仿真模型提取节点位移数据后得出的纵波指向性对比图,在烧蚀机制下,有限元模拟中的纵波以光斑垂直入射方向为对称轴,两侧呈纺锤形向外传播,与法线夹角60°处纵波的能量最为集中,仿真结果和理论指向角度的吻合性较好。

Figure 8. Directivity of longitudinal wave
-
经过有限元计算,分别提取最左侧线圈下方节点(4.375,0),线圈中心下方节点(7,0),最右侧线圈下方节点(9.625,0)三处的垂直位移,如图9所示,随着激励点与接收点距离的增加,脉冲激光激发的三种模态的超声波波形的历程曲线依次后移,同时波形符合激光诱导超声波的特点,再根据前述描绘的温升变化及纵波的指向性情况可知,有限元模型中激光激励的声场与实际相符,故可将动态位移场加载至EMAT换能器作为接收信号源。

Figure 9. Vertical displacements of different nodes
根据公式(7)~(9),线圈电压的感应电动势是由于磁体下方金属晶格的定向移动产生的,故位移波形变化规律应与电压信号保持一致,如图10所示为不同接收点R处螺旋型线圈电压的波形图,激励与接收点间距不同时,电压信号明显改变,将图9和图10进行比对分析,可以看出,忽略相位偏差后,电压幅值波动情况与表面的垂直位移完全相同,并且从电压信号中同样可探测到不同模态的超声信号,同时线圈产生了理想的压降,这说明仿真模型中由激光辐照试件而诱导的超声场与接收侧EMAT的磁场和电场成功耦合。

Figure 10. Coil voltages of different nodes
-
EMAT换能器存在的主要问题为:接收侧线圈电压幅值较小,换能器灵敏度不足,一般需要通过在系统中连接前置放大器来增强信号幅值,以供观察分析[12]。根据公式(7),影响EMAT换能器中感应电流强弱的主要因素之一是永磁体为试件表面提供的偏置磁场强度。图11所示为永磁体规格对驱肤层中磁通密度的影响曲线,依次考察了接收线圈正下方中心及边沿两处的磁通密度大小,截线探针选取为试样表面下方10 μm处。当宽度和高度分别取4、6、8、10、12、15、20 mm时开展正交试验,图11(a)和图11(c)分别为永磁体高度和宽度对边沿处磁通密度的影响,可以看出,边沿处的磁通密度随着磁体高度和宽度的增加而逐渐上升,这种非线性的变化在增大规格的过程中逐渐表现为趋缓,并且相比宽度而言,高度的变化对边沿处磁通密度的影响更为明显。图11(b)和图11(d)分别表示永磁体高度和宽度对中心处磁通密度的影响,不同于边沿处,当高度一定时,中心的磁通密度大小随着宽度的增加而减弱,衰减梯度几乎呈现线性变化,同样地,高度增加带来的磁通密度增长在后阶段表现出趋缓。

Figure 11. Influence of permanent magnet size on magnetic field. (a) Influence of magnet height on edge magnetic field; (b) Influence of magnet height on central magnetic field; (c) Influence magnet width on edge magnetic field; (d) Influence of magnet width on central magnetic field
当通过改变磁体规格来改善感应电流密度时,若选择的线圈集中在永磁体下方中心,为了增加驱肤层处的偏置磁场强度,所用永磁体的尺寸规格要满足窄且高,从图11(b)可以看出,4 mm和6 mm宽度的磁体在高度达到12 mm及继续增加高度后所提供的磁场强度保持在0.5 T左右。若选择接收线圈的面积与永磁体的底面积相差不多时,则考虑边沿范围内的磁场强度,在满足检测环境的前提下,选择高宽比为1.5倍的永磁体提供静偏置磁场。
除永磁体尺寸外,永磁体与工件上表面的提离距离t2在很大程度上也会改变磁场强度分布,进而影响换能器灵敏度,如图12所示为选取尺寸为6 mm×8 mm永磁体,提离距离t2分别取0.2~4.0 mm之间若干值时,纵波、横波和表面波的线圈电压峰值变化情况。结果表明,接收电压幅值随提离距离的增加呈负指数形式降低,表面波的幅值陡降程度最大,且提离距离对纵波的影响稍大于横波,当间距为4.0 mm时,电压幅值已较微弱,故可选取提离距离为0.5 mm左右,既满足非接触式检测的要求,又尽可能增加了换能器灵敏度。

Figure 12. Influence of lift-off distance on voltage amplitude of coil
作为接收元件的电磁线圈与被测试样的间距同样对换能效率有很大影响,从表2中可以看出,螺旋型线圈电压的峰值随线圈提离距离的增大表现为逐步下降的趋势,当提离距离t1从0.05 mm增加到0.1 mm时,线圈电压幅值变为原来的1/3,继续增大线圈与试样的间距,下降增量的变化程度趋缓,故在永磁体提离距离固定的情况下,可适当增加线圈与待测工件的间隙。
Coil lift-off distance t1/mm Voltage/V 0.05 188.63 0.10 60.04 0.15 50.50 0.20 41.78 0.25 35.55 0.30 31.77 Table 2. Influence of coil lift-off distance on transducer sensitivity
如图13所示为探测距离s分别为4、10、20 mm时的A、B、C三点的压降波形图,提取其电压幅值,同时加入50 mm和100 mm的数值模拟结果,绘制图14所示的探测距离对接收换能器灵敏度的影响曲线,从图14可以看出,当探测距离达到50 mm时,螺旋型线圈接收到的表面波和纵波的电压幅值分别下降到4.32 V和3.25 V,距离达到100 mm及更远时,换能器灵敏度为mV量级,实验所用示波器的检测精度大多满足该检测分辨率。

Figure 13. Voltage waveform of different nodes

Figure 14. Effect of detection distance on sensitivity
-
将激光激励超声和EMAT接收超声两种检测方法相结合,根据脉冲激光在固体中的致声机理以及电磁探头的换能原理,建立了非铁磁性材料下的激光-电磁超声换能过程的有限元模型,实现了由热力学方式激发的声场和电磁场的多物理场耦合过程。通过数值仿真,模拟了高斯脉冲光束辐照试件后的演化过程,获得了试件表面温升情况及包括纵波、横波、表面波的位移场,EMAT下方固体表面的垂直位移与螺旋型线圈的压降变化呈现很好的一致性。在此基础上,探究了永磁体规格、提离距离等关键因素对激光-电磁超声接收到信号灵敏度的影响,当磁体的高宽比为1.5倍时,试件表层的磁通密度分布较好;当提离距离t1从0.05 mm增加到0.1 mm时,线圈电压幅值变为原来的1/3;最后研究了探测距离对换能效率的影响程度,当激励和接收点距离在100 mm及以上时,电压精度为mV量级。文中的仿真过程和分析结果将为研究人员在激光-电磁超声的换能机理、工艺参数的设计选择方面提供一定参考。


 DownLoad: