


-
视觉/LiDAR里程计模块是无人车定位建图系统的重要组成部分,根据传感器数据对无人车在多个自由度上运动的过程进行估计,可用于环境感知、运动控制、相对定位、地图构建等。
目前针对视觉、LiDAR、IMU里程计的构建已经有一些解决方案。2019年,浙江大学的Zuo X等 [1]基于MSCKF提出的LIC-Fusion方法利用从LiDAR检测到的平面、边线几何特征和稀疏的视觉特征,在线标定了传感器间的时间和空间参数,以提高精度。2021年,MIT的Shan T等 [2]提出的LVI-SAM由视觉惯导系统和激光惯导系统构成,当两个系统中的一个失败的时候,LVI-SAM仍然可以工作,这极大地提升了系统在缺少纹理或者特征场景中的鲁棒性。2018年,Kaarta公司的Zhang J等 [3]提出了一种由粗到精的运动估计方法:先是通过IMU来预测,再通过视觉惯性里程计计算主车运动,最后通过激光点云拼接的方法来进一步修正估计结果,利用后续环节的输出修正IMU速度和零偏状态的误差。2021年,香港大学的Lin J 等[4]发表的R2 LIVE多传感器融合框架由两部分组成:基于滤波器的里程计和因子图优化模型;为了提高处理效率,系统通过误差迭代卡尔曼滤波器进行状态估计,并通过因子图优化进一步提高整体精度。
以上方法虽然可以满足在线实时应用的需求,但需要消耗大量的CPU计算资源,尤其是前端部分。因此搭建一个精度高、CPU资源占用少、GPU资源利用合理的视觉、LiDAR、IMU信息融合的里程计是有实用价值的。
文中提出了一种基于因子图优化的视觉、LiDAR、IMU实时里程计,支持多种运行模式和初始化方式。
(1)提出了一种多传感器信息融合的里程计系统:LiDAR前端采用改造后的ICP CUDA[5]算法提高了处理帧率、利用退化因子提高了在退化场景的精度,视觉特征处理考虑了消除相机Rolling Shutter的快门效应,提高了视觉测量的精度。
(2)系统根据传感器配置,支持按照全量的视觉LiDAR惯性里程计(Visual LiDAR Inertial Odometry,VLIO)、关闭视觉的LiDAR惯性里程计(LiDAR Inertial Odometry,LIO)和关闭LiDAR的视觉惯性里程计(Visual Inertial Odometry, VIO)模式运行,并支持LiDAR初始化和视觉初始化,扩展了系统的应用场景。
-
设计方案实现了视觉、LiDAR、IMU的里程计,并以轮速计作为辅助传感器用于车速测量和运动先验计算。系统的整体方案如图1所示。

Figure 1. System framework
设计方案根据传感器组合可以支持VLIO、LIO或者VIO模式运行,并支持LiDAR初始化和视觉初始化。前端部分支持视觉和LiDAR数据的并行处理及预积分的串行化,提高了处理帧率,满足了实时运行的需求。LiDAR前端部分采用改造后的ICP CUDA[5]算法,提高了点云拼接效率,节省了CPU资源,使用退化因子提高了退化场景的精度。视觉前端部分采用光流法进行特征点跟踪,特征点深度估计有两种方法:利用点云投影计算特征点深度,对稳定跟踪超过一定帧数的特征点通过三角化计算深度。后端因子图包含视觉节点和LiDAR节点,并利用预积分因子、视觉重投影因子和LiDAR ICP因子构建了节点间状态的约束。在点云到图像投影和视觉重投影因子中考虑了对相机Rolling Shutter快门效应的补偿,以降低计算误差。
为了讨论问题的便利,对全文中所使用的符号进行说明。使用
${(\cdot )}^{w}$ 来表示全局坐标系,即系统初始关键帧所对应的IMU坐标系;使用${(\cdot )}^{b}$ 表示局部坐标系,即IMU坐标系;使用${(\cdot )}^{c}$ 表示视觉坐标系。在文中使用旋转矩阵$ R $ 和Hamilton风格的单位四元数$ q $ 来表达旋转。$ {q}_{b}^{w},{p}_{b}^{w} $ 是局部坐标系到全局坐标系的旋转和平移值;$ {R}_{veh}^{b},{t}_{veh}^{b} $ 表示车体坐标系到局部坐标系的外参关系;$ {b}_{k} $ 是处理第$ k $ 帧数据时的局部坐标系;$ {c}_{k} $ 表示第$ k $ 帧图像数据;$ {v}_{{b}_{k}}^{w} $ 表示在第$ k $ 帧IMU的速度在全局坐标系中的值;$ {v}_{{b}_{k}}^{{b}_{k}} $ 表示在第$ k $ 帧IMU的速度在相应帧局部坐标系中的值;使用$ {b}_{\omega } $ 表示IMU陀螺仪的零偏;$ {b}_{a} $ 表示IMU加速度计的零偏;$ {g}^{w} $ 表示重力加速度在全局坐标系中的值,由初始化建立;使用$\widehat{(\cdot )}$ 表示带有噪声的测量数据或者具有一定不确定性的估计数据;$ \otimes $ 表示两个四元数相乘;$ \times $ 表示两个三维向量的矢量积。 -
假设有两帧数据对应的时间分别为
$ {t}_{k},{t}_{k+1} $ ,这两帧时刻间有多次IMU和轮速计测量。忽略地球自转因素的影响,可以直接根据IMU陀螺仪和轮速计的测量值计算得到这两帧对应局部坐标系的相对位姿关系。两帧相对位姿的旋转部分直接通过对IMU陀螺仪输出的角速度积分得到。具体计算方法为:
式中:
$ {\widehat{\omega }}_{t} $ 是陀螺仪角速度的测量值。为了得到两帧相对位姿的位移部分,先根据轮速计输出和车体/IMU外参关系计算出IMU在局部坐标系的速度为:
式中:
$ wheel\_speed $ 是轮速计的测量值,即车体坐标系沿其Y轴移动的速度大小。由于车体坐标系只会沿Y轴移动,因此沿X、Z轴方向的速度大小为零。进而对速度积分即得到帧间的相对位移为:采用这种方法的好处是简单,一般情况下精度较高,并且由于使用轮速计避免了直接采用IMU积分的方法中因为速度估计误差导致的计算误差,结果可以作为其他环节的运动先验。
-
设计方案的视觉前端部分采用非直接法,即通过提取、跟踪视觉特征点以获取视觉测量,并得到视觉帧间的运动约束。
视觉特征提取、跟踪有多种方法。在方案的实现中采用了Shi Tomasi[6]算法来提取角点作为视觉特征点,使用金字塔Lucas−Kanade算法进行特征点跟踪。除此之外,还支持其他类型的视觉前端,比如Super-Point[7]和SuperGlue[8]的方法,这也体现了这种方案的扩展性。
在利用视觉特征点创建状态约束前,需要对其深度进行估计。特征点深度估计分为两种方法:利用激光点云辅助的方法和利用多帧图像三角化的方法。
对于利用激光点云辅助计算深度的方法参考了LIMO[9]的方法来实现。具体来讲对于一帧新的图像数据会根据其采集时间
$ {t}_{c} $ 查询临近时间点的激光点云数据$ {t}_{l} $ 。利用前面提到的IMU、轮速计直接积分的方法可以得到这两个时刻IMU坐标系的相对位姿关系$ {T}_{{t}_{l}}^{{t}_{c}} $ 。利用该相对位姿关系和相机内参模型可以把点云数据投影到图像平面上:式中:
$ {\pi }_{c} $ 是相机投影模型;$ {T}_{b}^{c} $ 是IMU坐标系到相机坐标系的外参;$ {p}_{{t}_{l}}^{b} $ 是激光点云中的点在IMU坐标系下的坐标。对于Rolling Shutter快门的相机,上述点云到图像平面的投影关系是有一定误差的。为了减小该快门对投影误差的影响,需要根据点采集时间
$ {t}_{c}^{\mathrm{\text{'}}} $ 利用线性插值的方法计算投影使用的相对位姿关系$ {T}_{{t}_{l}}^{{t}_{c}^{\mathrm{\text{'}}}} $ (图2)。
Figure 2. Using pose slurp to eliminate the Rolling Shutter effect
通过投影的方法将点云和图像数据融合后可以利用视觉特征点周围点云数据来计算视觉特征点的深度。
由于LiDAR垂直视角往往比相机小或者LiDAR观测距离有限,存在一些图像区域无法被激光点云数据覆盖,因此,不是所有视觉特征点都可以通过激光点云数据计算出深度信息。对于这部分视觉特征点,通过多帧图像三角化的方法来计算深度;实施时只对稳定跟踪超过一定帧数(>5)的特征点进行三角化。与两帧三角化相比,这种方法对特征点深度的估计更准确、稳定,进而提高了运动估计精度。
-
在方案中使用的LiDAR点云数据是经过运动补偿之后的数据。LiDAR前端部分采用了针对LiDAR点云数据改造的ICP CUDA[5]算法进行两帧点云配准,并使用退化因子[10]进行了改进。通过GPU并行加速的ICP算法,可快速完成多对关键帧点云的配准,降低了里程计的漂移。算法的总体流程为:
算法1:使用退化因子的ICP CUDA算法
输入:两帧经过运动补偿的激光点云:
$A= \left\{{a}_{i}\right\}, \ B=\left\{{b}_{i}\right\}$ ,两帧点云的初始相对位姿:$ {T}_{0} $ 输出:修正后的两帧点云的相对位姿T可以将
$ A $ 和$ B $ 拼接在一起过程:
将点云
$ A $ 和$ B $ 中的点根据水平和竖直方向的角度投影到二维平面,并计算各点的三维法向量,创建Auvmap,BuvmapT
$ \leftarrow {T}_{0}$ $\mathrm{i}\mathrm{t}\mathrm{e}\mathrm{r}\mathrm{a}\mathrm{t}\mathrm{i}\mathrm{o}\mathrm{n}\_\mathrm{t}\mathrm{i}\mathrm{m}\mathrm{e} \leftarrow $ 0while算法没有收敛 do
根据
$ \mathrm{i}\mathrm{t}\mathrm{e}\mathrm{r}\mathrm{a}\mathrm{t}\mathrm{i}\mathrm{o}\mathrm{n}\_\mathrm{t}\mathrm{i}\mathrm{m}\mathrm{e} $ 设置内点法向量角度判断阈值angle_thresh根据
$ \mathrm{i}\mathrm{t}\mathrm{e}\mathrm{r}\mathrm{a}\mathrm{t}\mathrm{i}\mathrm{o}\mathrm{n}\_\mathrm{t}\mathrm{i}\mathrm{m}\mathrm{e} $ 设置内点距离判断阈值$ \mathrm{d}\mathrm{i}\mathrm{s}\_\mathrm{t}\mathrm{h}\mathrm{r}\mathrm{e}\mathrm{s}\mathrm{h} $ for i
$ \leftarrow $ 1 to N do$ \blacktriangleleft $ 在GPU上并行计算根据T计算
$ {b}_{i} $ 在$ {A}_{uvmap} $ 的2D投影位置并查找匹配点$ {a}_{{b}_{i}} $ if
$\mathrm{d}\mathrm{i}\mathrm{s}\mathrm{t}\left({a}_{{b}_{i}},{T\cdot b}_{i}\right) \leqslant \mathrm{d}\mathrm{i}\mathrm{s}\_\mathrm{t}\mathrm{h}\mathrm{r}\mathrm{e}\mathrm{s}\mathrm{h}$ and$ {r}_{i} \leftarrow $ $(T\cdot {b}_{i}-{a}_{{b}_{i}}){\cdot A}_{uvmap}\left[{a}_{{b}_{i}}\right].\mathrm{n}\mathrm{o}\mathrm{r}\mathrm{m}\left(\right)$ ,$ {J}_{i} \leftarrow $ $ \dfrac{\partial {r}_{i}}{\partial T} $ else
$ {r}_{i} \leftarrow $ 0,$ {J}_{i} \leftarrow $ 0end
end
$ H \leftarrow $ $\displaystyle \sum \nolimits_{i}{J}_{i}^{\rm T}{J}_{i}$ ,$ g \leftarrow $ $\displaystyle \sum \nolimits_{i}-{J}_{i}^{\rm T}{r}_{i} \blacktriangleleft$ 在GPU上执行并归求和$ \Delta T \leftarrow $ 利用退化因子求解$ H\Delta T=g $ T
$ \leftarrow $ $ T \oplus \Delta T $ $\mathrm{i}\mathrm{t}\mathrm{e}\mathrm{r}\mathrm{a}\mathrm{t}\mathrm{i}\mathrm{o}\mathrm{n}\_\mathrm{t}\mathrm{i}\mathrm{m}\mathrm{e} \leftarrow $ $ \mathrm{i}\mathrm{t}\mathrm{e}\mathrm{r}\mathrm{a}\mathrm{t}\mathrm{i}\mathrm{o}\mathrm{n}\_\mathrm{t}\mathrm{i}\mathrm{m}\mathrm{e} $ + 1end
该算法在每轮迭代中用于判断内点的阈值是否随着迭代次数而减小,这有利于随着迭代收敛排除掉动态物体等的外点,提高配准精度。该算法的迭代采用了高斯−牛顿法,并利用退化因子保证只在非退化的自由度上迭代更新
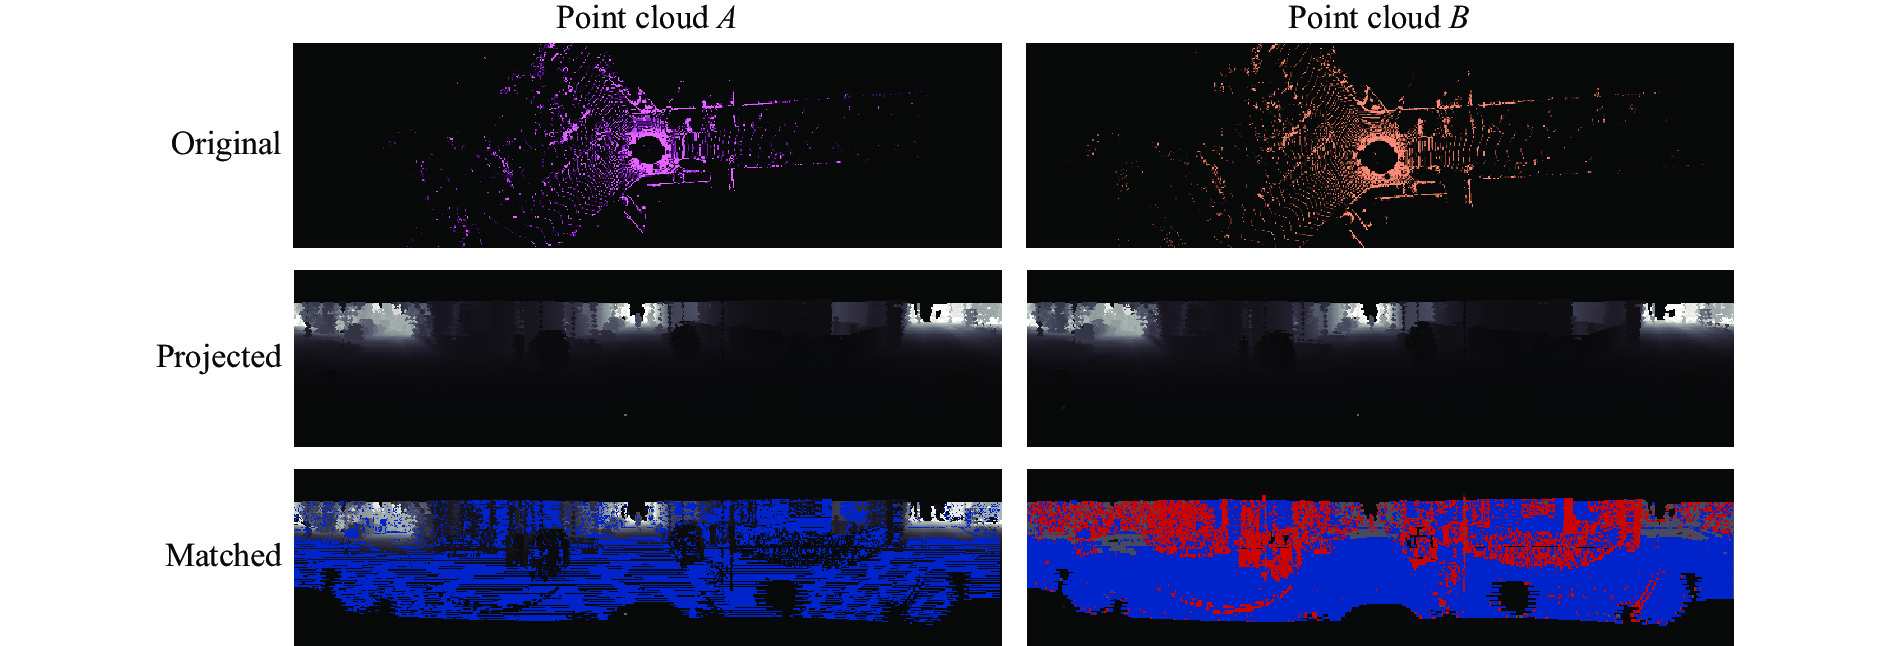
$ T $ 。退化因子定义为$ H $ 的最小特征值,其所对应的特征向量即为特征退化自由度。利用改造后的ICP CUDA算法对两帧点云配准过程的可视化图如图3所示。

Figure 3. Visual diagram of matching two frames piont cloud using optimized ICP CUDA algorithm
在匹配结果中蓝色的点表示匹配内点,红色的点表示匹配外点,可以看到主车前方其他移动车辆上的点多数被有效判断为外点。
为了提升系统精度,需实现每个LiDAR关键帧都与前面多个LiDAR关键帧进行点云拼接,并将结果添加到后端的因子图中。关于LiDAR关键帧的选取可以采用运动阈值方法,或者根据点云重叠区域判断[11]的方法。
-
后端部分采用了基于滑动窗口的图优化方法。每个视觉或者LiDAR关键帧的状态都用图的节点来表示,每个节点的状态定义为:
系统整体状态为:
VLIO的后端部分整体采用了包含多种类型因子的图优化模型,整体因子图如图4所示。

Figure 4. Factor graph in backend
当滑动窗口长度达到最大值后,插入新的关键帧节点会删除最旧的关键帧节点,也删除关联观测帧的视觉特征,以保证计算复杂度不会随着时间推移而增大。
在进行优化问题求解时会固定滑动窗口内第一个节点的位移、旋转状态,以保证里程计输出的连续性。后端整体优化问题的构建为:
IMU预积分因子
$ {r}_{\mathrm{i}\mathrm{m}\mathrm{u}} $ ,即根据IMU预积分结果对相邻关键帧状态创建的约束关系。文中方案对所有的视觉和LiDAR关键帧创建了统一的串行IMU预积分因子,采用预积分因子可以有效利用IMU测量值对节点的所有维度的状态进行约束,进而有效估计出节点的速度和IMU零偏。预积分因子的计算详细参考VINS-Mono[12]。视觉因子
$ {r}_{\mathrm{v}\mathrm{i}\mathrm{s}\mathrm{i}\mathrm{o}\mathrm{n}} $ ,即根据视觉前端输出的特征点跟踪结果对视觉关键帧创建的约束关系。文中方案采用重投影误差作为视觉因子,另外在计算重投影误差时消除了Rolling Shutter相机快门对平面投影坐标的影响。式中:
${\left[{u}_{l}^{{c}_{i}}{v}_{l}^{{c}_{i}}\right]}^{\rm T},{\left[{u}_{l}^{{c}_{j}}{v}_{l}^{{c}_{j}}\right]}^{\rm T}$ 分别是第$ i,j $ 帧对视觉特征点$ l $ 的观测;$ \Delta {T}_{i},\Delta {T}_{j} $ 是在两帧视觉数据生成过程中IMU坐标系的相对运动,使用预测的运动先验值,在优化过程中设为常量;$ {{T}^{\mathrm{{'}}}}_{{b}_{i}}^{w},{{T}^{\mathrm{{'}}}}_{{b}_{j}}^{w} $ 是根据特征点所在图像平面行进行运动线性插值后得到的对应时刻IMU坐标系的状态,这是对Rolling Shutter快门图像传感器在成像时刻状态的修正;$ {\pi }_{c} $ 是相机投影模型;$ {\pi }_{c}^{-1} $ 是其逆过程;$ {\lambda }_{l} $ 是视觉特征$ l $ 在第$ i $ 帧观测的逆深度值。ICP因子
$ {r}_{\mathrm{i}\mathrm{c}\mathrm{p}} $ ,即根据LiDAR前端输出的结果对LiDAR关键帧创建的状态约束。具体地有:式中:
$ {\hat{T}}_{e}^{s} $ 是LiDAR前端输出的帧间相对位姿;${\rm log}$ 是三维刚体变换的对数映射,结果为六维向量。 -
系统初始化通过构建初始关键帧序列,对关键帧节点的状态进行估计:包括全局位姿、速度、加速度计零偏、陀螺仪零偏,并对重力方向进行估计。对于有视觉传感器的系统,在初始化过程中还需要建立视觉地图的尺度信息。系统初始化建立了准确的初始状态,是系统正常运行的前提。如果初始化精度不高甚至不进行初始化,系统状态则很难收敛,精度也会大打折扣。
文中方案提供了两种初始化方式:LiDAR初始化和视觉初始化,这两种方法适用于不同的传感器方案。
对于采用LiDAR初始化的方法,在非退化场景通过LiDAR前端可以方便地计算出帧间相对运动。之后的初始化过程可以分为两个阶段:陀螺仪零偏估计阶段、速度和重力方向估计阶段。
对于陀螺仪零偏估计的方法与VINS-Mono[12]的方法类似,只是旋转运动的来源不同。在该阶段会根据LiDAR关键帧间的旋转估计并结合IMU旋转运动的预积分结果计算IMU陀螺仪的零偏,并重新进行预积分,以保证预积分结果的准确性。
在速度和重力加速度估计阶段,要估计的状态变量为:
在该阶段会结合运动估计结果和IMU预积分中的速度和位移结果,构建如下初始化问题:
式中:
$ \mathcal{F} $ 为滑动窗口内关键帧的集合。在该优化问题中使用了两种优化目标函数。第一种是IMU预积分残差,表达了IMU预积分结果速度和位移分量与状态值的差异;第二种是重力加速度大小的残差,利用了地球表面重力加速度的大小近似为$9.8\;\mathrm{m}/{\rm s}^{2}$ 的事实。式中:
${\hat{\alpha }}_{{{b}}_{k+1}}^{{b}_{k}}$ 是预积分结果的平移分量;$\; {\hat{\beta }}_{{b}_{k+1}}^{{b}_{k}} $ 是预积分结果的速度分量;$ {p}_{{b}_{k}}^{w},{R}_{{b}_{k}}^{w} $ 是已知量,由LiDAR前端计算给出,不进行优化。该方法不对可以直接观测到的节点旋转和平移状态进行优化,而只优化节点的速度分量、IMU陀螺仪零偏和重力加速度,对于IMU加速度计的零偏设置为零。优点是也适用通过其他途径得到的帧间相对运动的方法。
在没有LiDAR的情况下,采用视觉数据进行初始化,为了精确建立尺寸信息还使用了轮速计数据:通过IMU、轮速计积分得到帧间运动后,利用视觉观测进行运动优化,剩余步骤与LiDAR初始化方法类似。
采用轮速计辅助初始化的好处是实现简单,对初始运动条件要求低,尺寸容易观测,克服了单纯IMU加视觉初始化对车辆机动性的要求,且一般情况下精度足够。
对有视觉传感器的系统,除需要对节点状态进行估计之外,还需要建立起视觉特征点的深度信息,这通过光束平差法(Bundle Adjustment)来完成。
-
实验验证部分基于自采数据完成。实验使用了Pandar40P的激光雷达、自研Rolling Shutter快门的前视相机(分辨率为648×1152,单帧采集时间45 ms)、PwrPak7D−E1双天线MEMS组合导航系统(Integrated Navigation System,INS)、安装在车辆右后轮的轮速计(平均精度误差在
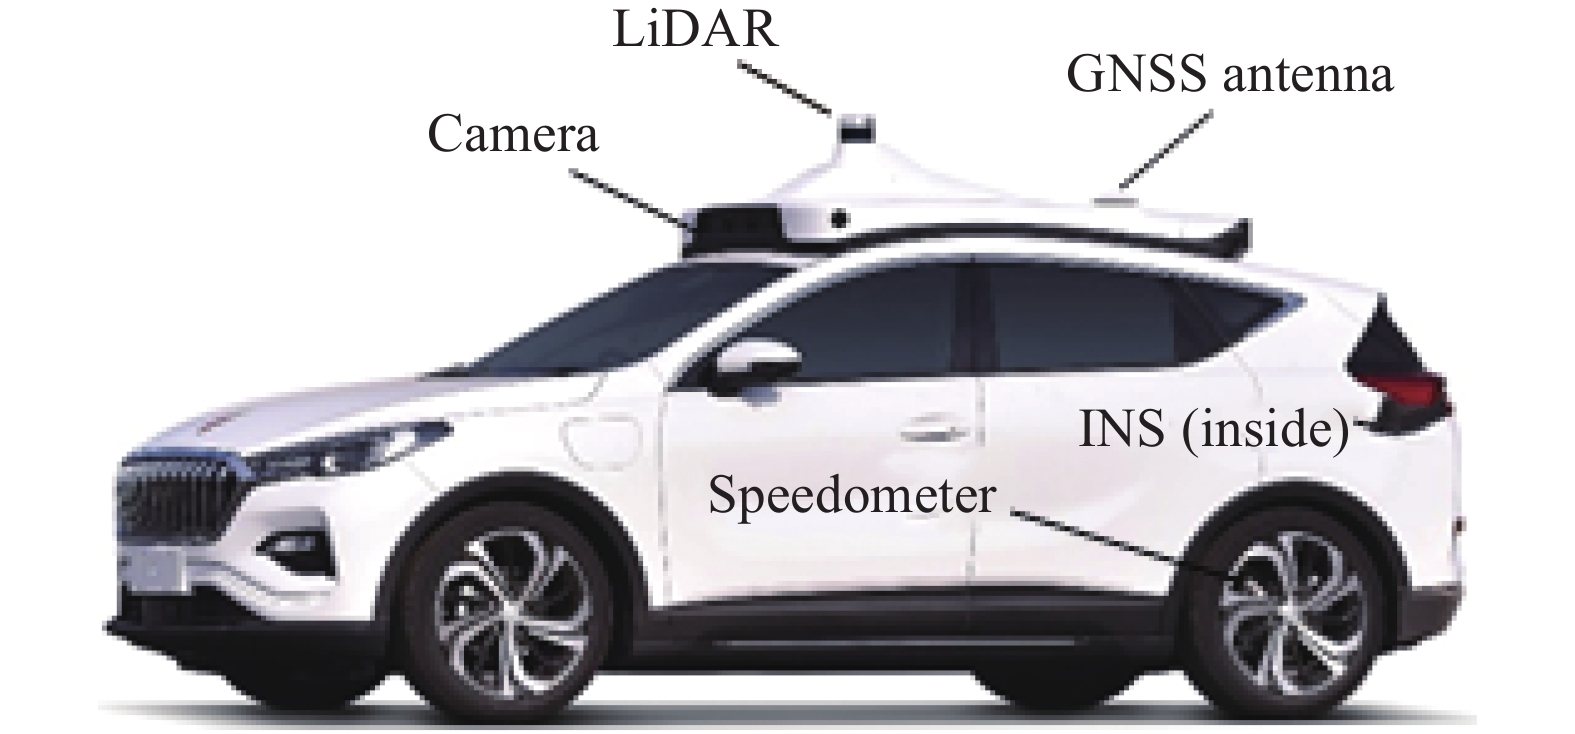
$ \pm 0.02 \ \mathrm{m}/\mathrm{s} $ )。在实验中将组合导航系统的数据经NovAtel Inertial Explorer解算后作为运动真值,定位精度可达厘米级。在实验前需要标定好外参,比如俞家勇等[13]提出的基于参考面约束的车载移动测量系统的外参标定方法。测试使用的计算机配置为Intel i9−10900 X 3.70 GHz CPU、64 G内存、GeForce RTX 3090 GPU、24 G显存。实验车辆的外观如图5所示。
Figure 5. System appearance
在实验中,视觉部分帧率为15 Hz,单帧跟踪的特征点数为300,当有特征点跟踪丢失后,则提取新的特征点,当前帧与上一关键帧同时满足如下两个条件时创建新的视觉关键帧:距离大于0.8 m,共视特征点数小于110或者平均视差大于30 pixel。LiDAR部分帧率为10 Hz,特征匹配使用的距离阈值为
$\mathrm{m}\mathrm{a}\mathrm{x}\;(0.5, \mathrm{ }4.0-0.5\cdot iteration\_time)\;\mathrm{m}$ 、角度阈值为$\mathrm{m}\mathrm{a}\mathrm{x}\;(10.0,\mathrm{ }\mathrm{ }\mathrm{ }\mathrm{ }30.0- 5.0\cdot \mathrm{i}\mathrm{t}\mathrm{e}\mathrm{r}\mathrm{a}\mathrm{t}\mathrm{i}\mathrm{o}\mathrm{n}\_\mathrm{t}\mathrm{i}\mathrm{m}\mathrm{e})$ °,当前帧与上一关键帧的距离超过$4.0\;\mathrm{m}$ 或者旋转超过$ 5.0$ ° 则创建新的LiDAR关键帧。后端滑动窗口的总长度为40。 -
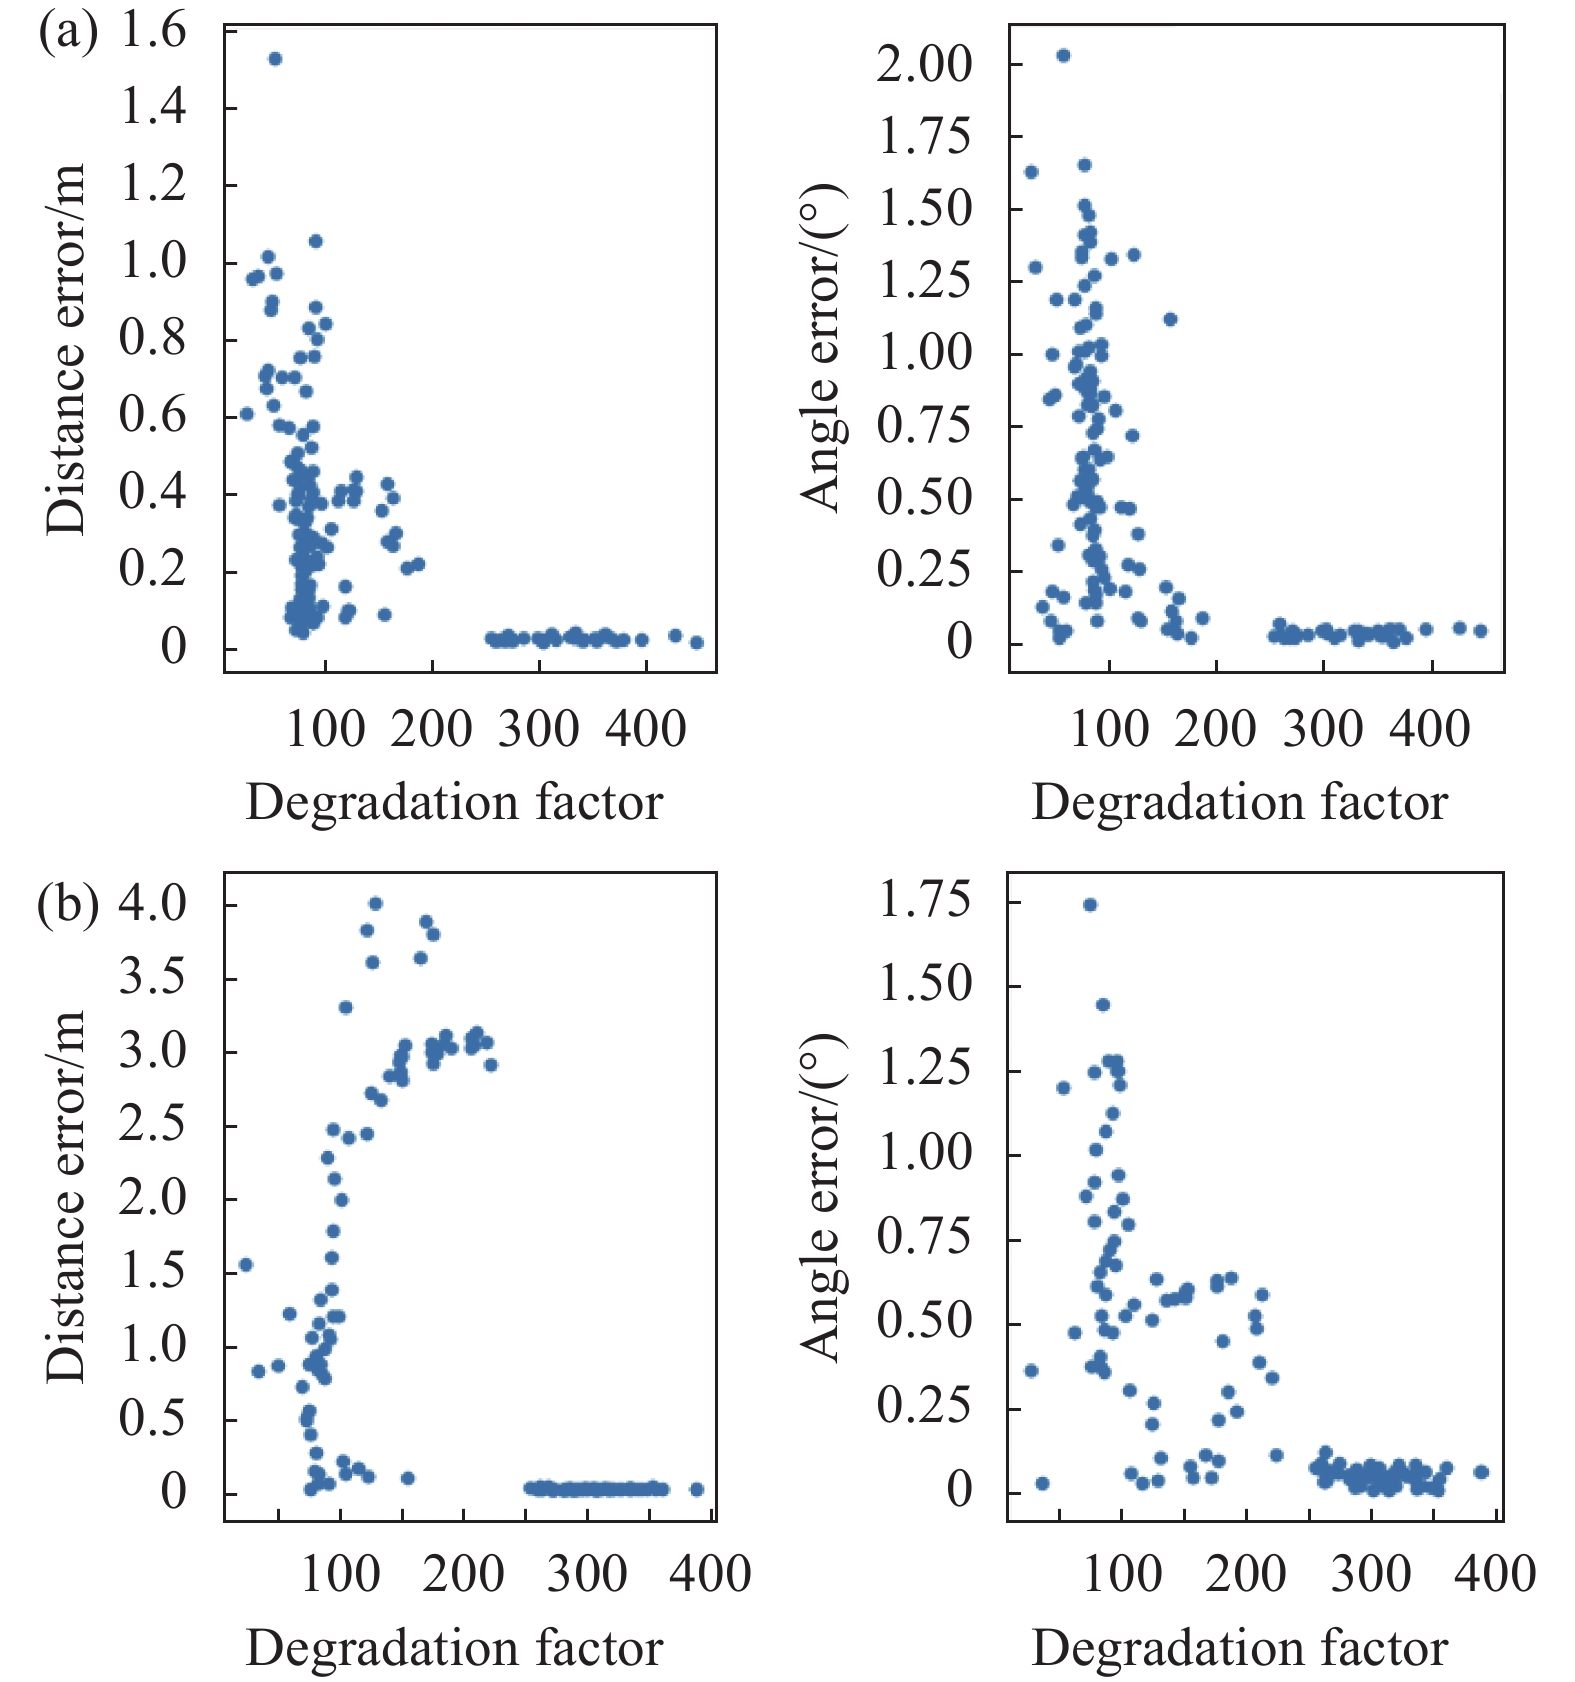
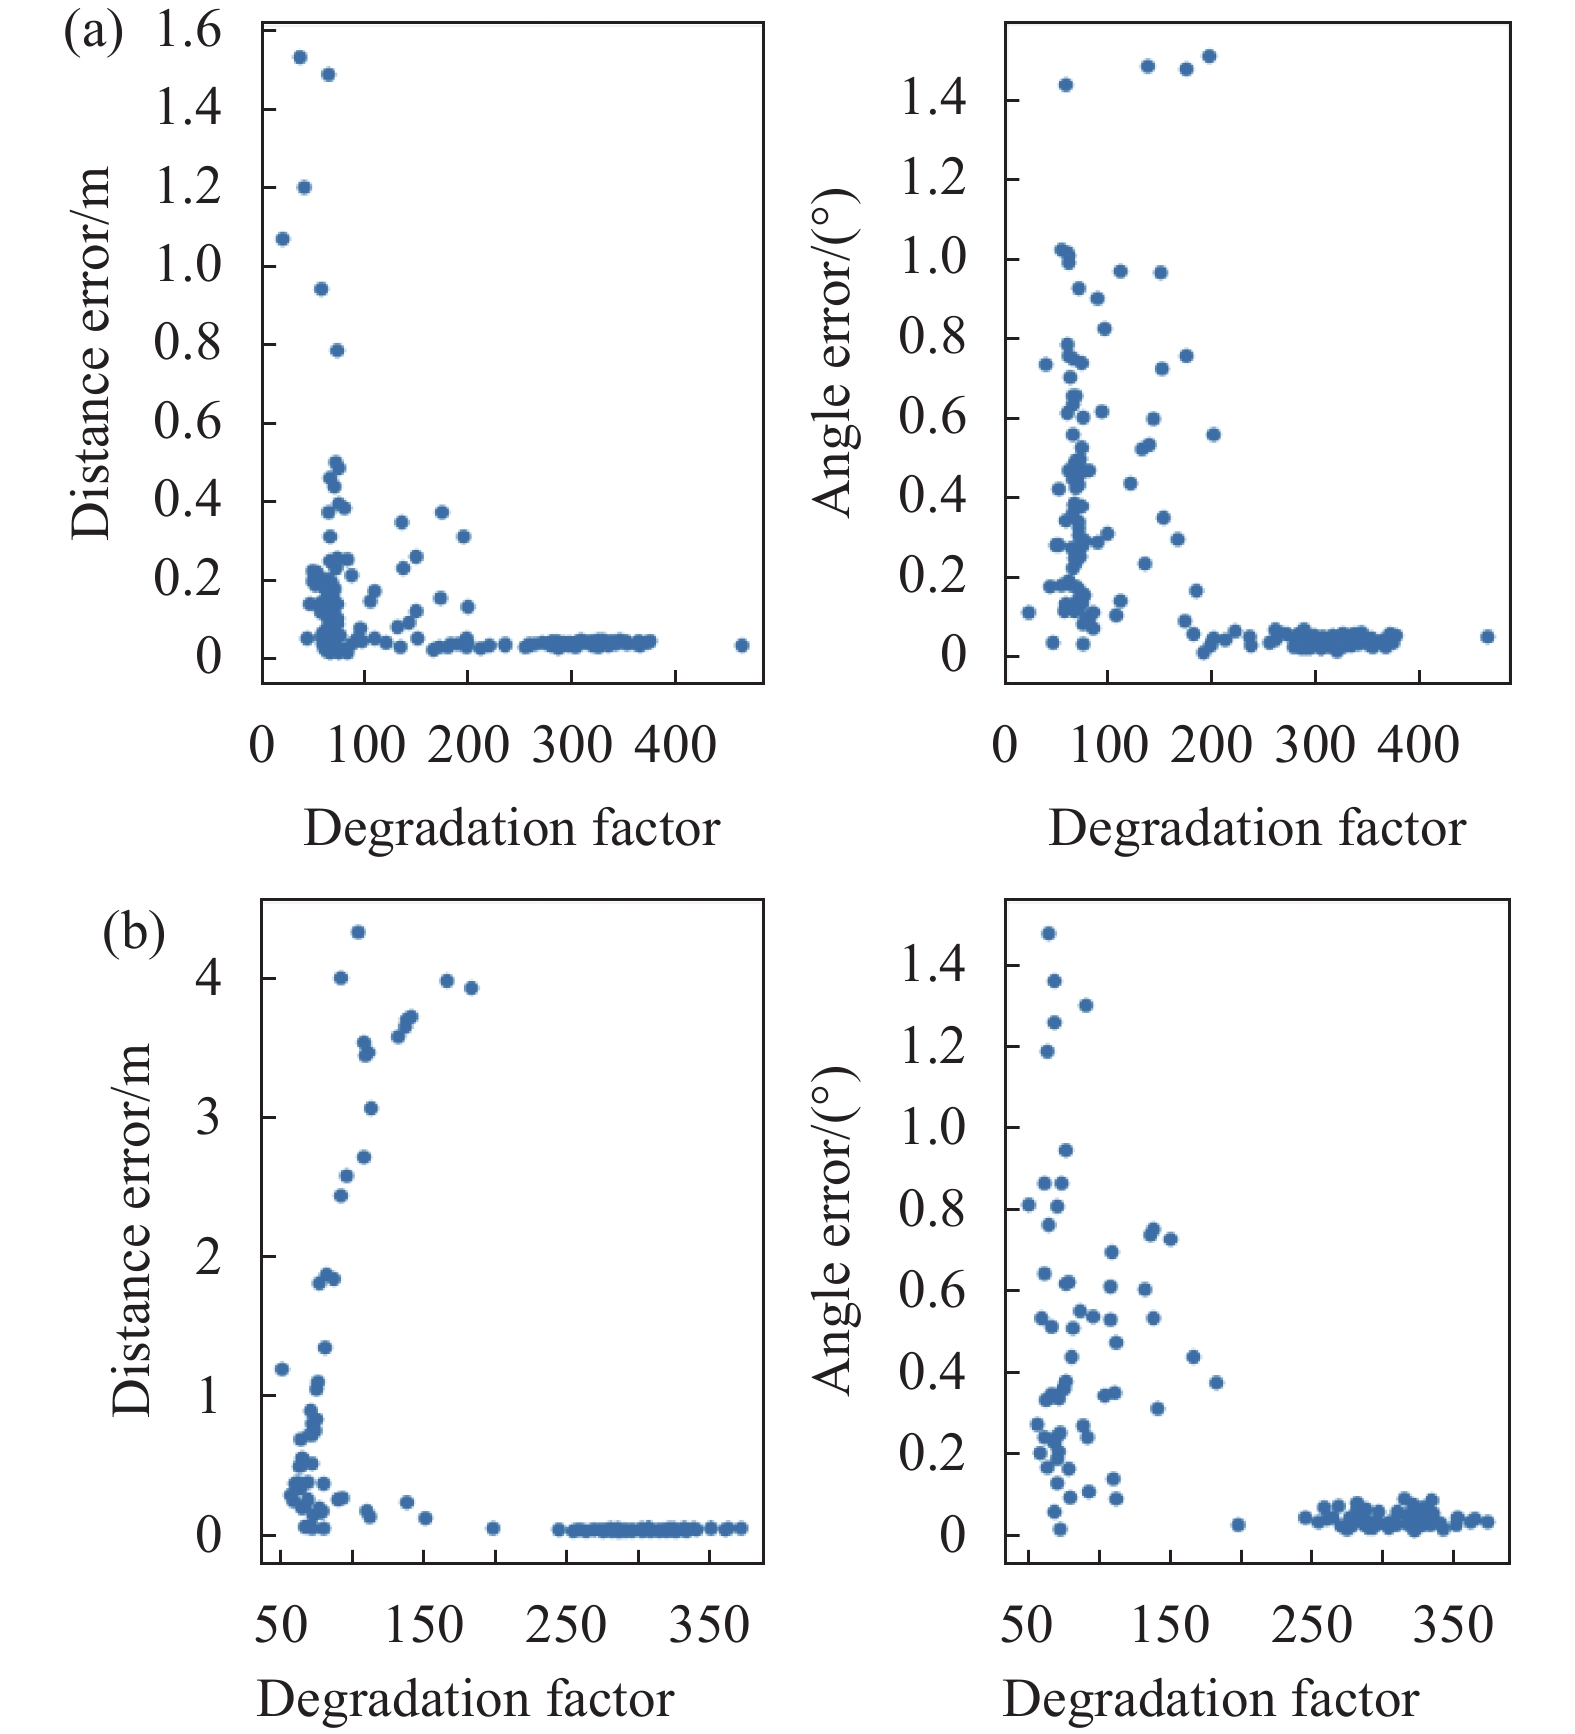
为了验证LiDAR前端部分退化因子对ICP结果精度的影响,在含有隧道场景的一段数据中对相隔距离为4 m和8 m的多对点云进行拼接,并对拼接结果的位移和角度误差进行评估。实验分为两组,不使用退化因子的ICP CUDA算法与使用退化因子的ICP CUDA算法。ICP CUDA算法的初值通过IMU和轮速计积分的方法得到。当两帧相隔距离为4 m时结果如图6所示,相隔距离为8 m时结果如图7所示。
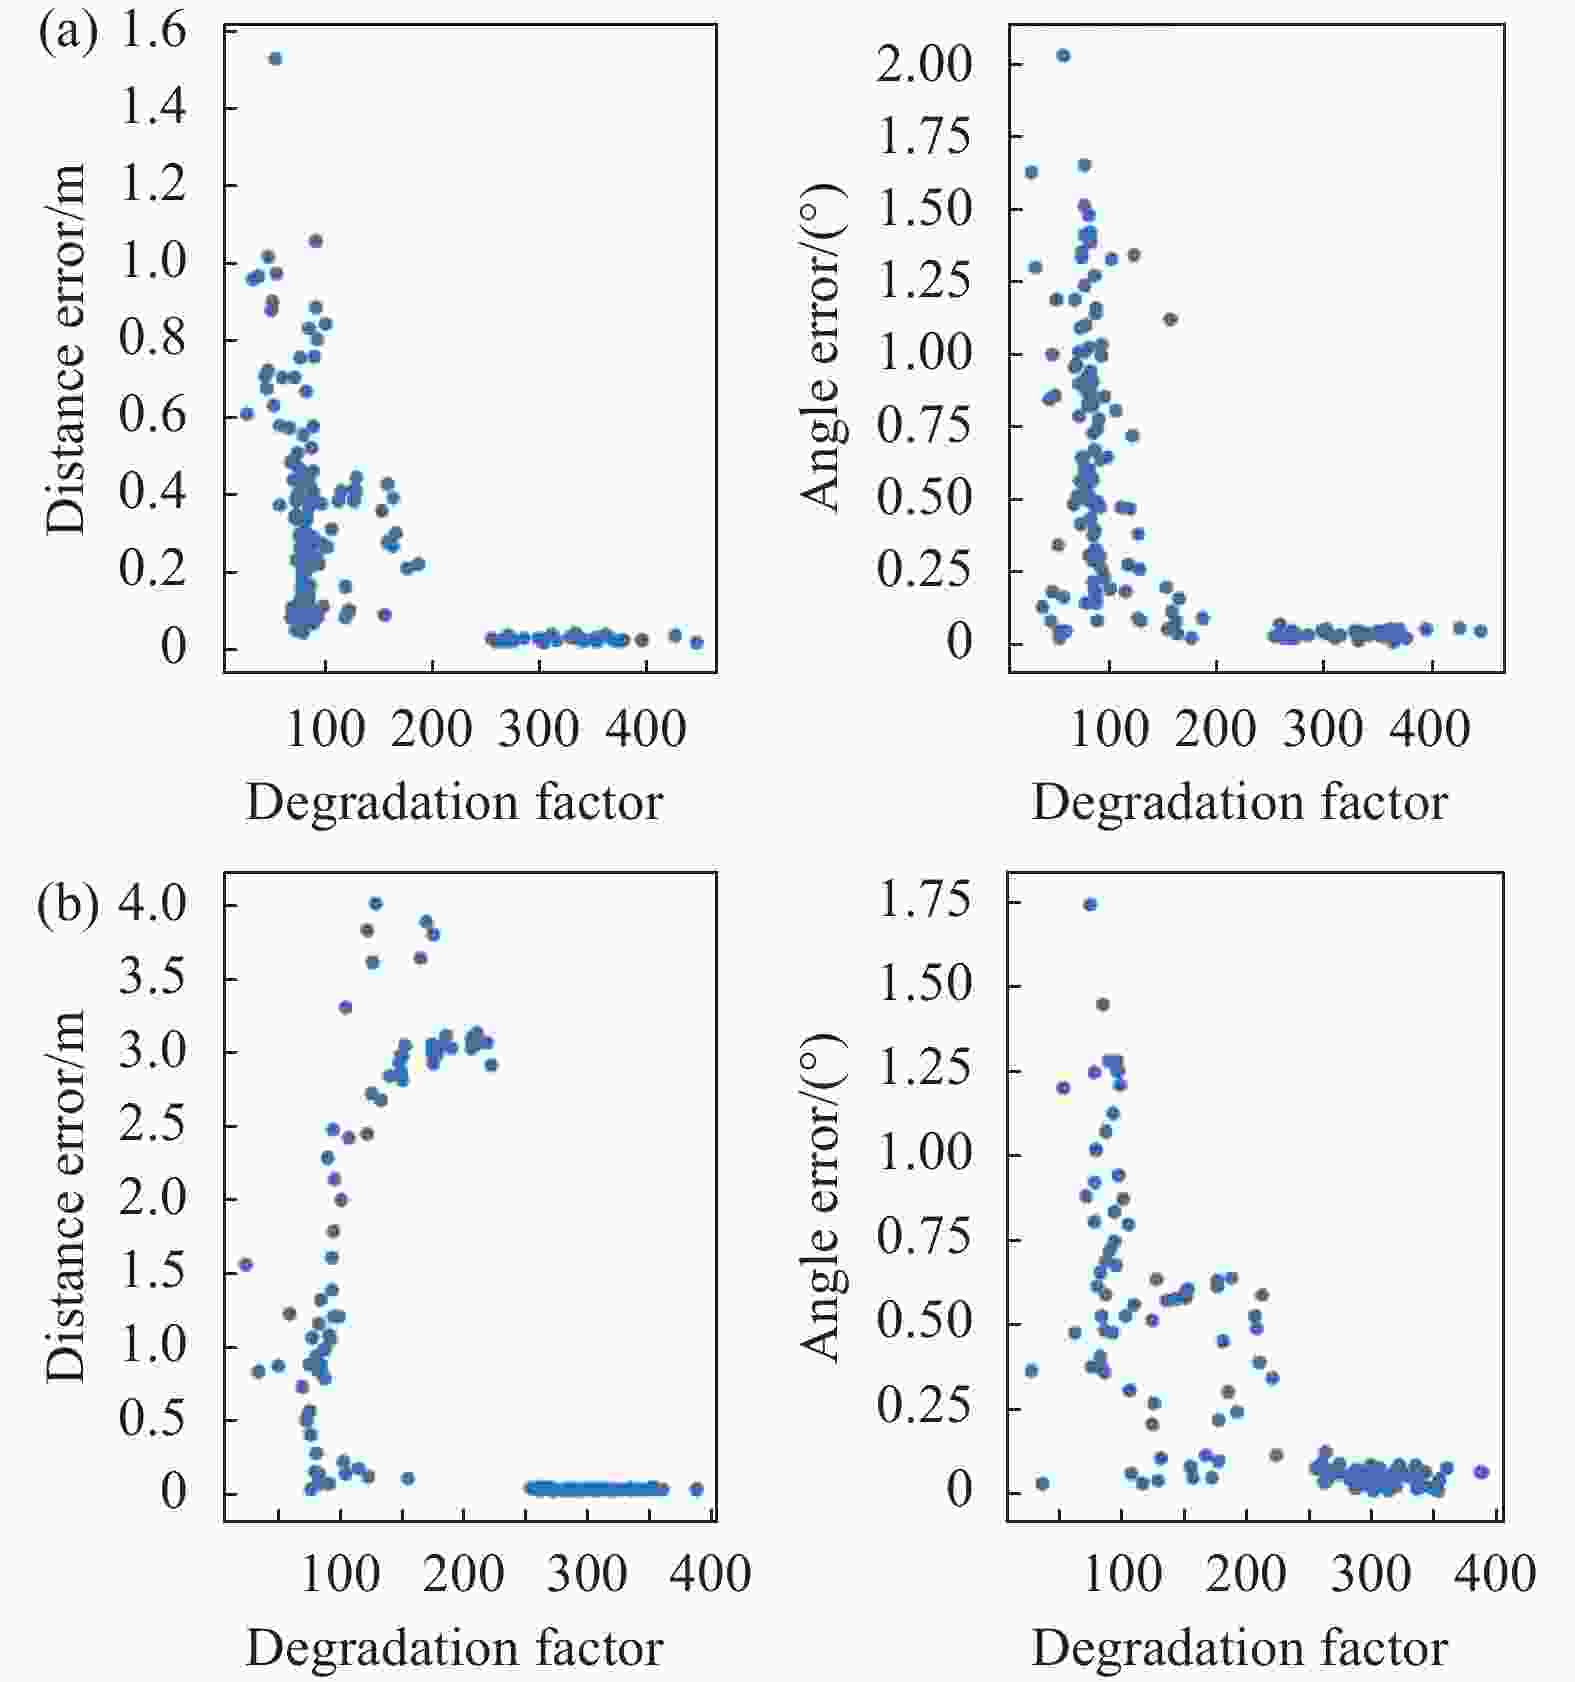
Figure 6. Distance and angle error of ICP CUDA to match point cloud pairs with 4 m distance. (a) Using degradation factor; (b) Calculating but not using degradation factor

Figure 7. Distance and angle error of ICP CUDA to match point cloud pairs with 8 m distance. (a) Using degradation factor; (b) Calculating but not using degradation factor
由上述4 m和8 m两组相隔距离实验结果可知,使用退化因子后ICP CUDA结果的平移误差最大值为1.6 m,而不用退化因子时平移误差最大值为4.0 m,可见使用退化因子时,平移误差得到显著减小,仅为前者的40%,这体现了使用退化因子的优势。而角度误差变化不大,这是因为退化的自由度主要在平移分量而非旋转分量。
-
为了评估系统的精度水平,并对比VIO、LIO和VLIO三种运行模式的精度,利用在城市场景中采集的三段时长为5 min的数据对系统初始化后输出的结果进行精度评估。参考KITTI[14]的量化方法,计算了里程计当前时刻到之前100 m范围内相对位移误差(Relative Translation Error,RTE),如图8、表1所示。

Figure 8. (a) Range map of 3 segments of unban scene data with a duration of 5 min. (b1)-(b3) Relative translation error results of 3 segments of urban scene data excluding initialization stage; (c1)-(c3) Path results, where GT is the ground truth. VLIO mode has an average value of 0.2%-0.5% which is better than VIO and LIO mode
Scene ID Mode Min RTE Max RTE Average RTE 1 VIO 0.46 3.02 0.88 LIO 0.60 2.95 0.91 VLIO 0.01 1.35 0.16 2 VIO 0.32 3.05 1.10 LIO 0.20 2.88 1.47 VLIO 0.02 1.86 0.34 3 VIO 0.19 1.56 0.79 LIO 0.79 2.97 1.21 VLIO 0.03 0.93 0.51 Table 1. Relative translation error statistics results of urban scenes
由上述城市场景精度结果可知,实验中系统VIO模式的平均相对位移精度在0.8%~1.1%之间;系统LIO模式的平均相对位移精度在0.9%~1.5%之间;系统完整模式在0.2%~0.5%之间,明显优于关闭LiDAR的VIO模式和关闭视觉的LIO模式,这也体现了多源数据融合对于提高系统精度的作用。
-
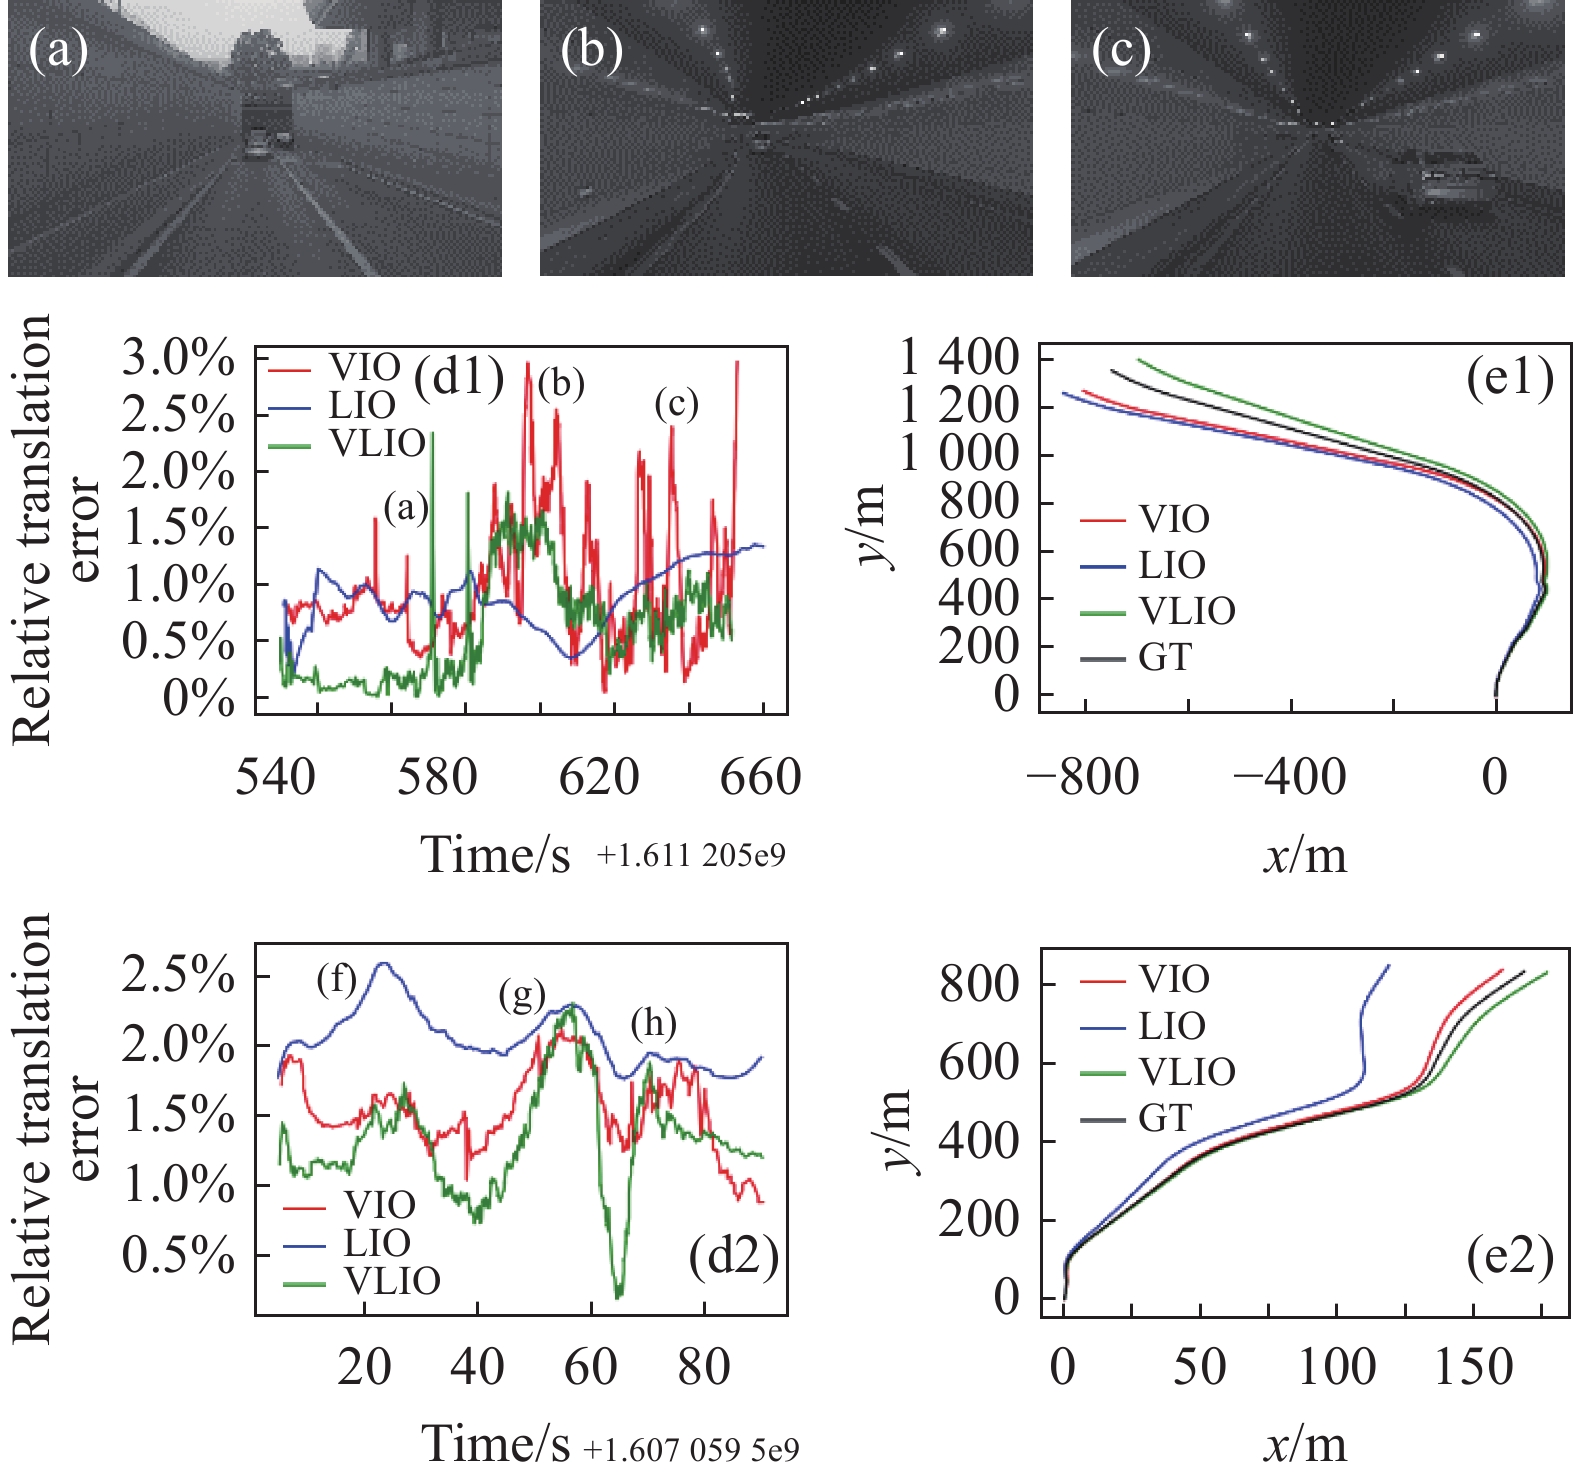
为了验证系统在LiDAR退化场景的精度水平,采集了两段包含隧道场景的数据,并分别对系统的VIO、LIO和VLIO模式进行精度评估,评估方法与城市场景相同,实验结果如图9、表2所示。

Scene ID Mode Min RTE Max RTE Average RTE 1 VIO 0.05 3.06 1.00 LIO 0.18 1.35 1.11 VLIO 0.002 2.33 0.61 2 VIO 0.88 2.14 1.52 LIO 1.76 2.60 2.05 VLIO 0.19 2.31 1.31 Table 2. Relative translation error statistics results of tunnel scenes

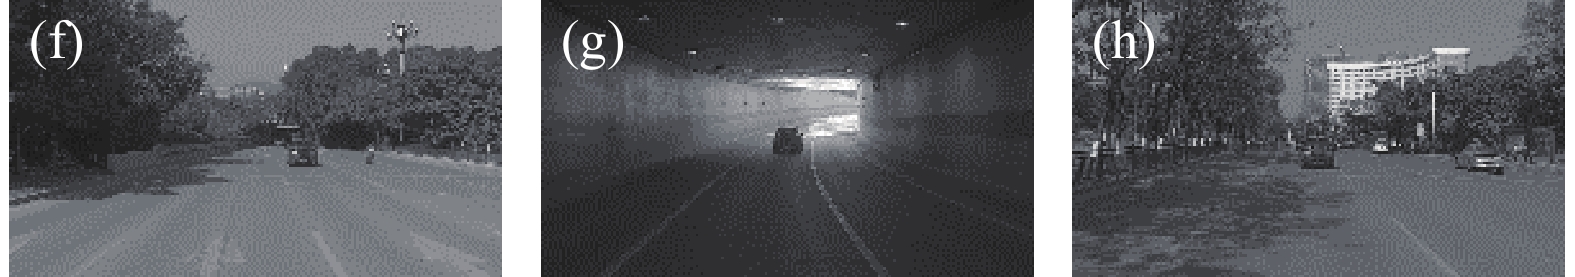
Figure 9. (d1)−(d2) Relative translation error results of 2 segments of tunnel scene data excluding initialization stage; (e1)−(e2) Path results, VLIO mode has lower accuracy than urban scene, but is better than VIO and LIO mode; (a)−(c), (f)−(h) Corresponding images
由上述两端包含隧道场景的精度结果可知,在隧道场景下系统的平均相对位移精度较城市场景有所下降,大概在0.6%~1.3%之间,但整体仍然优于关闭LiDAR的VIO模式的1.0%~1.5%和关闭视觉的LIO模式的1.1%~2.1%,这表明多源信息融合可以提高系统在LiDAR退化场景的精度。
-
文中提出了一种使用视觉、LiDAR和IMU进行信息融合的里程计,阐述了其前后端构建方法及系统的初始化方法,最后进行了LiDAR前端退化因子、城市场景、隧道场景的精度实验。实验表明:在城市场景系统中,平均相对位移精度可达到0.2%~0.5%,提出的的VLIO模式整体要比关闭视觉的LIO模式和关闭LiDAR的VIO模式精度高。因此,文中提出的使用视觉、LiDAR和IMU进行信息融合的里程计对于提高无人车定位建图的精度有着积极的意义,具有一定应用前景。
Research on a real-time odometry system integrating vision, LiDAR and IMU for autonomous driving
doi: 10.3788/IRLA20210651
- Received Date: 2021-09-09
- Rev Recd Date: 2021-10-12
- Accepted Date: 2021-11-02
- Available Online: 2022-08-31
- Publish Date: 2022-08-31
Fund Project:
China Huaneng Group Co., LTD. Headquarters Technology Project(HNKJ20-H27)
-
Key words:
- autonomous driving /
- LiDAR odometry /
- ICP /
- state estimation
Abstract: Visual/LiDAR odometry can estimate the process of an autonomous driving vehicle moving in multiple degrees of freedom based on sensor data and is an important part of the positioning and mapping system. In this paper, we propose a real-time tightly coupled odometry system that integrates vision, LiDAR, and IMU for autonomous driving vehicles and supports multiple running modes and initialization methods. The front end of the system applies a modified CUDA-based ICP for point cloud registration and traditional optical flow for vision feature tracking and uses the LiDAR points as the depth of visual features. The back end of the system applies a factor graph based on a sliding window to optimize the poses, in which state nodes are related to the poses from vision and LiDAR front end subsystems, and edges are related to preintegration of IMU. The experiments show that the system has an average relative translation accuracy of 0.2%-0.5% in urban scenes. The system with both LiDAR and visual front end subsystem is superior to a system that only contains one of them. The method proposed in this paper is of positive significance for improving the accuracy of the autonomous driving positioning and mapping systems.


 DownLoad: