


-
日常生活中由于受环境、光照、雾天的影响,拍摄到的图像存在图像亮度低、对比度不强的问题。图像增强是图像处理中的一个重要技术,通过图像增强方法可以提高图像的对比度,让图像中的物体更加清晰[1-5]。
目前,图像增强方法可以分为空域处理和变换域处理两大类。空域处理的增强方法主要包括直方图均衡化、反锐化掩膜、灰度变换等。如顾明等[6]提出了基于颜色空间转换的交通图像增强算法,该算法先对RGB三个通道进行对比度拉伸,然后再转换颜色空间到HSV,对V分量进行对比度自适应直方图均衡化操作,取得了良好的效果。Raju A等[7]利用直方图分析,并对直方图进行均衡化来提高图像的对比度。M.Mahamdioua等[8]提出了一种均值方差伽马校正图像增强方法,该方法将图像的均值与方差联合伽马校正对图像进行对比度提升,取得较好的效果。S.Huang等[9]提出了一种自适应伽马校正增强图像对比度的方法,该方法对图像的灰度直接进行处理,选取合适的伽马参数值,提高图像的对比度。基于变换域处理的方法主要是在图像的频域对图像进行处理。如曹风云等[10]以原始图像的显著图为引导,结合照度和色度图,作为图像融合的权重图;最后,根据权重图对两幅输入图像进行自适应加权求和,从而实现图像增强的目的。A. Loza等[11]提出了利用小波变换,根据小波系数在频域增强图像的方法;但基于变换域处理的方法算法复杂度高,计算量大。另外还有基于Retinex增强图像对比度的方法,如多尺度Reti-nex方法、基于双边滤波的Retinex方法、基于引导滤波的Retinex方法等[12-15],能够有效地增强图像的细节对比度,改善图像性能;但是经过Retinex方法处理后,图像有时候存在着颜色失真、光晕等问题,并且这些算法在计算复杂度上仍然有待提高。同时,为了提高图像算法的自适应性,一些学者将群智能算法引入图像增强算法中,提高图像的自适应性[16-17]。
文中提出了一种基于三角变换函数与改进随机漂移粒子群的图像增强算法,该算法利用计算复杂度低的灰度转换、三角函数变换、图像锐化、图像色彩恢复对图像进行对比度增强。利用改进随机漂移粒子群算法对图像增强中的参数进行智能寻优,提高算法的自适应性。
-
文中图像增强流程[18]主要分为四个步骤,首先将彩色图像转换为灰度图像,并且归一化到0~1区间。归一化的目的是为了使整个数据的分布范围满足后续增强函数处理的数据范围。令I表示转换后的灰度图像。为了增强图像的对比度,利用一个设计好的三角函数对灰度图的对比度进行调整,使低强度像素得到增强,高强度像素得到压缩。非线性三角变换函数如公式(1)所示:
式中:S是增强后的图像;c是一个常量,使得增强后像素在区间[0,1]内,c的值可以用公式(2)表示:
公式(1)中的η是一个自适应参数,采用sigmoid函数,该函数针对低强度像素和高强度像素均实用,如公式(3)所示:
于是
$ {I^\eta }(x,y) $ 可以用公式(4)表示:根据公式(1)可以自动调整图像中低亮度区域和高亮度区域像素,其中k是一个参数阈值,根据不同的情况设定,当I(x,y)>k时,该函数起到一个压缩图像明亮区域的作用;当I(x,y)<k时,该函数起到一个增强图像暗区域的作用。
为了让图像的细节信息得到增强,利用高通滤波器,采用Laplacian算子对图像进行处理。处理过程如公式(5)所示:
式中:h是Laplacian模板,如公式(6)所示:
式中:δ为平滑系数在区间[0,1]内,控制图像边缘的锐度。
灰度图像经过三角函数变换、高通滤波增强后,对灰度图像进行色彩的恢复,恢复过程如公式(7)所示:
式中:Iin为原始彩色图像;Iout为输出的增强彩色图像;j代表图像的R、G、B三个通道。最后对图像进行自动色调调整,得到最终输出图像。为了增强算法的自适应性,对图像增强过程中的k和δ参数利用改进随机漂移粒子群算法进行寻优。
-
粒子群算法是一种全局寻优算法,是一种受自然界鸟群启发的智能算法。其过程如下,首先初始化种群,设种群大小为np,粒子的索引为i,每个粒子的位置为Xi,每个粒子的速度为Vi,个体最优值为Yi,t代表当前迭代次数,f代表适应度值。个体最优的更新公式如公式(8)所示:
式中:
$ i \in N $ ,N=1,2,···,np,设全局最优粒子为$ Y_{i * }^t $ ,其中:速度更新公式如公式(10)所示,位置更新公式如公式(11)所示:
式中:C1,C2为加速系数;
$ \omega $ 为惯性权重;$ {R_1}_i^t $ 和$ {R_2}_i^t $ 为0~1的随机数。 -
随机漂移粒子群是受粒子群算法的轨迹分析和外电场中金属导体的自由电子运动的启发而提出来的,改善了原始粒子群算法容易陷入最优的缺点,提高了全局搜索能力。如果种群中每个粒子都收敛到它们各自吸引点,那么整个种群就是收敛的,粒子吸引点坐标如公式(12)所示:
式中:
$ \varphi _{i,j}^t $ 的计算如公式(13)所示:粒子群算法中粒子行为就如外部电场金属导体中漂移的电子,电子的速度可以表示为V=VT+VD,VT和VD分别表示电子随机速度和漂移速度,电子的运动就是寻找势能最小的位置。粒子的随机速度可以用公式(14)表示:
式中:
$ \alpha $ 是热系数;$ \delta _{i,j}^t $ 是遵从0~1之间的正态分布;$ C_j^t $ 是所有粒子最优位置的平均值,计算如公式(15)所示:粒子的另外一个漂移速度如公式(16)所示:
式中:
$\; \beta $ 为漂移系数,于是随机漂移粒子群的速度更新公式可以改成公式(17):随机漂移粒子群位置更新公式仍然与公式(11)一样。
-
改进随机漂移粒子群算法[19]是在随机漂移粒子群算法的基础上对其进行改进。首先在随机漂移粒子群算法中引入一个交叉变异算子改进种群的多样性,在交叉变异的过程中利用新种群位置和局部最优位置创建一个新的位置,过程如公式(18)所示:
交叉变异后,如果变异产生的新位置处的适应度值更优则代替原来的局部最优位置。经实验发现,利用个体最优值代替公式(14)中的粒子最优位置平均值,效果会更佳,于是将公式(14)改写成公式(19):
于是改进随机粒子群的速度更新公式可以用公式(20)表示:
-
针对图像增强过程中的k和δ参数选择问题,利用改进随机漂移粒子群算法对这两个参数进行智能寻优。
-
文中利用图像信息熵E1和图像的标准差E2构造适应度函数如公式(21)所示:
式中:f为适应度值;0.01为平衡信息熵和标准差的一个系数。图像的熵值越大,表明图像的信息越多,图像的标准差越大,表明图像越丰富,对比度越大。图像信息熵的计算如公式(22)所示:
式中:p(i)表示灰度值为i的像素所占的比例;L=256为图像灰度级数目。图像的标准差计算如公式(23)所示:
式中:M,N代表图像的尺寸;u代表图像的像素的平均值;Iij代表图像的像素值。
-
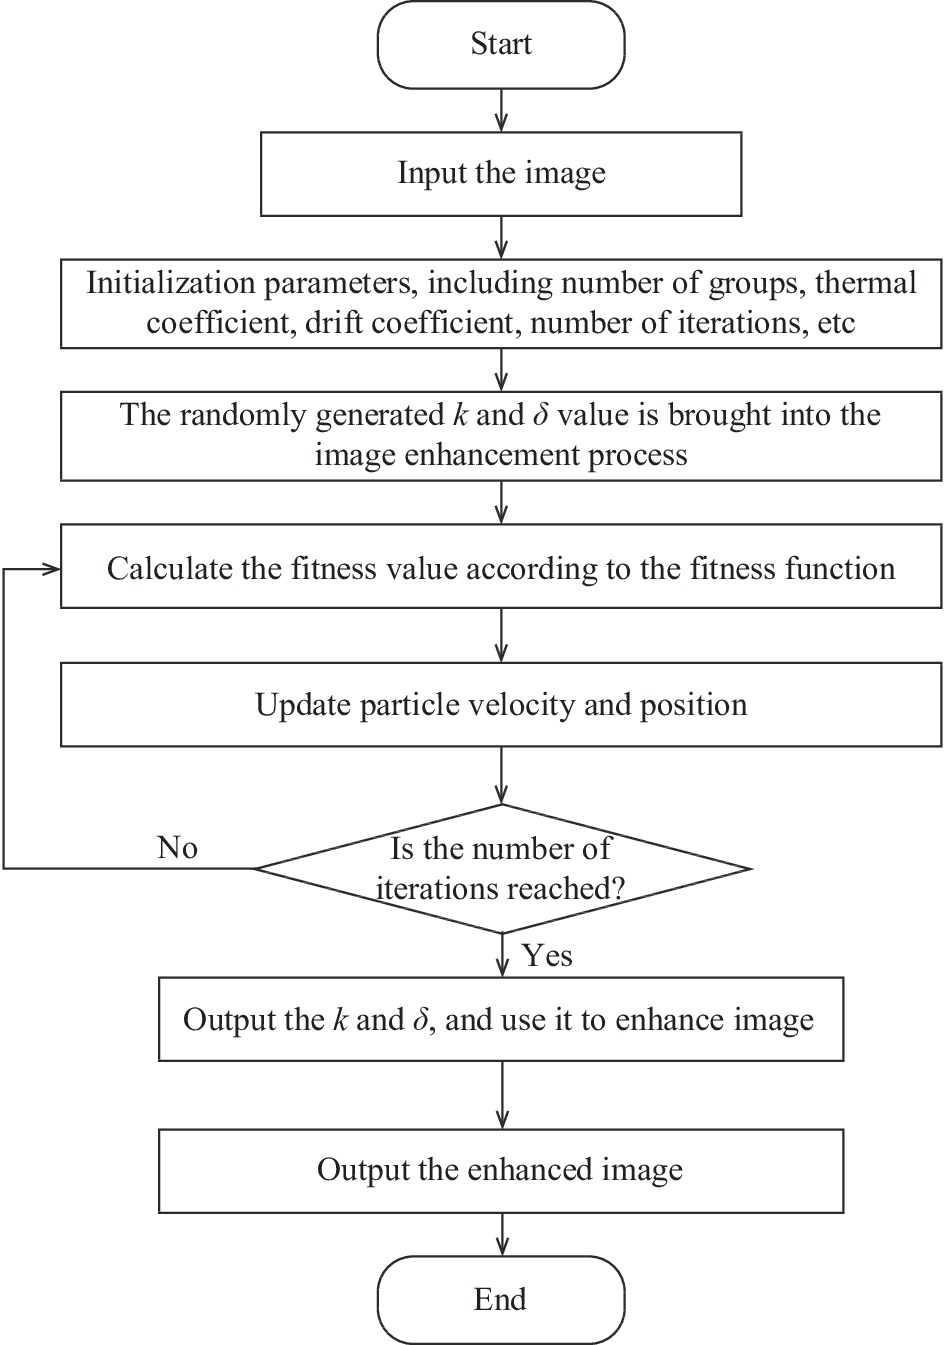
基于三角函数变换与IRDPSO优化的图像增强算法流程图如图1所示。

Figure 1. Flow chart of algorithm
算法的具体步骤如下:
(1) 输入图像,初始化参数,包括群体个数、热系数、漂移系数、迭代次数等;
(2) 将随机产生的k和δ值代入图像增强流程中,根据适应度函数计算适应度值;
(3) 每个粒子与个体最优粒子、全局最优粒子比较,记录个体最优位置与全局最优位置;
(4) 更新粒子速度与位置;
(5) 是否达到结束条件,如果达到条件,则结束,否则重复步骤(2)~(4);
(6) 将得到的k和δ的最优参数代入图像增强流程得到最终增强图像。
-
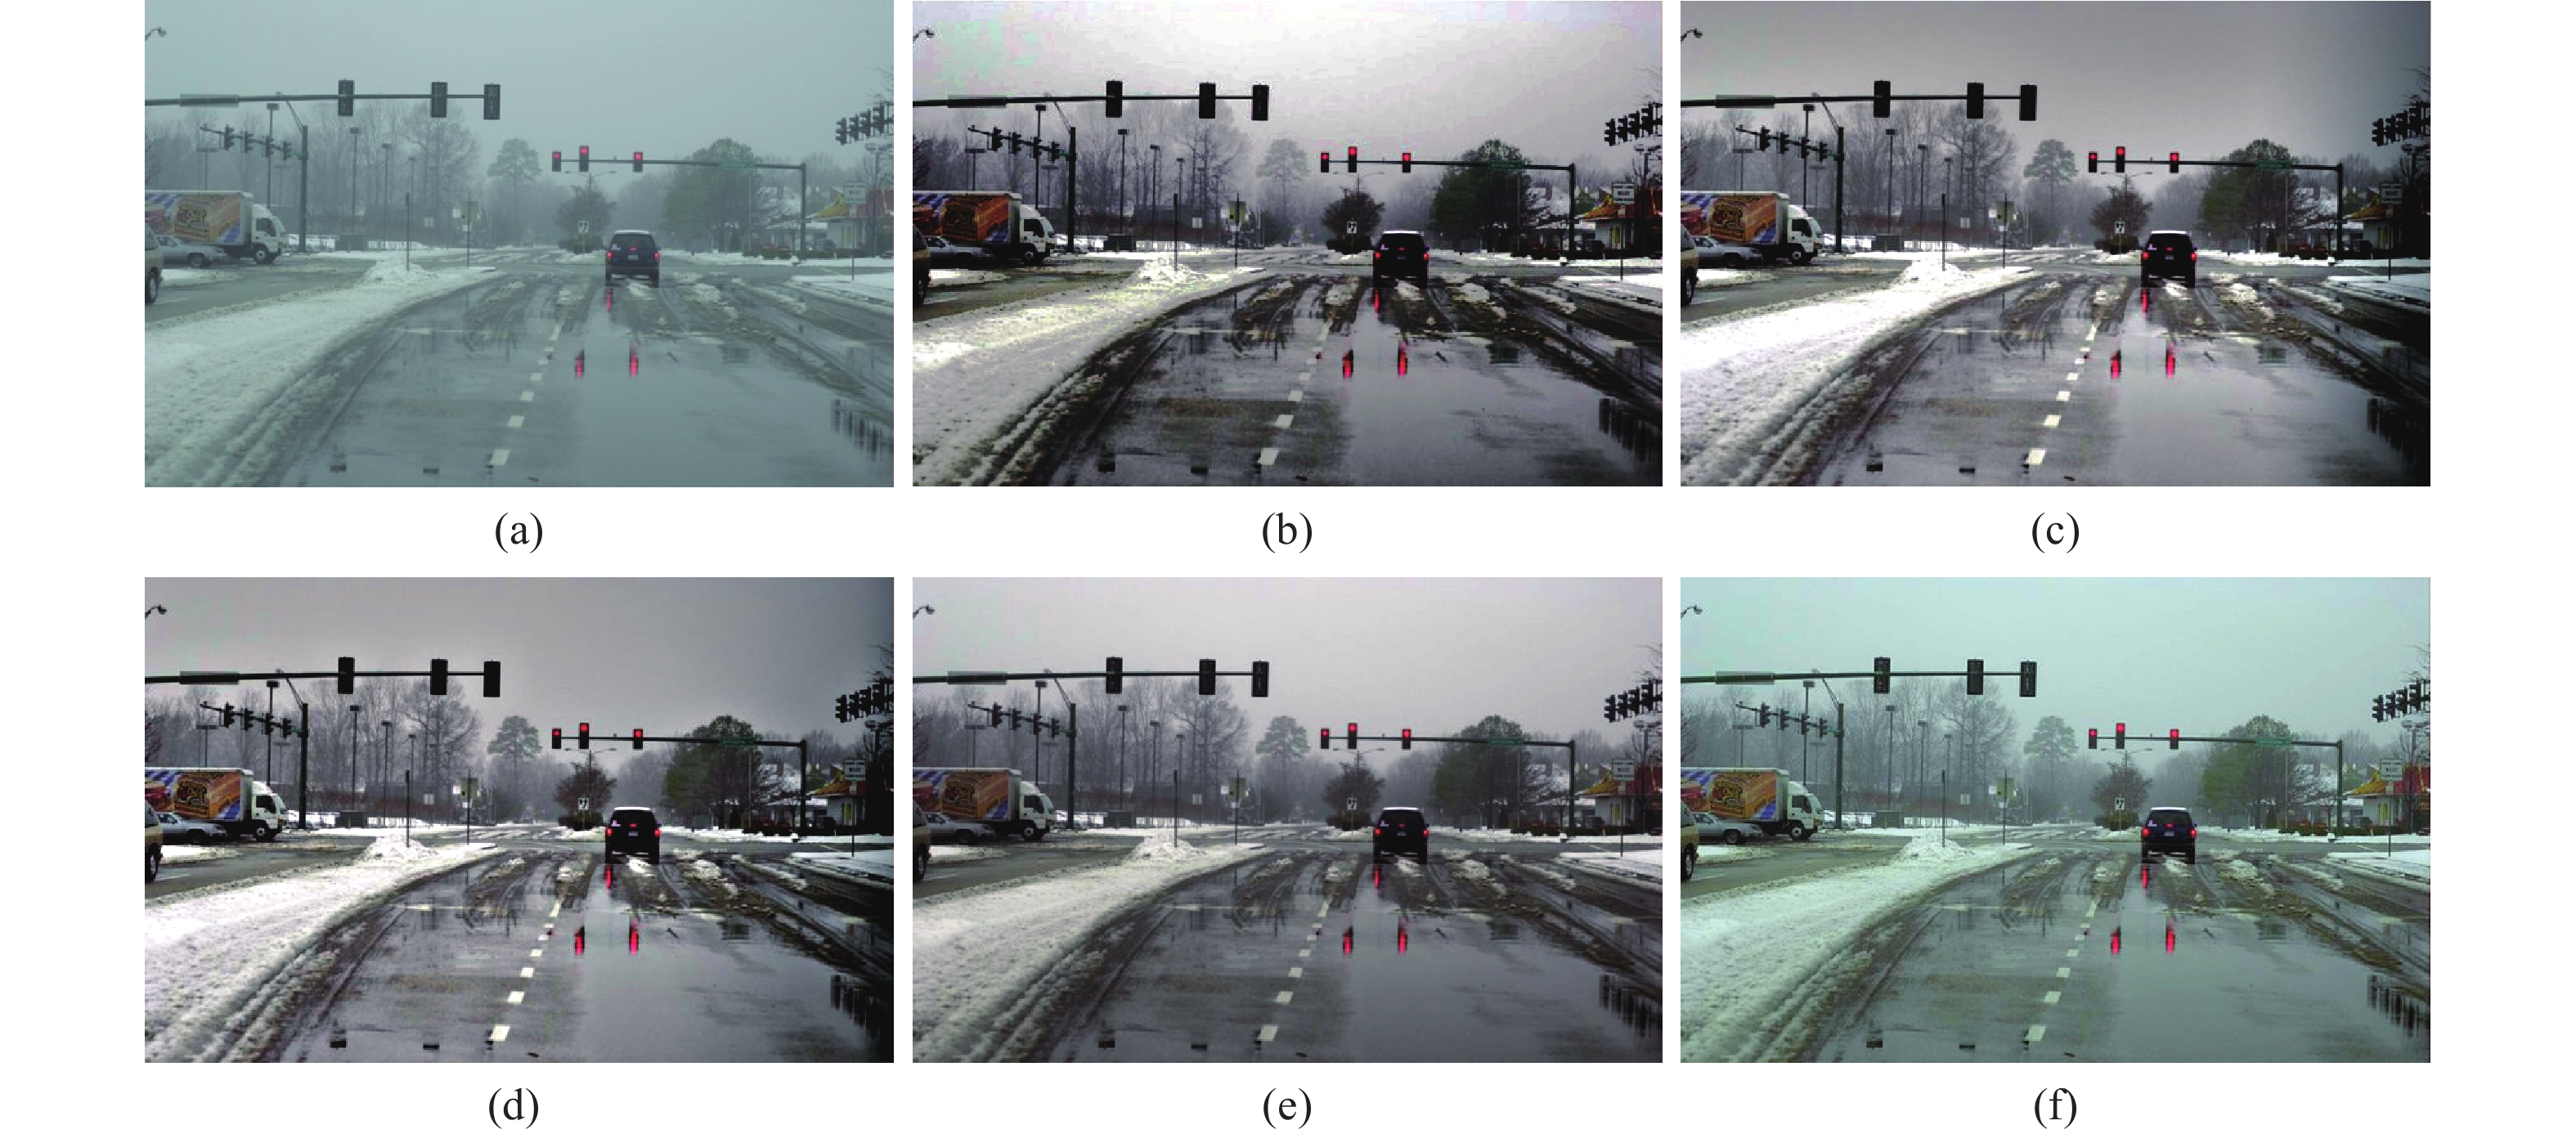
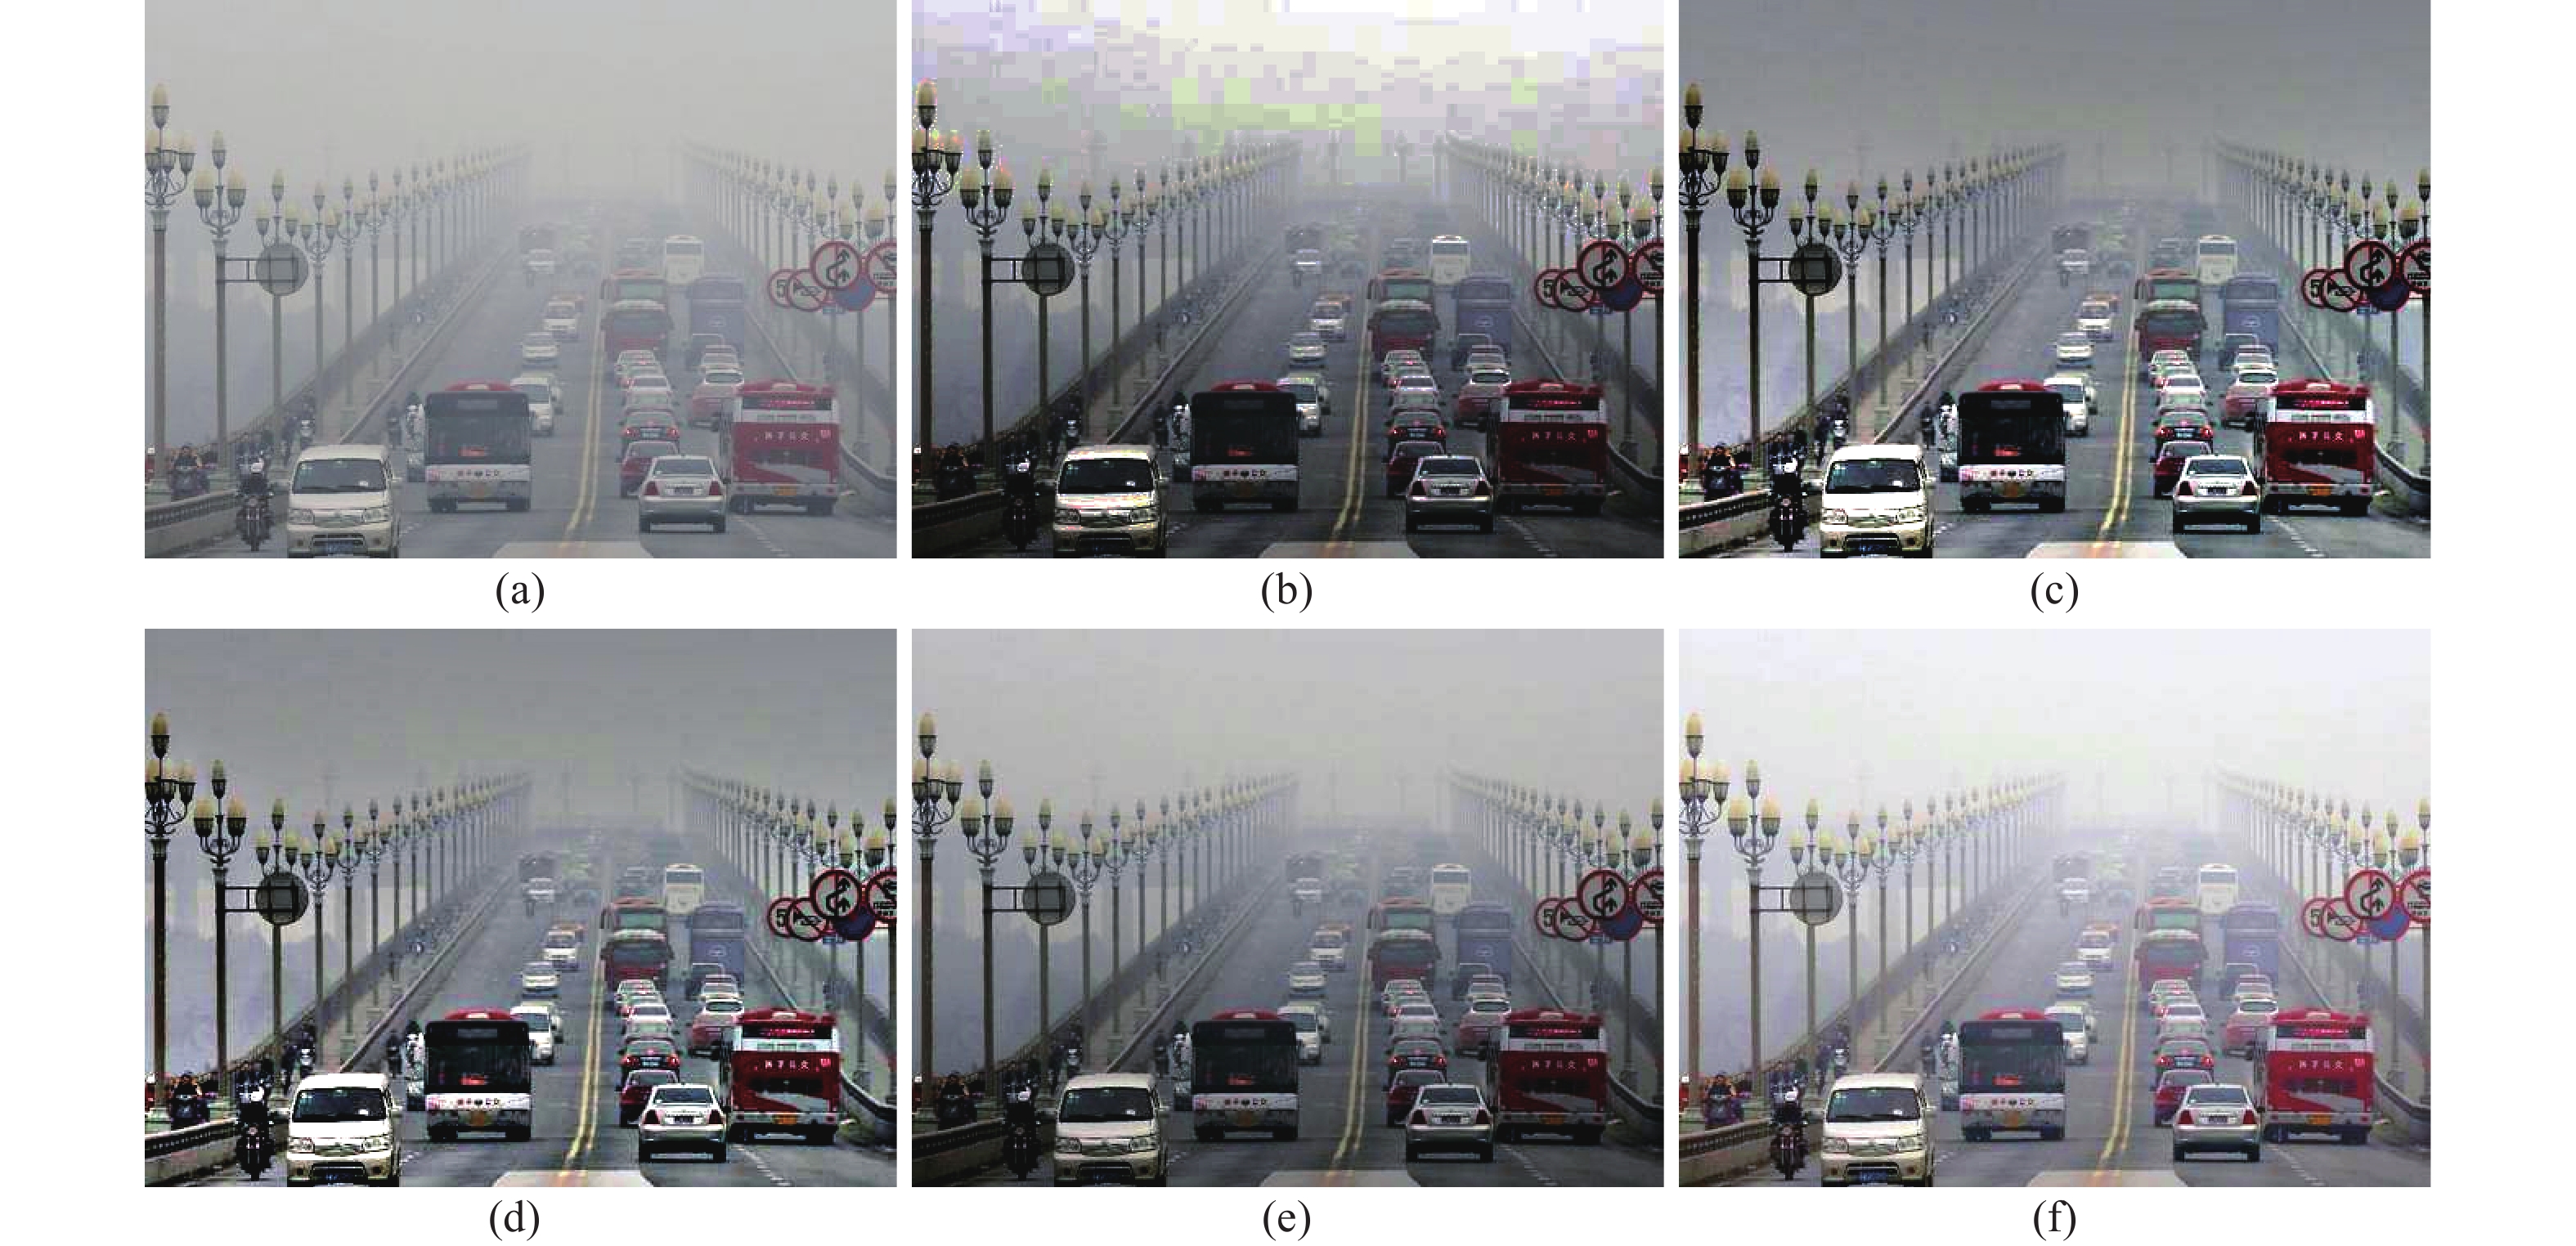
为了验证文中算法的可行性,在Matlab2014a,Windows7、处理器主频为 2.1 GHz,内存2G 的测试平台上运行。文中选用四张彩色图像作为实验图像,各自命名为图A、B、C、D。将文中算法与直方图均衡化、SSR算法(Single Scale Retinex)、MSRCR算法(Muti-Scale Retinex with Color Restoration)、参考文献[9]中AGCWD算法做比较。SSR算法的高斯环绕尺度为80,MSRCR的高斯环绕尺度为1 580 200;文中改进随机漂移粒子群种群数量为30,最大迭代次数为50。图2~图5分别为图A、B、C、D的实验结果,其中(a)、(b)、(c)、(d)、(e)、(f)分别代表原始图像、直方图均衡化的结果、SSR算法结果、MSRCR算法结果、参考文献[9]算法结果、文中算法结果。为了定量衡量算法的性能,利用图像信息熵、标准差和平均值作为衡量标准。图像信息熵越大,表明图像内容越丰富,标准差越大,代表图像的对比度越强,图像的平均值表明图像的亮度。表1~4分别为图A,B,C,D的实验数据。

Figure 2. Experimental results of image A
Image B Original image HE SSR MSSCR AGCWD[9] Proposed algorithm Information Entropy 6.0087 5.5465 7.0987 7.0575 5.7685 7.1085 Standard deviation 37.4061 74.3707 44.4787 44.1266 42.8914 51.9358 Mean value 26.5739 127.6286 123.8615 123.5788 122.5611 70.8161 Table 2. Experimental data of image B

Figure 3. Experimental results of image B
Image C Original image HE SSR MSSCR AGCWD[9] Proposed algorithm Information Entropy 6.0518 5.6417 7.2255 7.1351 6.2137 7.3454 Standard deviation 33.4897 74.3102 44.7472 44.0296 37.1188 57.5542 Mean value 25.9043 127.6572 124.1044 123.9515 123.3107 73.5227 Table 3. Experimental data of image C

Figure 4. Experimental results of image C

Figure 5. Experimental results of image D
Image A Original image HE SSR MSSCR AGCWD[9] Proposed algorithm Information entropy 6.9521 5.954 6 7.511 9 7.568 7 7.382 1 7.2897 Standard deviation 35.626 5 74.985 1 59.727 8 59.495 4 63.164 54.8634 Mean value 146.758 9 127.494 2 128.299 6 128.676 127.428 1 145.1314 Table 1. Experimental data of image A
从图A的实验结果和表1数据来看,五种算法均能取得较好的效果,图像对比度均得到了增强,但是文中算法整体亮度更大,图形的平均值为145.1314,与原始图像的平均值146.7589更加接近,颜色更加鲜艳和柔和。从图B和图C的实验结果来看,直方图均衡化法、SSR算法、MSSCR算法的图像颜色均出现了严重的失真,参考文献[9]算法的图像颜色失真稍微次之,而文中算法在保留颜色的同时,大大提高了图像的对比度。从表2、3中的数据可以看出,文中算法的信息熵值分别为7.1085和7.3454,均高于其他四种算法,文中标准差值分别为51.9358和57.5542,高于SSR算法、MSSCR算法和参考文献[9]算法。从图D的实验结果来看,五种算法均对图像的对比度起到了增强作用,从直观效果来看,文中算法的亮度更高,更加贴近原始图像的亮度。从表4中的数据来看,文中算法的信息熵值为7.1776,仍然最高,标准差值高于SSR算法、MSSCR算法和参考文献[9]算法,亮度值最高。综合四张图像的实验结果来看,文中算法相对其他算法具有明显的优势,适用于不同的场景,颜色失真小,对比度增强效果好。
Image D Original image HE SSR MSSCR AGCWD[9] Proposed algorithm Information Entropy 6.6255 5.8916 7.0116 7.0162 7.0215 7.1776 Standard deviation 35.1738 74.9857 53.9303 54.9177 62.9009 60.4586 Mean value 162.1123 127.6125 128.3536 128.6848 127.9938 178.8673 Table 4. Experimental data of image D
-
图像增强是图像处理的一个重要手段,文中提出了一种基于三角函数变换与改进随机漂移粒子群算法的图像增强算法。该算法简单,复杂度低,利用灰度转换、灰度三角函数变换、图像锐化、图像色彩恢复对图像进行对比度进行增强,并且引入改进随机漂移粒子群算法对图像增强中的参数进行寻优,提高算法自适应,减少人为参数的设定。将文中算法与其他四种算法进行比较,实验结果表明,文中算法的图像增强效果比其他四种算法好,色彩失真小,图像细节更加丰富,具有较强的实用性。针对该算法,未来可以进行更加深入的研究,如针对图像增加的函数,是否能够更加优化,采用更加低复杂度的函数。针对寻优阶段,能否采用并行的思想,加快整个算法的寻优速度。
Image enhancement algorithm based on trigonometric function transformation and IRDPSO optimization
doi: 10.3788/IRLA20210709
- Received Date: 2021-09-26
- Rev Recd Date: 2021-10-08
- Publish Date: 2022-08-31
Fund Project:
Fund Project of Hubei Provincial Health Commission(WJ2021H090)
-
Key words:
- image enhancement /
- trigonometric transform function /
- Laplacian operator /
- random drift particle swarm /
- image contrast
Abstract: In the complex environment, such as cloudy days, foggy days, night, weaker light illumination and other conditions, the image has a lack of contrast, and the whole is dark. In view of this problem, an image enhancement algorithm based on trigonometric function transformation and IRDPSO is proposed. The image enhancement method mainly consists of four steps. First, the color image is converted to a gray image. Then, the contrast of the grayscale image is improved by trigonometric function transformation. Then, the image is enhanced by the Laplacian operator. Finally, a color restoration process is applied to the image. Aiming at the parameters in trigonometric function transformation and the parameter selection problem of the Laplacian operator, the improved random drift particle swarm optimization (IRDPSO) algorithm is combined with an image enhancement algorithm, the fitness function is constructed by information entropy and image standard deviation, and the parameters are optimized. The proposed algorithm is compared with four other algorithms. The experimental results show that the proposed algorithm is simple, the image information entropy is enhanced, the standard difference is large, the color distortion of the image is small and the enhancement effect is better than that of the other algorithms, and the quality and contrast of the image are improved.


 DownLoad: