


-
自工业革命以来,地球的温室效应和全球变暖日趋严重[1],气候变化是全世界共同面临的重大挑战。作为温室气体的主要贡献者CO2,其浓度监测已引起大气科学、环境科学、物理学等相关领域专家学者的广泛关注[2]。利用遥感探测技术开展CO2气体高精度定量监测,尤其利用星载CO2成像光谱仪进行监测,不仅可以实现图谱合一,而且具有高空间分辨率、高时间分辨、非接触和长期监测等优点,星载CO2成像光谱仪已成为获取大气CO2浓度数据的重要手段之一。为了实现覆盖范围广、CO2浓度柱高精度反演,星载CO2成像光谱仪正趋向于长狭缝、高光谱分辨率和高灵敏度探测需求的发展[3-6]。
目前,国外具有代表性的星载Offner成像光谱仪有EO-1卫星搭载的Hyperion[7]、欧洲航天局(ESA)和美国宇航局(NASA)联合研制搭载于“罗塞号”的VIRTIS-M[8]、美国JPL实验室研制的月球矿物质绘图仪M3搭载于印度的“月船一号”对月球表面进行探测[9]、NASA发布的监测地球海岸和空气污染环境状况的多缝Offner光谱仪MOS[10]。Hyperion的工作波段为400~1000 nm,900~2500 nm,光谱分辨率为10 nm;VIRTIS-M的工作波段为240~1040 nm,光谱分辨率5 nm;M3的工作波段为430~3000 nm,光谱分辨率为10 nm;MOS的工作波段为345~900 nm,光谱分辨率为0.5 nm。近20年,国内对Offner光学成像系统的研究逐渐增多,并逐步应用于卫星有效载荷,服务于大气环境监测和航天遥感探测。其中,2010年苏州大学研制出光谱范围为400~1000 nm的Offner光栅光谱仪,其F数为2.3,狭缝的长度是12 mm,光谱分辨率约为0.2 nm[11]。2016年,苏州大学基于Offner初始结构针对宽视场问题进行研制[12],其光谱范围是400~780 nm,F数为2.4,狭缝长度为13 mm,光谱分辨率为1.6 nm。目前的Offner光栅光谱仪还存在狭缝小、相对孔径较小,光谱分辨率不高,难以获取高分辨率图谱图像等问题。因此,为了获取更多地面目标的空间信息和光谱信息,同时快速准确地获取CO2气体分子吸收光谱,提高CO2气体分子浓度廓线的反演精度[13],文中针对应用于长狭缝、大孔径、高分辨率、高信噪比的光学系统提出了新的设计方案。
通过分析现有Offner成像光谱仪相关设计,针对大视场、长狭缝和大相对孔径的成像光谱光学系统,文中通过使子午线与弧矢线在中心波长处相切的方法,消除凸面光栅色散引起的系统边缘视场像散,从而提高入射光线在整个光谱范围内的利用率。为满足星载CO2成像光谱仪高分辨率、高灵敏度和长狭缝的需求,基于笔者提出的方案,设计了F数为2.5,狭缝尺寸30 mm的星载CO2成像光谱仪光学系统,由于短波红外波段可以更敏感的探测近地面CO2气体浓度的变化,其设计谱段范围在 1594~1619 nm,并利用拓展像元的策略,提高系统信噪比。通过光学设计软件对该系统进行分析,满足星载CO2成像光谱仪的设计指标要求。
-
成像光谱仪的光学系统由前置望远系统和后置分光系统两部分组成,分光系统是成像光谱仪的核心部分,它直接决定了成像光谱仪的光谱特性。Offner成像光谱仪是应用推扫式成像技术建立的一类空间扫描光谱仪,其Offner型光谱成像系统的结构是基于凸面光栅的同心光学系统,可以校正三级的赛德尔像差,系统具有良好的光学性能[14-16]。
-
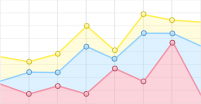
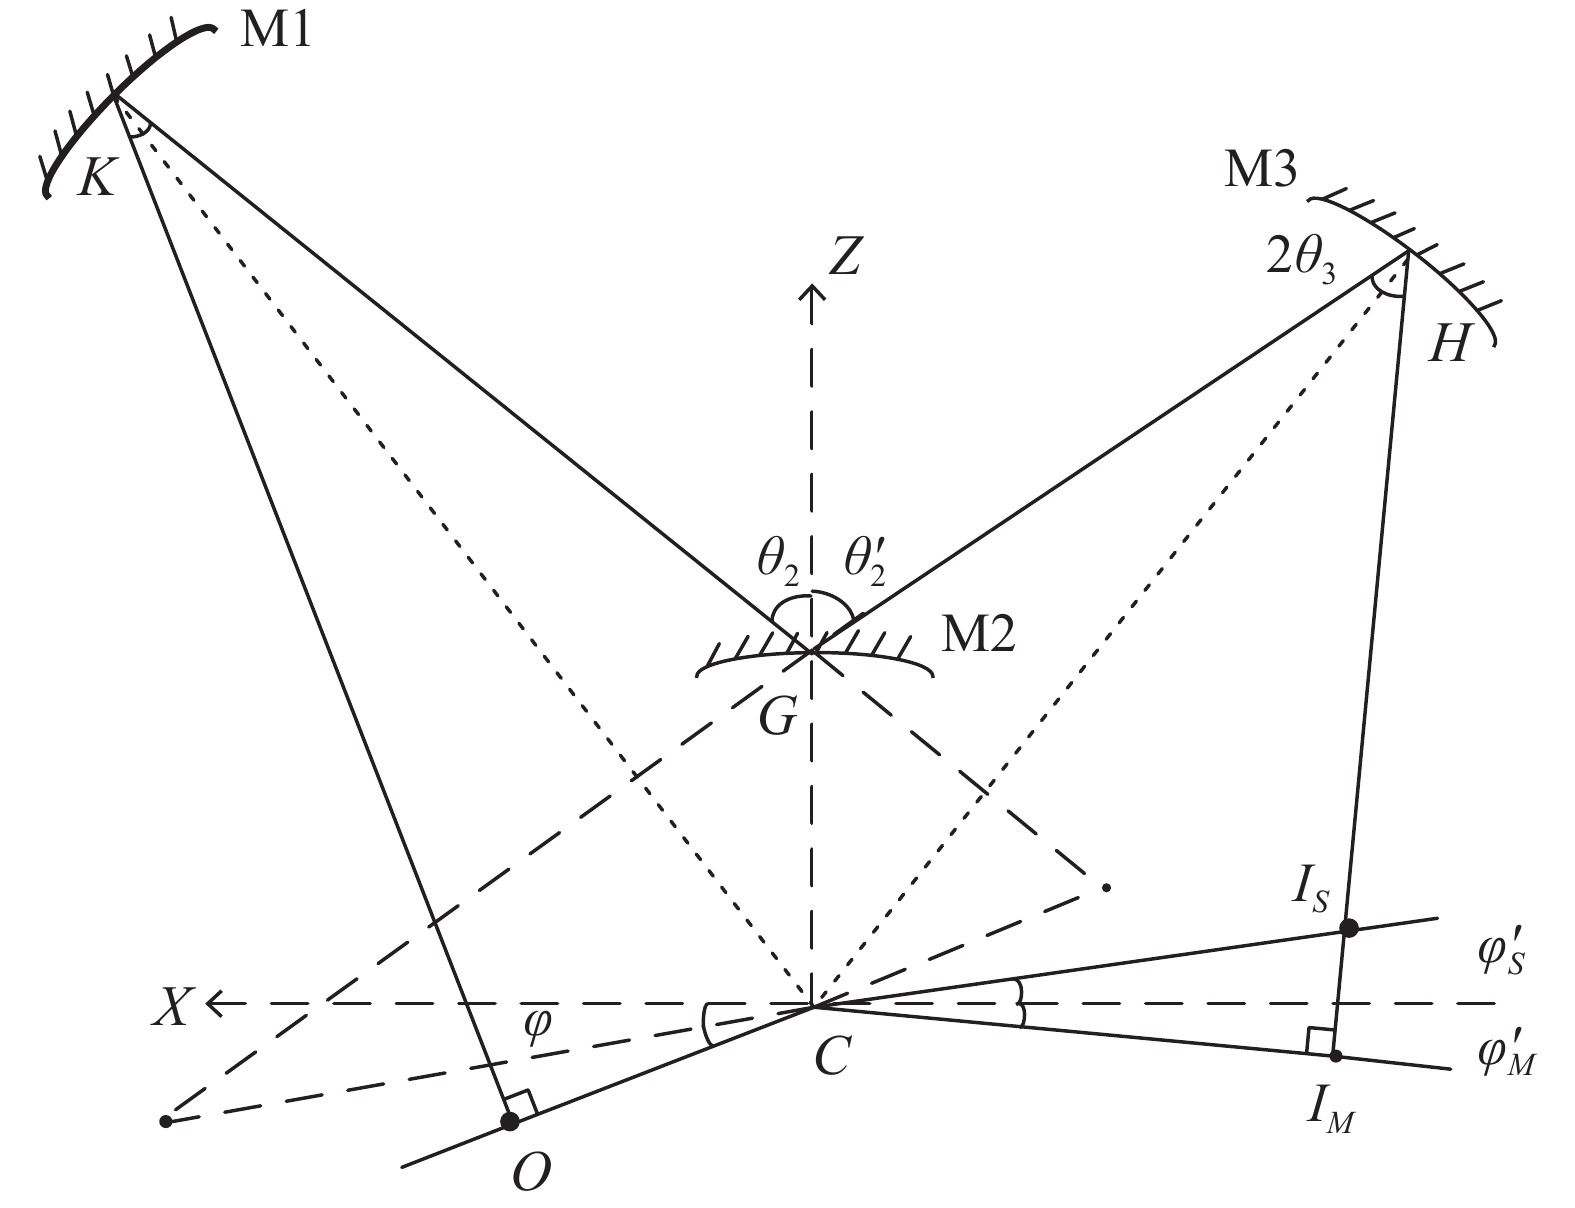
如图1所示,在Offner光栅光谱仪成像的原理模型里,3个共曲率中心的反射镜其中心与坐标系的原点重合。

Figure 1. Schematic diagram of Offner grating spectrometer
图中,
$ {R_2} $ 为凸面光栅$ {\text{M2}} $ 的曲率半径,$ {\theta _1} $ 和$ {\theta _3} $ 为光线在$ {\text{M1}} $ 、$ {\text{M3}} $ 的入射角和出射角,两球面反射镜的入射角等于出射角,$ {\theta _2} $ 和$ {\theta '_2} $ 为光栅的入射角和衍射角,$ {d_1} $ 为$ {\text{M1}} $ 、$ {\text{M2}} $ 两镜间距,$ {d_2} $ 为$ {\text{M2}} $ 、$ {\text{M3}} $ 两镜间距。对于该系统需要确定$ {R_1} $ 、$ {R_2} $ 、$ {R_3} $ 、$ {\theta _1} $ 、$ {\theta _2} $ 、$ {\theta '_2} $ 、$ {\theta _3} $ 、$ {d_1} $ 、$ {d_2} $ 这9个参数就可以得到相应的光学初始结构。由于凸面光栅的色散性使分光系统存在残余彗差和像散。如图2、图3所示分别为狭缝上任一点发出光束在子午面和弧矢面追迹图。为了校正因狭缝尺寸较大,凸面光栅色散引起系统边缘的视场像散,通过使子午线与弧矢线在中心波长
$ \overline \lambda $ 处相切的方法,来提高入射光线在整个光谱范围内的利用率[17]。即
Figure 2. Meridian imaging
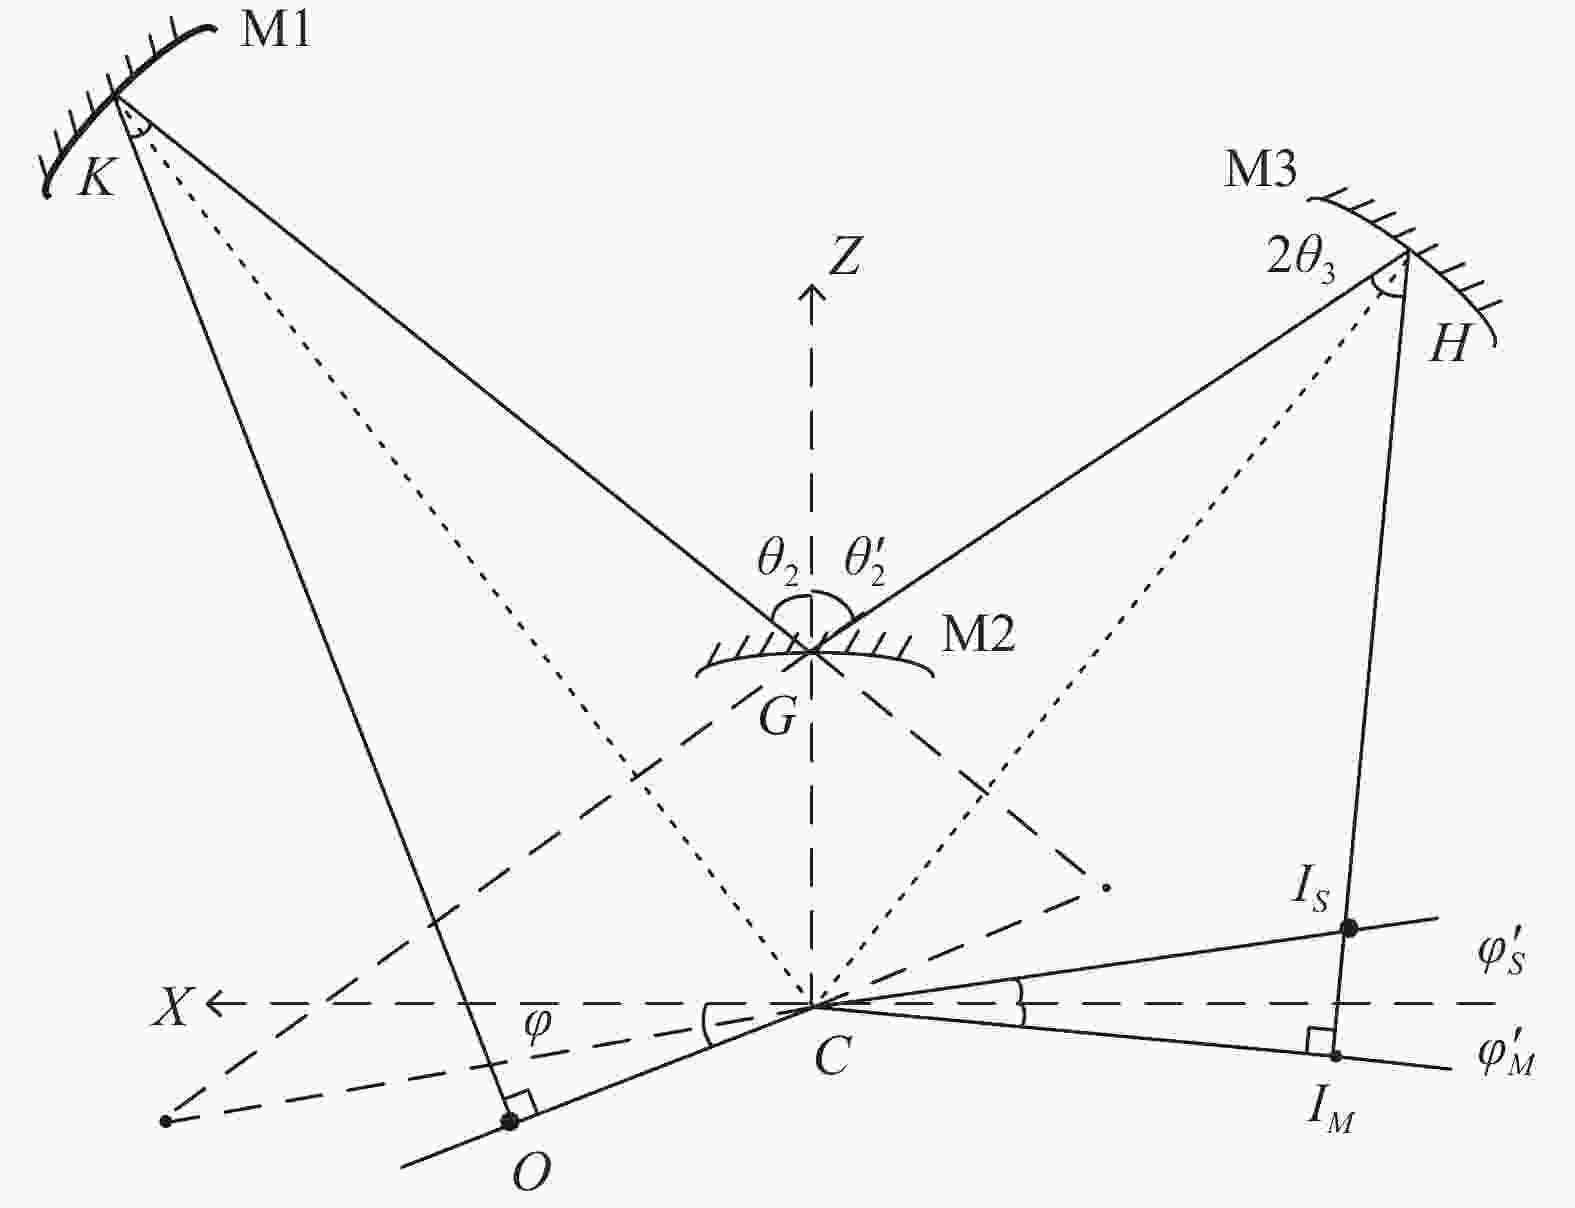
Figure 3. Sagittal imaging
式中:
$ \overline {{{\varphi '}_{}}} $ 为狭缝处发出的入射光线与坐标轴的夹角;$ \overline {{{\varphi '}_S}} $ 为中心波长下的弧矢像极角;$ \overline {{{\varphi '}_M}} $ 为中心波长对应的子午像极角;$ \overline {CI} $ 为坐标原点到像面的距离;$ {\overline {CI} _M} $ 为原点${{C}}$ 到子午像面${{{I}}_{{M}}}$ 的长度;$ {\overline {CI} _S} $ 为原点${{C}}$ 到弧矢像面${{{I}}_{{S}}}$ 的长度。通过上述公式,当弧矢像极角等于子午像极角时,此时K为恒定值,可以推出$ {\text{M2}} $ 的入射角和衍射角在子午面和弧矢面满足的关系为:图2中,在四边形GCIMF中可得角度关系为:
在三角形CFIM、三角形OEC中由正弦定理得:
图3中,在四边形KOCG中可得角度关系为:
在三角形CHIM、三角形CHIS根据几何关系推导得:
在消像散的情况下,将
$ {\left. {\dfrac{{{\text{d}}\left( {{{\varphi '}_M} - {{\varphi '}_S}} \right)}}{{{\text{d}}{{\theta '}_2}}}} \right|_{\overline {{{\theta '}_2}} }} = 0 $ 与$ \dfrac{\text{d}{{\phi }^{\prime }}_{M}}{\text{d}\phi {{\theta }^{\prime }}_{2}}、\dfrac{\text{d}{{\phi }^{\prime }}_{S}}{\text{d}{{\theta }^{\prime }}_{2}} $ 联立可得:通过恒等变换可得
$ {\tan ^3}\overline {{\varphi ^{\prime}}} $ 的方程:该方程仅有一个实数解,可以确定唯一的
$ \overline {\varphi '} $ 值。当衍射光栅作为色散元件时,由光栅方程:利用光栅M2的曲率半径与成像点IM间三角函数关系,可得:
式中:
$ m $ 为衍射级次;$ d $ 为光栅常数;$ i $ 为入射角;$ \theta $ 为衍射角;$ p $ 为光栅刻线数;$ {h_{spec}} $ 为光谱色散宽度;$ \Delta \lambda $ 为光谱范围。该式表明,光栅$ {\text{M2}} $ 的曲率半径$ {R_2} $ 与光谱色散宽度成正比,与光谱范围成反比。由于狭缝入射点以及$ {\text{M1}} $ 、$ {\text{M2}} $ 、$ {\text{M3}} $ 的物、像都在罗兰圆上,根据推导得到$ {\text{M1}} $ 、$ {\text{M2}} $ 两镜间距为:$ {\text{M2}} $ 、$ {\text{M3}} $ 两镜间距为:将自变量
$ \overline {{\theta _3}} $ 代入初始值,在确定了光谱仪的规格(光谱范围、像元尺寸和F数)后,通过公式(1)~(17),可以得到相应谱段范围内的Offner光栅光谱仪的初始结构参数,即为光学系统反射镜的曲率半径、凸面光栅曲率半径,反射镜的倾角,入射狭缝到第一反射镜间距,第一反射镜到光栅间距,光栅到第三反射镜间距、第三反射镜到像面的间距。 -
整个设计过程如图4所示。光谱仪入射狭缝的尺寸由光谱仪规格参数决定,入射F数由其数值孔径决定。文中光谱仪的狭缝尺寸设计值为30 mm,数值孔径为
${{NA = 0}}{\text{.2}}$ 。由于在Offner光谱仪中,入射到M1边缘光线入射角和M2反射边缘光线出射角容易引起渐晕,因此通过调整(增加)$ {\theta _1} $ 或者$ \overline {{\theta _3}} $ 值来避免出现渐晕。在$ \left| {\overline {\theta {}_3} } \right| < {28^{{^\circ }}} $ 时,通过Matlab进行计算,根据图4所示流程,结合公式(1)~(17)和系统设计指标即可以确定系统的初始结构参数。
Figure 4. Schematic of the design process
-
为了满足轨道高度为500 km,幅宽为125 km实现对大范围气体监测[18]的星载CO2成像光谱仪探测器需求,系统的小F数有利于提高光谱仪器的光通量,采用像元合并的方案有利于进一步提高系统的信噪比。Offner光谱仪具体设计指标如表1所示。
Parameter Value Object space NA 0.2 Spectral range/nm 1594-1619 Spectral resolution/nm 0.1 Slit length/mm 30 Pixel dimension 15 μm×15 μm MTF ≥0.7 Keystone and smile/pixel <10% Table 1. Principal design indicators of the system
为了实现0.1 nm的光谱分辨率,采用刻线数为550 lp/mm的凸面光栅,基于成像光谱仪的设计指标以及Offner光谱仪光学系统初始结构参数计算公式,获取Offner成像光谱仪初始光学系统结构参数,如表2所示。
Surface Radius/mm Thickness/mm Material Lines/mm Object - 415.43 - - 1 −422 203.59 Mirror - Stop −214.58 203.59 Mirror 550 3 −415.5 203.59 Mirror - Image Infinity 219.03 - - Table 2. Structure parameter of initial optical
图5为Offner成像光谱仪光学系统初始结构示意图,该系统光阑在凸面光栅上,形成物方远心系统,便于与前置望远系统的光瞳衔接,提高系统能量的利用率。图6为初始光学系统在不同波长各视场处的点列图以及传递函数曲线。

Figure 5. Initial structure diagram

Figure 6. Spot diagram of the initial structure with the wavelength of (a) 1.594 μm, (b) 1.6065 μm, (c) 1.619 μm; MTF of the initial structure with the wavelength of (d) 1.594 μm, (e) 1.6065 μm, (f) 1.619 μm
图6所示初始结构在1594、1606.5、1619 nm3个波长所对应的各视场点列图中,可以看到波长为1594 nm处弥散斑均方根(RMS)半径小于7 nm,1606.5 nm处弥散斑RMS半径小于5 μm,1619 nm处弥散斑RMS半径小于7 μm。边缘视场的弥散斑半径比中心视场处弥散斑半径大,约为3 μm,且不同视场处弥散斑RMS半径均约为像元尺寸的1.5倍。在图6中所示初始结构在1594、1606.5、 1619 nm 3个波长所对应的传递函数曲线中,3个波长不同视场的子午像面和弧矢像面在奈奎斯特频率33 lp/mm时的MTF相差较多。通过分析不同波长的各视场点列图和传递函数,此时,系统存在一定的像散、彗差及残余像差,难以满足高质量成像和高精度探测的需求。因此,需要进一步优化系统存在的像差,同时控制边缘光线与凸面光栅边缘之间的距离,避免发生渐晕。
-
在初始光学系统光路中,放置两块弯月形厚透镜,分别位于狭缝和主镜之间光路,以及三镜和相面之间光路,可以更好的矫正系统的像散和彗差,提高系统的成像质量。在优化过程中,以RMS光斑半径作为优化函数,同时控制放大倍率和主、三镜的圆锥系数。最终,光学系统的结构参数如表3所示。
光路结构如图7(a)所示,设计的分光系统的机械结构图如图7(b)所示。
优化后各视场的点列图与MTF曲线如图8所示,在1594、1606.5、1619 nm 3个波长所对应的每个视场点列图中,优化后的光学系统相比于初始结构其像散和彗差均得到了明显的减小,并且弥散斑的均方根半径均小于5 μm,小于1/3像元尺寸。该系统在奈奎斯特频率33 lp/mm处,全视场的MTF值均达到0.7以上,满足高质量成像要求。
Surface Radius/mm Thickness/mm Diameter/mm Glass Lines/mm Object - 650.655 Φ200 - - 1 300.57 60 Φ375 H-QF3 - 2 373.35 999.812 - - - 3 −1703.59 −978.79 Φ500 Mirror - Stop −1004.4 −978.79 Φ120 Mirror 550 5 −1920.66 −999.812 Φ660 Mirror - 6 373.35 −60 Φ600 H-FK61 B - 7 300.57 −754 - - - Image Infinity - - - - Table 3. Structure parameter of optimization system

Figure 7. (a) Structure of optimized optical system; (b) Structure of optical-mechanical

Figure 8. Spot diagram of the optimized system with the wavelength of (a) 1.594 μm, (b) 1.606 5 μm, (c) 1.619 μm; MTF of the optimized system with the wavelength of (d) 1.594 μm, (e) 1.606 5 μm, (f) 1.619 μm
-
通常光谱成像仪的光谱分辨率由光谱成像系统决定,其公式为:
在入射角
$ i $ 和衍射角$ \theta $ 相等时,光谱分辨能力$ R $ 可以简化为:式中:
$ \Delta p $ 为总色散宽度;$ a $ 为像元尺寸;$ {\lambda _2} - {\lambda _1} $ 为波段范围;$ \Delta {\text{x}} $ 为狭缝宽度;$ f $ 为系统焦距。由于光谱分辨率与信噪比成反比关系,像元尺寸的增大将降低光谱分辨率[14],同时由公式(19)可以看出光谱分辨能力与衍射角$ \theta $ 的正切成正比[19],表明$ \Delta \lambda $ 仅是一个近似结果。为了得到更加清晰的图谱图像,采用像元合并的方式,根据像元尺寸由1$ \times $ 1 pixel矩阵合并为2$ \times $ 2 pixel矩阵,将$ a $ 扩大为原来的2倍,即$ 2 a $ 增强了光信号的探测强度,提高了信噪比。 -
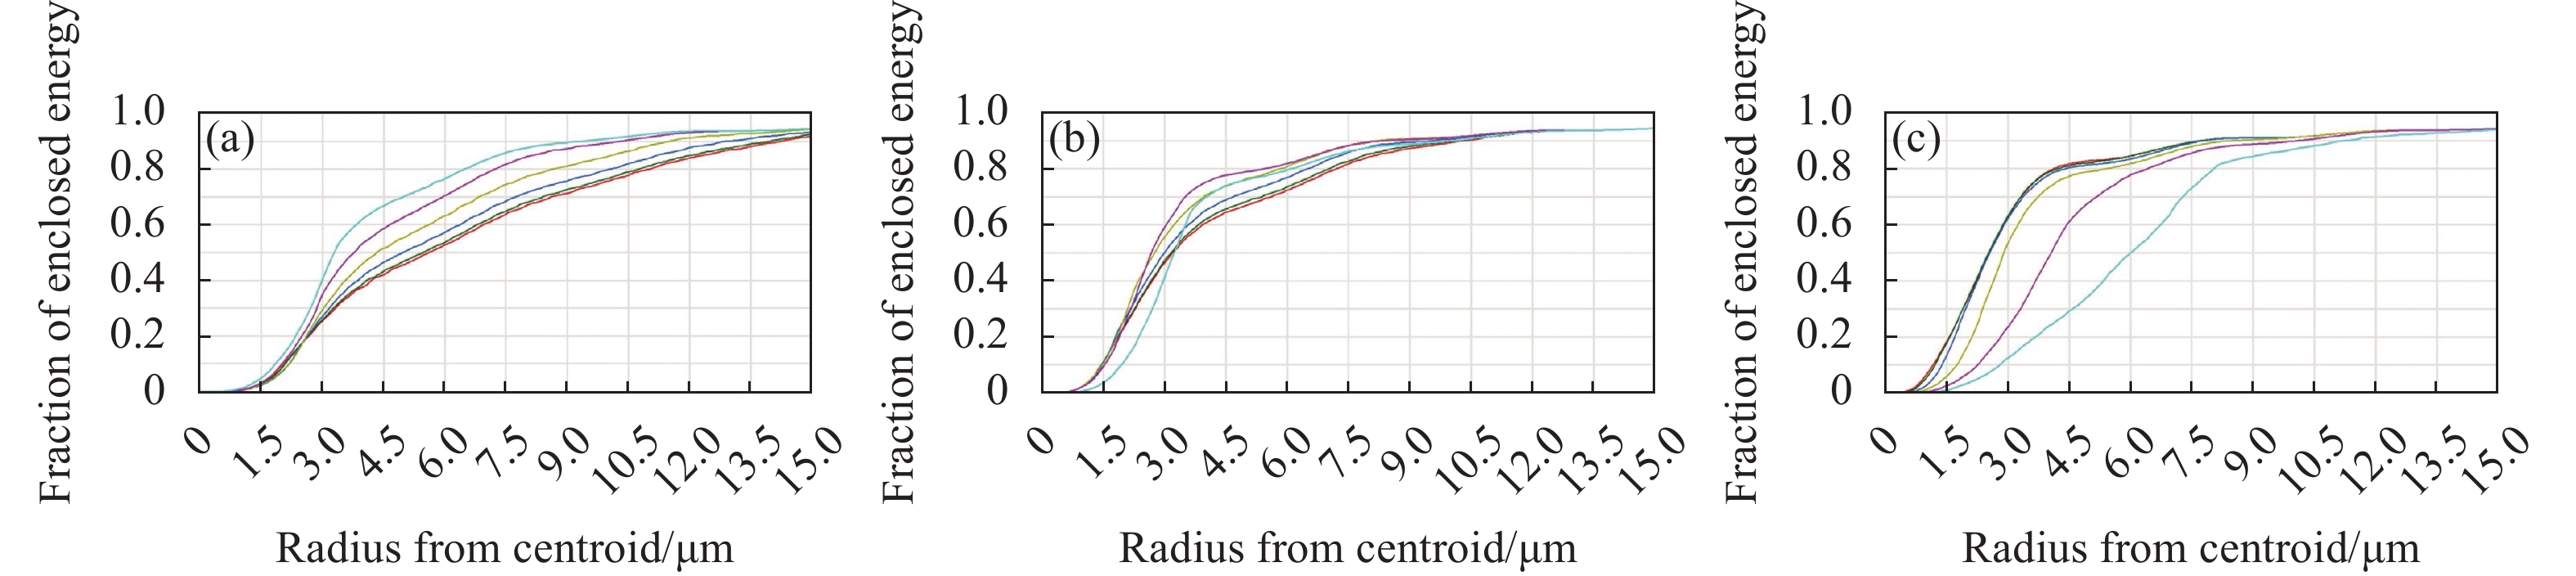
图9(a)~(c)分别为1594、1606.5、1619 nm 3个波长所对应的能量集中度曲线。由图9可见,能量分布近似于高斯正态分布,不同波长能量集中度在探测器单个像素上的系统能量均大于90%,工作波段的能量利用率很高,有助于提高信噪比,从而提高CO2气体浓度探测的精度。

Figure 9. Geometric encircled energy
-
光谱成像系统的色畸变大小和谱线弯曲程度将严重影响光谱调制的精度,其中色畸变是由光谱成像系统对狭缝不同波长的像放大率不同引起的,谱线弯曲是在垂直于狭缝的方向上,某一波长的边缘视场和中心视场之间像点的位置差。随着视场的增大,色畸变和光谱弯曲会导致光谱偏移和光谱重叠,从而降低精度。当偏移量在像元尺寸的20%以内时,满足成像质量要求,但当偏移量大于像元尺寸的20%时,会引起光谱混淆,因此,采用主光线和像面交点位置来代替原像点位置用于光线追迹,由此获得的改进色畸变图像、改进的谱线弯曲图像如图10、图11所示。
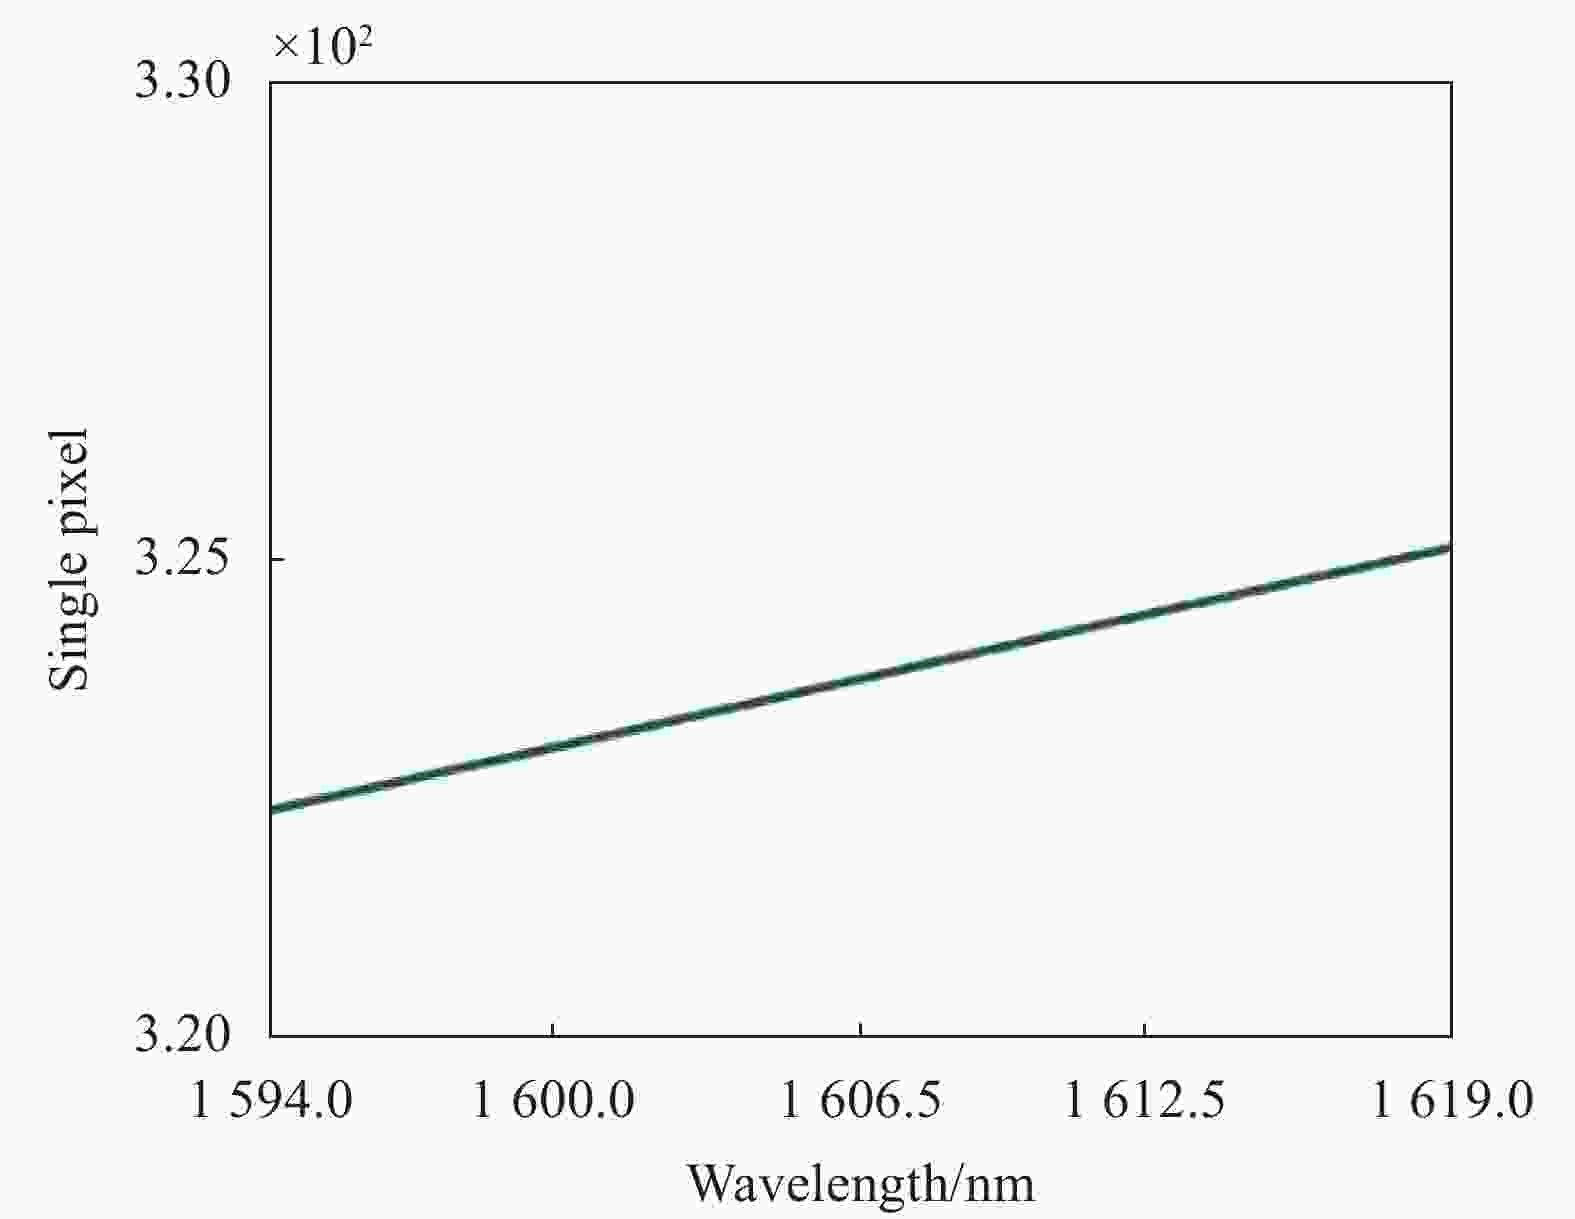
Figure 10. Optimize keystone image

Figure 11. Optimize smile image
图10和图11的变化趋势随着波长的增加而增加,色畸变和谱线弯曲的最大值在1619 nm处,此时色畸变的数值小于单像元尺寸的3.3%,谱线弯曲值小于单像元尺寸的20%,满足设计要求。
-
为了实现大视场、长狭缝的星载CO2成像光谱仪高精度探测,文中基于Offner成像光谱仪狭缝子午光线、弧矢光线于中心波长处相切的基本思路,提出了Offner成像光谱系统初始结构参数设计方案。通过笔者的方案获取星载CO2成像光谱仪初始结构参数,并在狭缝后、主镜前和像面前、三镜后分别插入的透镜提高系统的自由度,进一步矫正初始结构像差,并对成像光谱系统进行整体优化。最终设计光学系统的F数为2.5,狭缝长为30 mm,在谱段1594~1619 nm范围内,具有0.1 nm光谱分辨率。设计结果表明,该光学系统弥散斑均方根半径均小于5 μm,系统在33 lp/mm处的MTF值在全视场范围内均达到0.7以上,最大色畸变和谱线弯曲值都远小于0.2。此外,采用像元合并的方式进一步提高系统的信噪比。综上所述,笔者设计的成像光谱仪光学系统性能满足星载CO2成像光谱仪长狭缝、高精度遥感探测的需求。
Optical system design of spaceborne CO2 imaging spectrometer based on Offner convex grating
doi: 10.3788/IRLA20220431
- Received Date: 2022-02-10
- Rev Recd Date: 2022-04-10
- Accepted Date: 2022-06-01
- Publish Date: 2022-08-05
-
Key words:
- imaging spectrometer /
- optical design /
- short infrared /
- convex grating /
- pixel binning
Abstract: Spaceborne CO2 imaging spectrometer has become one of the important means to monitor global greenhouse gas changes due to its advantages of spectrum integration, high spatial resolution, high time resolution, non-contact and long-term monitoring. In order to solve the problems of large incident slit, low signal-to-noise ratio and poor imaging quality in large field of view, a new scheme was proposed for the initial structure design of the optical system of Offner imaging spectrometer. The scheme was based on the tangent of meridian ray and arc sagittal ray emitted at the 30 mm slit at the central wavelength to improve the utilization rate of incident light in the whole spectral range. Using optical design software, an imaging spectrometer with F number of 2.5 and spectral system resolution of 0.1 nm was designed in the range of 1594-1619 nm. The design results show that the root mean square (RMS) radius of the sequence diagram is less than 5 μm, and the modulation transfer function of the system at 33 lp/mm is better than 0.7. In addition, the system uses pixel merging (i.e. extended pixel) method to further improve the detection intensity of spectral signals. The design scheme satisfy remote sensing detection requirements of large field of view, high spectral resolution and high signal-to-noise ratio for spaceborne CO2 imaging spectrometer.


 DownLoad: