Volume 52 Issue 5
May  2023
Turn off MathJax
Article Contents

He Xinxin, Liu Bin, Wang Chunliu, Wu Guanhao. Block-smoothed adaptive fringe projection for measuring high-reflective surface[J]. Infrared and Laser Engineering, 2023, 52(5): 20220825. doi: 10.3788/IRLA20220825
Citation: He Xinxin, Liu Bin, Wang Chunliu, Wu Guanhao. Block-smoothed adaptive fringe projection for measuring high-reflective surface[J]. Infrared and Laser Engineering, 2023, 52(5): 20220825. doi: 10.3788/IRLA20220825

Block-smoothed adaptive fringe projection for measuring high-reflective surface

doi: 10.3788/IRLA20220825
Funds:  National Natural Science Foundation of China (51835007); Natural Science Foundation of Tianjin, China (21JCZDJC00760, 21JCQNJC00910); "Project+Team" Key Training Program of Tianjin, China(XC202054)
  • Received Date: 2023-01-10
  • Rev Recd Date: 2023-02-28
  • Publish Date: 2023-05-25
  •   Objective  Fringe projection profilometry (FPP) has been established in a wide range of industrial applications. Its key advantages include high accuracy, fast speed, robustness, and non-contact operation. However, image saturation occurs inevitably in measuring high-reflective surface due to the light intensity exceeding the dynamic range of camera sensor. It leads to absolute phase errors and 3D reconstruction failures. It is not an effective approach to address this issue by roughly reducing the exposure time of the camera or shrinking the size of the lens aperture because the SNR of the fringe patterns would decrease. Therefore, measuring high-reflective surface is still a challenging task for conventional FPP. In this paper, we propose a block-smoothed adaptive fringe projection method for high-reflective surface measurement to achieve accurate 3D reconstruction.   Methods  Firstly, the saturated region is extracted and then divided into several blocks by projecting several uniform gray patterns. The initial projection intensity of each block is calculated according to the saturation degree. Secondly, the surface is illuminated by one set of bright fringe patterns and one set of dark ones in the unsaturated condition. The absolute phase map in the extracted saturated region is obtained by fusing the phase maps of the bright and dark fringe patterns. The coordinate mapping between the camera pixels and the projector units is carried out by the integrated phase map. And the initial mapping projection intensity on the projector is gathered. Thirdly, the polynomial function is fitted to the initial mapping projection intensity. The function is utilized to construct the smooth projection intensity curve. The optimal projection intensity of each saturated pixel is refined. And the mapping holes caused by the inconsistent resolution of the camera and projector are filled simultaneously. The adaptive fringe patterns are eventually generated. Finally, the adaptive fringe patterns are projected to the high-reflective surfaces to implement accurate phase retrieval and three-dimensional reconstruction.  Results and Discussions   Two metal parts and one porcelain were measured to verify the performance of the proposed method. Compared with the traditional and two previous methods, the proposed method is capable of generating more accurate and smooth optimal projection intensity (Fig.11-13). As a result, the image saturation is efficiently avoided while the SNR is guaranteed. The reconstruction of the proposed method achieved more smooth boundaries between the high-reflective and normal regions. Moreover, the reconstruction of the high-reflective region had no holes and less burrs. One metal plane was employed to evaluate the measurement precision of the methods (Fig.14). The measurement error of the proposed method decreased by 40% and 28.6% over the previous methods (Tab.1).   Conclusions  The experimental results proved that the proposed method could generate more accurate and smooth optimal projection intensity map to deal with the image saturation problem while measuring high-reflective surface. The ambiguity of the refined optimal projection intensity is also corrected by using the proposed method, thereby establishing more accurate coordinate mapping between the camera pixels and projector units. In addition, the mapping holes are filled. The method improves the precision of measuring high-reflective surface effectively.
  • [1] Zuo Chao, Chen Qian. Computational optical imaging: An overview [J]. Infrared and Laser Engineering, 2022, 51(2): 20220110. (in Chinese) doi:  10.3788/IRLA20220110
    [2] Zhu Zhenmin, Dong Yawen, You Duoduo, et al. Accurate three-dimensional measurement based on polarization-defocused encoded structured light [J]. Measurement, 2022, 205: 112128. doi:  10.1016/j.measurement.2022.112128
    [3] Fan Zhaoyan, Hu Xiaochen, Gao Robert X. Indirect measurement methods for quality and process control in nanomanufacturing [J]. Nanomanufacturing and Metrology, 2022, 5(3): 209-229. doi:  10.1007/s41871-022-00148-4
    [4] Geng Jason. Structured-light 3D surface imaging: a tutorial [J]. Advances in Optics and Photonics, 2011, 3(2): 128-160. doi:  10.1364/AOP.3.000128
    [5] Petrò S, Moroni G. 3D identification of face and flank in micro-mills for automatic measurement of rake angle [J]. Nanomanufacturing and Metrology, 2020, 3(2): 151-163. doi:  10.1007/s41871-020-00064-5
    [6] Wu Junlong, Guo Zhenghua, Chen Xianfeng, et al. Three-dimensional measurement method of light field imaging based on deep learning [J]. Chinese Journal of Lasers, 2020, 47(12): 1204005. (in Chinese) doi:  10.3788/CJL202047.1204005
    [7] Zhu Zhenmin, You Duoduo, Zhou Fuqiang, et al. Rapid 3D reconstruction method based on the polarization-enhanced fringe pattern of an HDR object [J]. Opt Express, 2021, 29(2): 2162-2171. doi:  10.1364/oe.416179
    [8] Zhu Zhenmin, Xie Yulin, Cen Yigang. Polarized-state-based coding strategy and phase image estimation method for robust 3D measurement [J]. Opt Express, 2020, 28(3): 4307-4319. doi:  10.1364/oe.383382
    [9] Zhang Ang, Sun Yaqin, Gao Nan, et al. Fringe projection profilometry by ternary-gray encoded phase unwrapping method [J]. Optics and Precision Engineering, 2022, 30(5): 518-526. (in Chinese) doi:  10.37188/OPE.20223005.0518
    [10] Jiang Yu, Yang Guohui. 3D feature extract method for tool wear based on grating projection [J]. Optics and Precision Engineering, 2007, 15(3): 390-395. (in Chinese) doi:  10.3321/j.issn:1004-924X.2007.03.016
    [11] Zhang Shaoze, Zhang Jianqi, Huang Xi, et al. Three-dimensional profile data representation based on gray value encoding [J]. Chinese Journal of Lasers, 2015, 42(12): 1209001. (in Chinese)
    [12] Zhang Zonghua, Yu Jin, Gao Nan, et al. Three-dimensional shape measurement techniques of shiny surfaces [J]. Infrared and Laser Engineering, 2020, 49(3): 0303006. (in Chinese) doi:  10.3788/IRLA202049.0303006
    [13] He Jiawei, Xu Xinke, Kong Ming, et al. Research on highlight suppression method of metal surface based on surface structured light [J]. China Measurement & Test, 2021, 47(10): 12-18. (in Chinese) doi:  10.11857/j.issn.1674-5124.2020120140
    [14] Palousek D, Omasta M, Koutny D, et al. Effect of matte coating on 3D optical measurement accuracy(Article) [J]. Optical Materials, 2015, 40: 1-9. doi:  10.1016/j.optmat.2014.11.020
    [15] Zhu Zhenmin, Zhu Tai, Sun Xiang, et al. 3D reconstruction method based on the optimal projection intensity of a polarization system [J]. Applied Optics, 2022, 61(34): 10290-10298. doi:  10.1364/AO.478450
    [16] Liu Guihua, Liu Xianyong, Feng Quanyuan. 3D shape measurement of objects with high dynamic range of surface reflectivity [J]. Appl Opt, 2011, 50(23): 4557-4565. doi:  10.1364/AO.50.004557
    [17] Kowarschik R M, Gerber J, Notni G, et al. Adaptive optical 3D measurement with structured light [C]//Proceedings of SPIE, 1999, 39(1): 222-223.
    [18] Liu Xinlong, Yi Hongwei. Improved multi-exposure image pyramid fusion method [J]. Acta Photonica Sinica, 2019, 48(8): 0810002. (in Chinese) doi:  10.3788/gzxb20194808.0810002
    [19] Feng Shijie, Zhang Yuzhen, Chen Qian, et al. General solution for high dynamic range three-dimensional shape measurement using the fringe projection technique [J]. Optics and Lasers in Engineering, 2014, 59: 56-71. doi:  10.1016/j.optlaseng.2014.03.003
    [20] Salahieh B, Chen Zhenyue, Rodriguez J J, et al. Multi-polarization fringe projection imaging for high dynamic range objects [J]. Optics Express, 2014, 22(8): 10064-10071. doi:  10.1364/OE.22.010064
    [21] Li Shaoxu, Da Feipeng, Rao Li. Adaptive fringe projection technique for high-dynamic range three-dimensional shape measurement using binary search [J]. Optical Engineering, 2017, 56(9): 1−7. doi:  10.1117/1.OE.56.9.094111
    [22] Chen Chao, Gao Nan, Wang Xiangjun, et al. Adaptive projection intensity adjustment for avoiding saturation in three-dimensional shape measurement [J]. Optics Communications, 2018, 410(15): 694-702. doi:  10.1016/j.optcom.2017.11.009
    [23] Feng Wei, Xu Shinan, Wang Henghui, et al. Three-dimensional measurement method of highly reflective surface based on per-pixel modulation [J]. Chinese Optics, 2022, 15(3): 488-497. (in Chinese) doi:  10.37188/CO.2021-0220
    [24] Li Maoyue, Liu Zelong, Zhao Weixiang, et al. Blade reflection suppression technology based on surface structured light on-machine detection [J]. Chinese Optics, 2022, 15(3): 464-475. (in Chinese) doi:  10.37188/CO.2021-0194
    [25] Zhan Yu, Hu Dan, Liu Kai. Adaptive structured light for high-reflective areas [J]. Acta Optica Sinica, 2022, 42(16): 1612001. (in Chinese) doi:  10.3788/AOS202242.1612001
    [26] Mccann J J. Retinex at 50: Color theory and spatial algorithms, a review [J]. Journal of Electronic Imaging, 2017, 26(3): 031204. doi:  10.1117/1.JEI.26.3.031204
    [27] Zhang Song. Absolute phase retrieval methods for digital fringe projection profilometry: A review [J]. Optics and Lasers in Engineering, 2018, 107: 28-37. doi:  10.1016/j.optlaseng.2018.03.003
    [28] Zheng Dongliang, Da Feipeng. gamma correction method for accuracy enhancement in grating projection profilometry [J]. Acta Optica Sinica, 2011, 31(5): 0512003. (in Chinese) doi:  10.3788/AOS201131.0512003
  • 加载中
通讯作者: 陈斌, bchen63@163.com
  • 1. 

    沈阳化工大学材料科学与工程学院 沈阳 110142

  1. 本站搜索
  2. 百度学术搜索
  3. 万方数据库搜索
  4. CNKI搜索

Figures(14)  / Tables(1)

Article Metrics

Article views(104) PDF downloads(31) Cited by()

Related
Proportional views

Block-smoothed adaptive fringe projection for measuring high-reflective surface

doi: 10.3788/IRLA20220825
  • 1. Tianjin Key Laboratory for Control Theory & Applications in Complicated Systems, School of Electrical Engineering and Automation, Tianjin University of Technology, Tianjin 300384, China
  • 2. State Key Laboratory of Precision Measurement Technology and Instruments, Department of Precision Instruments, Tsinghua University, Beijing 100084, China
Fund Project:  National Natural Science Foundation of China (51835007); Natural Science Foundation of Tianjin, China (21JCZDJC00760, 21JCQNJC00910); "Project+Team" Key Training Program of Tianjin, China(XC202054)

Abstract:   Objective  Fringe projection profilometry (FPP) has been established in a wide range of industrial applications. Its key advantages include high accuracy, fast speed, robustness, and non-contact operation. However, image saturation occurs inevitably in measuring high-reflective surface due to the light intensity exceeding the dynamic range of camera sensor. It leads to absolute phase errors and 3D reconstruction failures. It is not an effective approach to address this issue by roughly reducing the exposure time of the camera or shrinking the size of the lens aperture because the SNR of the fringe patterns would decrease. Therefore, measuring high-reflective surface is still a challenging task for conventional FPP. In this paper, we propose a block-smoothed adaptive fringe projection method for high-reflective surface measurement to achieve accurate 3D reconstruction.   Methods  Firstly, the saturated region is extracted and then divided into several blocks by projecting several uniform gray patterns. The initial projection intensity of each block is calculated according to the saturation degree. Secondly, the surface is illuminated by one set of bright fringe patterns and one set of dark ones in the unsaturated condition. The absolute phase map in the extracted saturated region is obtained by fusing the phase maps of the bright and dark fringe patterns. The coordinate mapping between the camera pixels and the projector units is carried out by the integrated phase map. And the initial mapping projection intensity on the projector is gathered. Thirdly, the polynomial function is fitted to the initial mapping projection intensity. The function is utilized to construct the smooth projection intensity curve. The optimal projection intensity of each saturated pixel is refined. And the mapping holes caused by the inconsistent resolution of the camera and projector are filled simultaneously. The adaptive fringe patterns are eventually generated. Finally, the adaptive fringe patterns are projected to the high-reflective surfaces to implement accurate phase retrieval and three-dimensional reconstruction.  Results and Discussions   Two metal parts and one porcelain were measured to verify the performance of the proposed method. Compared with the traditional and two previous methods, the proposed method is capable of generating more accurate and smooth optimal projection intensity (Fig.11-13). As a result, the image saturation is efficiently avoided while the SNR is guaranteed. The reconstruction of the proposed method achieved more smooth boundaries between the high-reflective and normal regions. Moreover, the reconstruction of the high-reflective region had no holes and less burrs. One metal plane was employed to evaluate the measurement precision of the methods (Fig.14). The measurement error of the proposed method decreased by 40% and 28.6% over the previous methods (Tab.1).   Conclusions  The experimental results proved that the proposed method could generate more accurate and smooth optimal projection intensity map to deal with the image saturation problem while measuring high-reflective surface. The ambiguity of the refined optimal projection intensity is also corrected by using the proposed method, thereby establishing more accurate coordinate mapping between the camera pixels and projector units. In addition, the mapping holes are filled. The method improves the precision of measuring high-reflective surface effectively.

    • 光学三维测量技术利用光探测被测物体表面,通过接收折射回来的光信号对物体的表面轮廓进行测量[1-2]。在光学测量方法中,根据光源照明方式的不同,可分为被动和主动两种[3-5]。相较于前者,主动式测量的应用场景广、受环境光影响小、测量精度高[6-8]。其中,基于条纹投影的测量方法具有成本低、特征点密、速度快、分辨率高的优点[9],被普遍应用于工业领域上[10-11]。然而在测量表面反射率较大的物体时,如金属器件这类表面较为光滑的物体,投影到表面的部分条纹会出现过饱和现象,结果导致饱和区域出现相位提取误差,甚至重建后的点云中出现孔洞[12]

      为了提高条纹投影测量系统的应用场景,许多学者针对测量高反表面提出了不同的解决方案,包括硬件辅助[13-15]、视角调节[16-17]、多重曝光[18-19]和自适应条纹投影[20]等方法。硬件辅助和视角调节方法需要引入额外设备,并且根据待测物性质的不同,还需对应调整硬件设备,整套系统灵活度不高。多重曝光法对投影图像的数量要求较多,方法流程繁琐耗时。自适应条纹投影是通过对投影强度预调整从而实现对饱和区域抑制的方法,该类方法的关键在于如何计算出调整后的投影强度值大小。Li等人[21]提出了一种自适应条纹投影技术,该技术通过二元搜索每个像素的最佳投影强度来生成新的条纹图。依次搜索每个像素点的最佳投影强度值过程十分耗时,对大范围饱和区域的处理速度较低。Chen等人[22]建立了饱和区域边界的理想强度和实际强度之间的响应模型,当面对表面反射率较大的表面时,该方法容易条纹周期错位导致拟合结果两极化。冯等人[23]通过分析相机投影仪响应模型计算出每一个像素点的最佳投影强度值,但在实际应用中易受噪声的影响。李等人[24]提出一种用于增强饱和区域条纹的Retinex算法,但最终所生成的点云仍存在少量波纹现象。詹瑜等人[25]提出投影等步长灰度图用于确定饱和区域的变化范围,在此范围内逐点计算饱和像素点的最佳投影强度值。该方法计算得到的最佳投影强度值受到步长限制,当步长较大时,相邻饱和区域的最佳投影强度值浮动较大,边界过渡不平滑;当步长较小时,能够计算出相较平滑的最佳投影强度分布,但投影图像的数量也会变多。

      综上所述,针对现有方法生成自适应条纹图精度不高和所需投图数量较多等问题,通过分析条纹投影测量系统的成像特点,文中提出了一种分块平滑自适应条纹投影方法。该方法旨在通过投影少量图像,即可获取具有平滑的最佳投影强度的条纹图,用于测量高反表面的完整三维面形。首先,利用不同灰度级下的灰度图投射对饱和区域进行分块,计算相应的初始投影强度。随后,在不饱和情况下,投射亮暗两种强度的条纹图,对亮度较大的条纹图做区域扩张,并与亮度较小的条纹图做相位融合,以保证相机-投影仪坐标映射精度,获取初始映射投影强度;最后,对初始映射投影强度进行多项式拟合,利用拟合的曲线方程对映射后存在歧义的像素强度值做修正,对离散的像素孔洞点做合理的填补,即可生成自适应条纹。实验结果表明,相较于传统方法和现有改进方法,文中所提方法减少投图数量的同时,保证了高信噪比,可实现高反光物体饱和区域的完整重建。

    • 条纹投影测量系统通常由相机和投影仪组成,通常通过三个步骤即可获得物体表面的三维信息。首先,投影仪向待测物投影一系列编码条纹图案,由相机捕捉调制条纹图案;然后,通过特定的解码方式求解每个像素点的绝对相位值;最后,根据标定模型计算出各像素点的三维世界坐标,系统原理图如图1所示。

      Figure 1.  Principle of fringe projection profilometry

      自适应条纹投影则是通过调整投影条纹图反光区域的投影强度,实现高反光物体表面的三维测量。通常,投射的正弦条纹图像可由下式计算得到:

      式中:AB分别表示平均光强和调制光强;i为相移步数;投影条纹步数为N的相移法称之为N步相移。当面对表面漫反射均匀无饱和区域的待测物时$ \dfrac{{I_{opt}^p}}{{255}} = 1 $;反之,则需要计算每一个饱和像素点的最佳投影强度值$ I_{opt}^p $,然后生成对应的自适应条纹图,保证相机采集到的条纹图案$ I_i^c $不发生饱和,$ \varphi ({x_p},{y_p}) $表示相位信息。

      实际相机采集到的条纹图$ I_i^c $还受物体表面反射率和环境光干扰。根据Retinex理论[26]可知,物体表面信息由自身反射率$ {I_R} $和入射光强$ {I_L} $两部分组成。$ {I_L} $包含环境光强$ {I_{Amb}} $和条纹投影光强$ {I^p} $。因此,相机采集到的调制条纹图光强分布可表示为:

      综上,自适应条纹投影法需要根据相机采集到的条纹图,确定各个饱和像素对应的投影仪像素及其最佳投影强度。文中依据条纹投影测量系统的成像特点,通过分块求解初始投影强度、饱和区域坐标映射和投影强度平滑及孔洞填补,最终生成自适应条纹。下面对文中所提方法展开论述。

    • 将条纹图投影到金属器件表面时,部分区域的亮度会远高于其他区域。一般来说,这一区域内的亮度近似于正态分布,即中间位置的亮度最亮并向周边递减。实际工程应用中受到相机入光量量化等级的限制,当入镜亮度超出最大量化等级时被按相机最大量化等级记录,相机采集到的这部分区域均被视为饱和区域。为了提高系统的测量速度,文中方法首先通过投射少量不同灰度的均匀图像,对饱和区域分块并计算初始投影强度,再利用后续小节的方法对其优化,最后得到用于补偿饱和区域的最佳投影强度。

      饱和区域分块策略如图2所示,计算初始投影强度值的具体步骤如下:

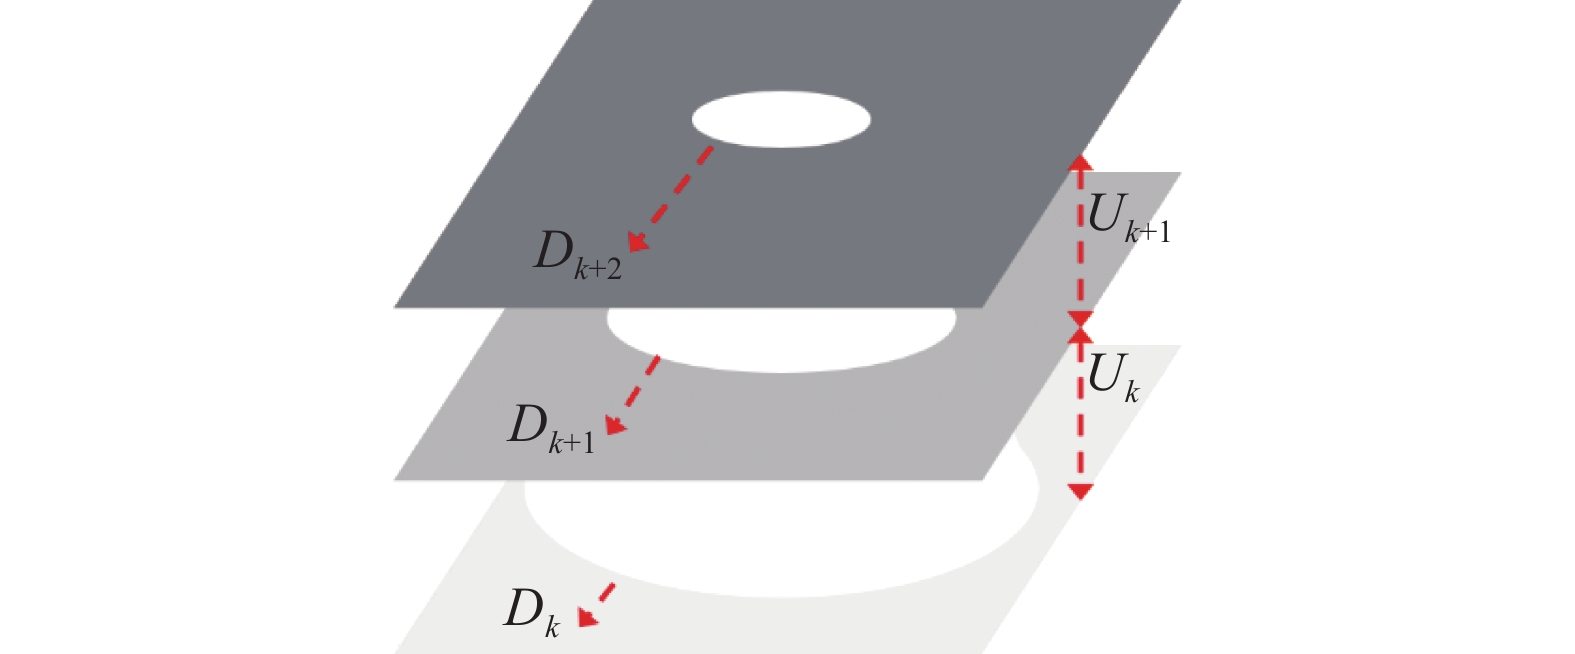
      Figure 2.  Schematic diagram of saturation region blocking

      (1) 由$ {A_k} = 255 - kS $计算出一组均匀灰度序列图,其中,$ k = 0,1 \cdots,K $为灰度图序列号,$ S $为灰度步长。将生成的$ {A_k} $依次投影到待测物表面上,并由相机同步采集调制后的灰度图$ I_k^c $

      (2) 为了确定灰度图$ I_k^c $的饱和区域范围,设定一个饱和阈值$ {T_d} $对采集到的灰度图$ I_k^c $做二值化。

      式中:$ {D_k}({x_c},{y_c}) $是根据饱和阈值计算得到的饱和像素点的连通域组,表示不同灰度下饱和像素点的位置。通过计算相邻饱和区域之间的差值,可获取在$[{A_{K + 1}},{A_K}]$内,变化的饱和区域像素块$ {U_k}({x_c},{y_c}) $

      (3) 如公式(2)所示,当投影光强$ {I^p} = 0 $时,可获取只包含物体自身反射率$ {I_R} $和环境光强$ {I_{Amb}} $的灰度图$ {I^c} $。因此,将一幅全黑图投影到待测物体表面上,并由相机采集得到图像记为$ I_b^c $,其表达式为:

      考虑到系统固有的gamma非线性失真的影响,可通过引入一个预编码gamma值降低失真效应。此外,为了计算出各饱和像素点的反射率,可通过$I_{k + 1}^c$向像素块$ {U_k}({x_c},{y_c}) $中的饱和像素块提供具有高信噪比且非饱和的有效灰度值。各饱和像素点的反射率计算公式为:

      式中:gamma(*)表示受到系统gamma失真影响后的实际投影光强。

      (4) 在保留一定灰度余量的条件下[15],结合公式(2)、(5)和公式(6),初始投影强度值可表示为:

      此处获得的$ I_{int}^{cp} $定义为初始投影强度。由公式(7)可知,投影强度值与实际亮度成反比关系,并且投影强度值的分布形态极大程度上取决于投影灰度序列图步长的大小,步长越小,饱和区域像素块越密集,则计算出来的投影强度值分布越平滑。然而,投影数量多不仅会降低测量速度,同时也会提高计算复杂度。步长较大,得到的$ I_{int}^{cp} $会存在一定程度的边界落差,即同一方向上的投影强度值呈分段台阶分布。基于此生成的自适应条纹图在测量器件时,得到的相位会发生跳变误差。因此,如何投影少量图又能获取平滑的最佳投影强度是文中方法后续部分要解决的问题之一。

    • 通过1.2节方法分块求解的初始投影强度$ I_{int}^{cp} $,其坐标是相机像素,需要通过相机-投影仪坐标映射,转换为投影仪像素的初始映射投影强度$ I_{int}^{pp} $。相机坐标到投影仪坐标的映射需要以相位信息为桥梁,因此如何获取准确的饱和区域绝对相位是实现映射关键。文中选用多频外差法[27]计算绝对相位。对于饱和区域来说,条纹强度较低或较高,都会导致相位解算出现歧义。因此,只投影一组强度的条纹图很难确保饱和区域绝对相位的完整。因此,文中分别投影两组不同强度的条纹图,每组都包含垂直方向和水平方向的条纹图。以不包含饱和像素点的$ {D_k}({x_c},{y_c}) $对应的强度值$ {A_k} $作为第一组条纹图的投影强度,记为暗条纹。这一强度下的暗条纹主要提供饱和区域中间部分的相位信息。剩余的饱和区域相位信息由另一组亮条纹提供,其条纹投影强度取$ [{A_{k + 1}},{A_k}] $的中值。相机-投影仪坐标映射的关系式可表示为:

      式中:$ ({x_p},{y_p}) $为相机坐标$ ({x_c},{y_c}) $映射到投影仪坐标系下的位置;$ W $$ H $分别表示投影仪图像的宽和高;$ T $为条纹图的周期数;$ {\varphi _v}({x_c},{y_c}) $$ {\varphi _h}({x_c},{y_c}) $分别为$ ({x_c},{y_c}) $在垂直条纹和水平条纹上的绝对相位值。

      由于亮条纹中饱和区域中间部分的像素点对亮度比较敏感,虽然未发生饱和,但在相位展开时容易出现条纹阶次错乱。为此,文中提出利用区域扩张来剔除亮条纹中对亮度敏感的像素点,该部分像素点的绝对相位值由暗条纹提供。相位区域扩张可由下式实现:

      式中:$ {\varphi ^l} $为亮条纹绝对相位值;$ B $为卷积核;${\varphi ^l} \oplus {B}$表示剔除的像素点,记为$ {M_b} $。通过对暗条纹和亮条纹提供的相位做融合后,即可获得完整的饱和区域相位信息。

      式中:$ {\varphi ^L} $为亮条纹剔除歧义像素点后的绝对相位;$ {M_b}{\varphi ^B} $表示暗条纹$ {\varphi ^B} $提供的绝对相位,将二者相位做融合后,即可获取某一条纹方向下完整的饱和区域相位信息$ {\varphi _{h/v}} $。代入公式(8)即可实现相机-投影仪坐标映射,获取投影仪像素的初始映射投影强度$ I_{int}^{pp} $

    • 如1.2节所述,分块初始投影强度$ I_{int}^{cp} $存在边界落差。因此,通过坐标映射得到的初始映射投影强度$ I_{int}^{pp} $也存在同样的台阶分布。为此,文中提出了一种对初始映射投影强度$ I_{int}^{pp} $优化的方法,以获取更加平滑的最佳投影强度。所提的优化方法具体步骤如下:

      (1) 根据初始映射投影强度$ I_{int}^{pp} $的离散台阶分布特点,提出利用多项式拟合对边界误差做平滑处理。获得$ I_{int}^{pp} $后,可建立起饱和区域内初始强度值和对应的坐标值之间的多项式关系,二者关系表示为:

      式中:$h = 1,2,3,\cdots,H$为投影仪图像某一行的位置索引;$ I_{int,h}^{pp}({x^p},{y^p}) $表示第$ h $行投影仪像素点$ ({x^p},{y^p}) $的初始投影强度值;$ {a_{Q,h}},{a_{Q - 1,h}},\cdots,{a_{1,h}},{a_{0,h}} $表示第$ h $行边界平滑的拟合系数;$ {W_{int}} $为离散分布的$ I_{int,h}^{pp}({x^p},{y^p}) $对应的列索引。利用$ I_{int}^{pp} $可以逐行拟合出多项式函数的系数。

      (2) 对于饱和区域内的映射投影像素点,都可以计算出对应的避免图像饱和并具有高信噪比的最佳投影强度$ I_{opt,h}^p $。计算公式为:

      通过多项式拟合,可以实现投影少量均匀灰度图即可获取平滑的最佳投影强度,但生成自适应条纹仍有一个问题待解决。如1.3节所述的坐标映射过程中,相机饱和像素连通区域映射到投影像素域内,由于相机与投影仪分辨率存在差异,会导致个别像素点没有对应的投影强度,从而出现孤立像素点,形成无灰度的孔洞。这一问题会影响抑制饱和区域的完整度。而文中利用对初始映射投影强度进行多项式拟合的方法,可以同步完成投影强度的平滑和孔洞的填补。

      孔洞填补的关键在于孔洞点的确定,需要准确提取出待填补的孔洞像素点。文中利用半径为$r$的滑动窗口$w$遍历最佳投影强度图像,用于确定待填补的孔洞点位置。其表达式可写为:

      式中:$ {\text{ }}w(I_{opt}^p({x_p},{y_p})) $表示窗口内包含最佳投影强度值像素点的总数;$ I_{hole}^p({x_p},{y_p}) $为待填补孔洞位置。由于文中是在投影仪图像上计算得到的最佳投影强度值,因此填补孔洞点的最佳投影强度值可结合公式(12)计算得到的。计算表达式为:

      式中:$ {W_{hole}} $为孔洞像素点$ ({x^p},{y^p}) $对应列的索引。实现孔洞点填补的原理如图3所示。

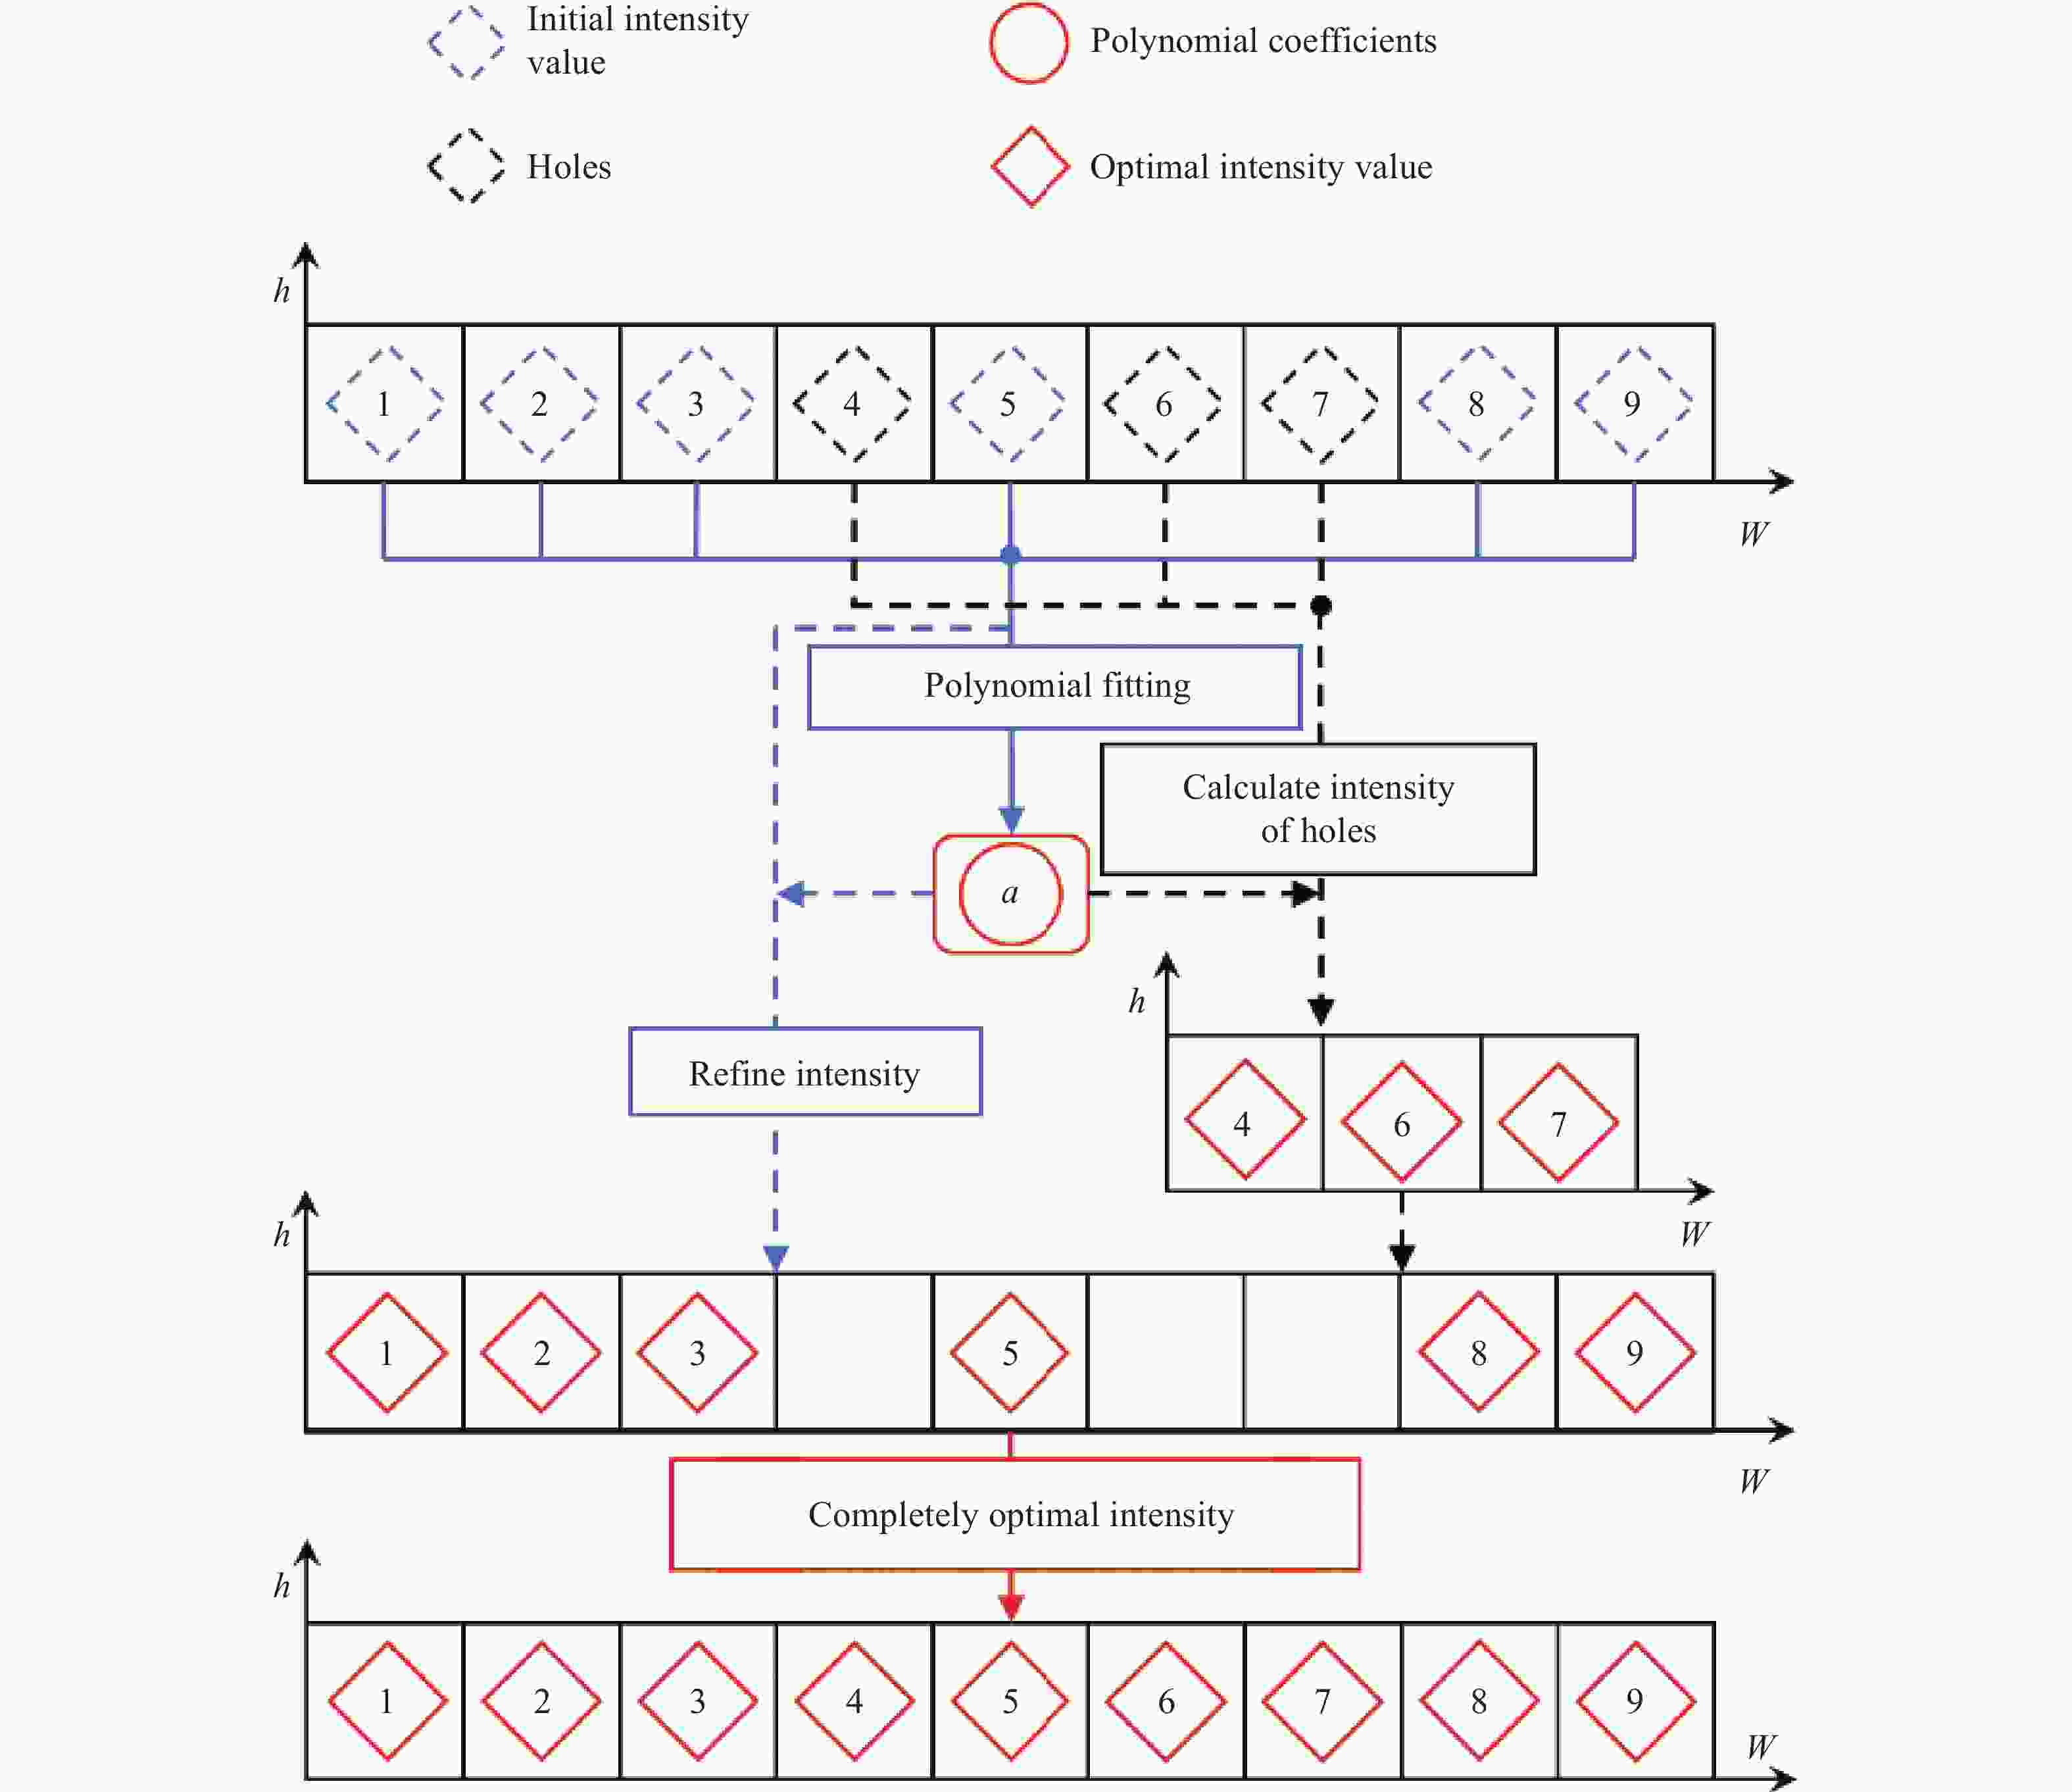
      Figure 3.  Schematic diagram of smoothing the projection intensity and filling the holes based on polynomial fitting

      综上所述,文中所提自适应条纹投影方法由三个模块步骤组成:计算初始投影强度、饱和区域坐标映射、投影强度平滑及孔洞填补。整套方法流程如图4所示。

      Figure 4.  Flow chart of generating the adaptive fringe patterns

    • 根据FPP原理,搭建了如图5所示的测量系统。该系统由分辨率为1200 pixel×1 920 pixel的CCD相机(Basler acA1920-155 μm)和分辨率为1080 pixel×1 920 pixel的投影仪(DLP4710)组成。选取一块表面具有高反射率的光学分度头部件作为实验对象。将被测物体放置在面向测量系统距离约为480 mm处,相机与投影仪的间距约为210 mm,视场范围约为311 mm×175 mm。

      Figure 5.  Setup of the measurement system

      由公式(3)和(4)计算出不同灰度图下的饱和区域位置及饱和区域像素块。由文献[28]计算出系统的gamma值约为2.6,结合公式(7)计算出初始投影强度值,如图6(a)所示。初始投影强度受到灰度步长的影响,存在明显的离散台阶分布,取图6(a)中第470行750:1160列观察其分布规律,如图6(c)红块所示,由于文中步长较大,在$[{A_{K + 1}},{A_K}]$内的投影强度值分布相对宽裕,但仍然能看出离散式分布特点。根据这一分布特点,利用公式(12)对初始投影强度进行优化,结合图6(c)初始强度值分布规律,取多项式拟合关系式最大阶次为$Q = 2$。优化后的结果如图6(b)所示,得到的最佳投影强度图边界更为平滑,强度分布更均匀并与初始假设相符,取相同范围内的强度值分布进行分析,如图6(c)中蓝块分布所示。

      Figure 6.  Initial and refined projection intensity maps. (a) Initial projection intensity map; (b) Refined projection intensity map; (c) Comparison of the initial and refined maps at one row

      选灰度值为5作为暗条纹的投影强度值。在灰度范围
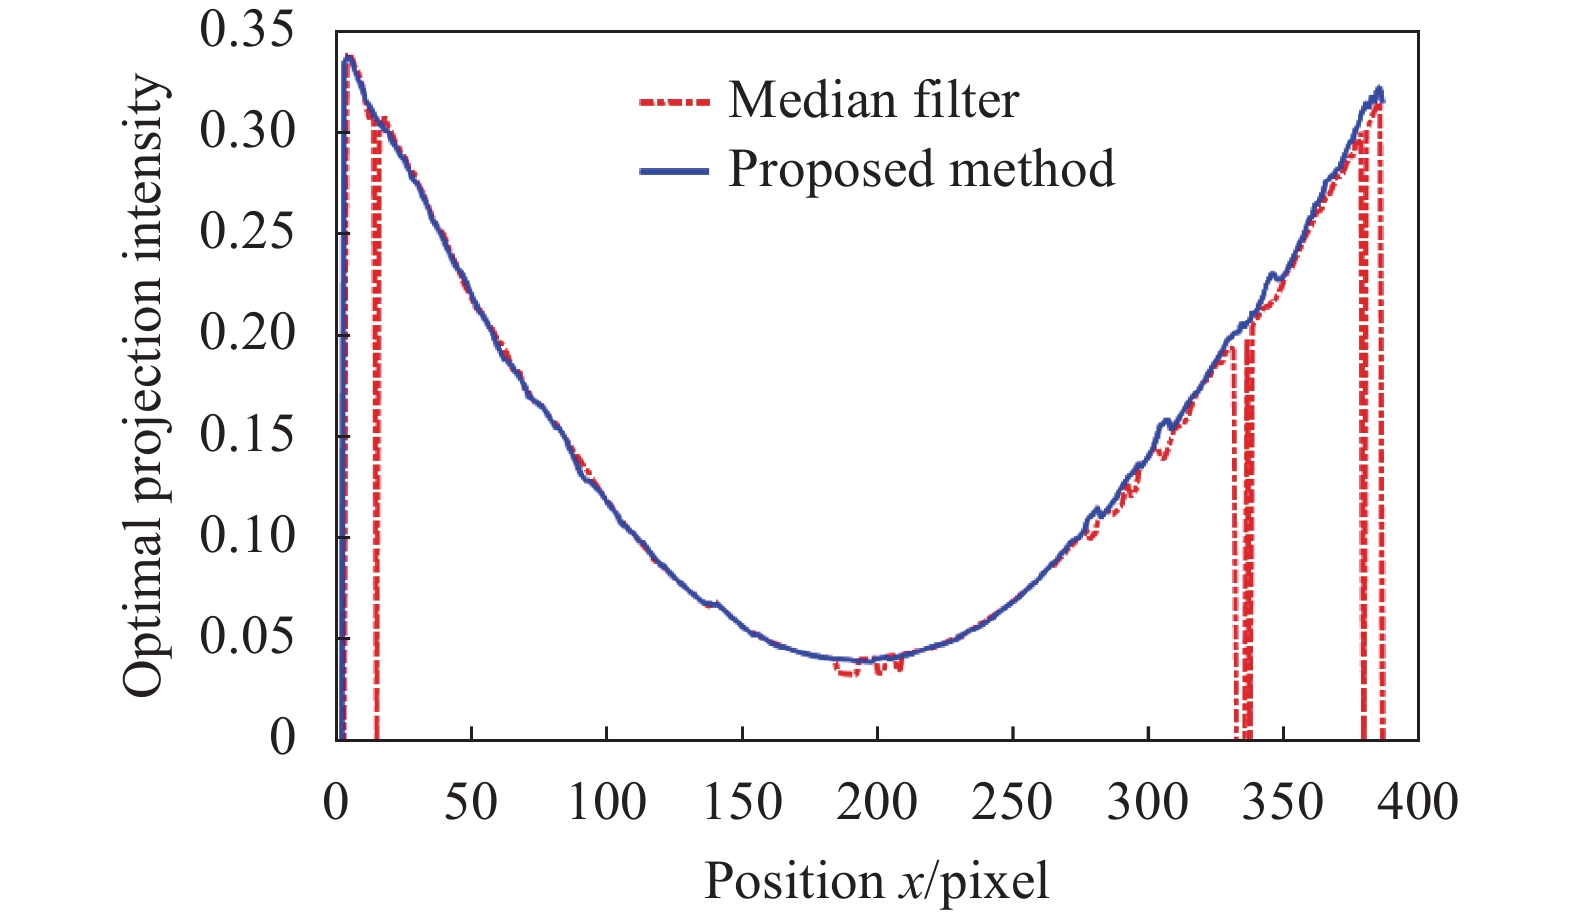
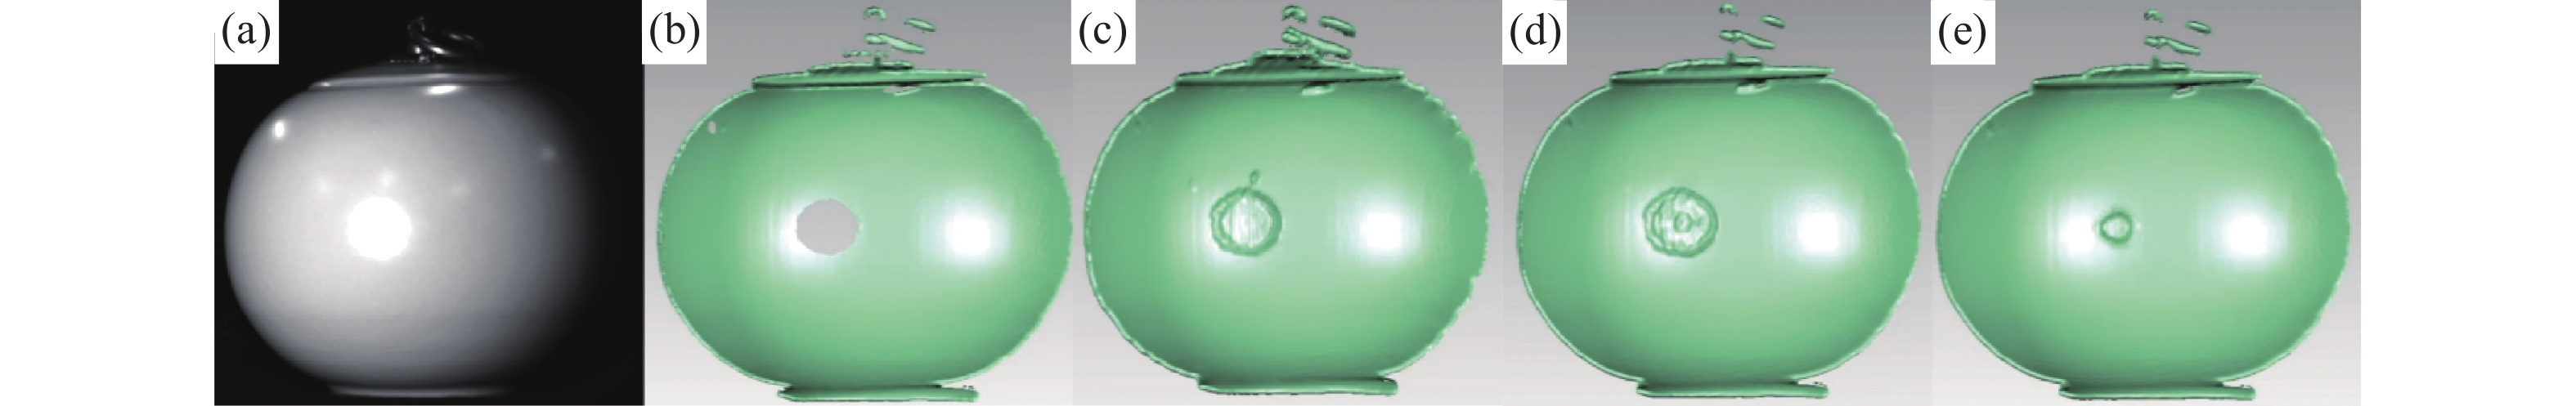
$ [5,255] $内取中值130作为亮条纹的投影强度值。投影垂直方向和水平方向亮暗强度的条纹图到待测物表面上,分别对垂直条纹图和水平条纹图做如1.2小节中介绍的相位扩张和融合的处理,获取两方向上完整的饱和区域相位信息,结合公式(8)完成相机-投影仪坐标映射。最后,为了保证能够完整的抑制住饱和区域,还需对孔洞点进行填补。由实际测量情况确定窗口半径的大小,文中取$r = 3$。结合公式(13)和(14)即可计算出待填补孔洞的最佳投影强度值,完成孔洞填补。如图7所示的不同孔洞效果图及对应条纹图,未进行任何孔洞填补的图7(a)存在许多的孔洞点。加入中值滤波对孔洞进行填补的效果如图7(b)所示,仍然存在不少的孔洞点。基于文中所提的孔洞填补方法在不影响原有强度值的前提下,填补的效果最完整并且符合原有分布特点,三者生成的对应条纹图如图7(d)~(f)所示。图8为中值滤波与所提方法对孔洞进行填补后,相同范围内的强度分布图。由实验图可看出所提方法填补的效果更加完整流畅。

      Figure 7.  Hole filling by different methods and the corresponding fringe pattern. (a) Before filling; (b) Median filter; (c) Proposed method; (d)-(f) Fringe patterns corresponding to the above methods are shown respectively

      Figure 8.  Comparison of the hole filling results at at one row by using median filter and proposed method

      图9是传统FPP方法和文中所提方法实际投影效果图,如图9(a)所示,传统FPP方法无法采集到饱和区域的条纹信息。而文中所提方法能够在不降低正常区域信噪比的前提下,获取到饱和区域的条纹信息,如图9(b)所示。提取二者第440行526:1300列的条纹灰度值进行对比,如图10所示。

      Figure 9.  Comparison of the fringe projection. (a) Conventional FPP; (b) Proposed method

      Figure 10.  Comparison of the fringe gray value map at one row

      为了验证文中所提方法测量高反光器件的效果,分别与传统FPP方法、Chen[22]的方法和詹[25]的方法进行多组实验对比。实验对象包含两个表面特征不同的金属器件及一个大肚瓷器。两个金属器件的三维测量实验均包含四种方法生成的条纹图投影效果、对器件整体重建效果和饱和区域重建效果,最后给出了Chen的方法、詹的方法和所提方法在同一行上的高度对比。从实际条纹图投影后的饱和区域来看,在该区域内,传统FPP方法条纹丢失十分严重,Chen的方法得到的条纹较为生硬,詹的方法得到的条纹相较于前者们具有明显改善,但调整后的强度值边界较为粗糙,文中方法能获得完整且边界与正常区域衔接自然的条纹,具体如图1112(a)~(d)所示。根据对应的条纹图,三维重建效果如图1112(e)~(h)所示,传统FPP方法和Chen的方法重建后均出现明显的饱和区域三维数据丢失的现象,詹的方法重建后存在少量的三维数据丢失,文中方法的重建效果较为完整,饱和区域与正常区域之间的边界衔接更加平滑。图1112 (i)~(l)呈现了饱和区域的重建效果,文中方法相较于前三者能恢复更多的三维数据。图1112(n)分别给出了三种方法获得的三维数据在同一行上的高度对比。可以发现,所提方法与另外两种方法数据之间最大差异在于无大幅度错误跳跃点,测得的三维数据较为平整。为验证文中方法的适用范围,利用四种方法对大肚汝窑茶叶罐进行了三维重建。如图13(b)~(e)所示,文中方法相较于另外三种方法能够更大程度的抑制住饱和区域带来的重建误差。

      综合以上实验分析, Chen的方法并非为每一个饱和像素点计算出对应的最佳投影强度值,而是将同一饱和像素簇内的像素点赋予相同的最佳投影强度值。因此,部分饱和像素点会出现过抑制或未抑制的状态。詹的方法通过计算孔洞点周边强度的均值实现孔洞的填补,若孔洞点数量过多时,通常填补的并不完整,因此会导致无法抑制住部分饱和像素点。文中所提方法得益于对最佳投影强度的优化,使其分布更加平滑,并且利用拟合填补的方式对孔洞进行合理填补,得到的饱和区域最佳投影强度分布较为完整,重建后的效果自然完整。

      Figure 11.  Experimental results of first group. (a) Fringe projection result of conventional FPP method; (b) Fringe projection result of Chen’s method; (c) Fringe projection result of Zhan’s method; (d) Fringe projection result of proposed method; (e) 3D reconstruction result of conventional FPP method; (f) 3D reconstruction result of Chen’s method; (g) 3D reconstruction result of Zhan’s method; (h) 3D reconstruction result of proposed method; (i) Reconstruction result in the saturated region of conventional FPP method; (j) Reconstruction result in the saturated region of Chen’s method; (k) Reconstruction result in the saturated region of Zhan’s method; (l) Reconstruction result in the saturated region of proposed method; (m) Comparison of measured height on one row of the three methods

      Figure 12.  Experimental results of second group. (a) Fringe projection result of conventional FPP method; (b) Fringe projection result of Chen’s method; (c) Fringe projection result of Zhan’s method; (d) Fringe projection result of proposed method; (e) 3D reconstruction result of conventional FPP method; (f) 3D reconstruction result of Chen’s method; (g) 3D reconstruction result of Zhan’s method; (h) 3D reconstruction result of proposed method; (i) Reconstruction result in the saturated region of conventional FPP method; (j) Reconstruction result in the saturated region of Chen’s method; (k) Reconstruction result in the saturated region of Zhan’s method; (l) Reconstruction result in the saturated region of proposed method; (m) Comparison of measured height on one row of the three methods

      为了更加客观的评价文中方法的实验效果,对一块表面反光剧烈的硬铝塑板平面进行三维测量。计算不同方法下测量得到的平板三维点,利用最小二乘法拟合出对应的平面方程后,计算各点到平面距离的标准差,以评价重建三维点的精度及有效性。图14(a)中三维重建区域丢失较严重。图14(b)重建后存在平面点凹凸不平,红框内平面较为粗糙。图14(c)重建效果相对前者较为平整,但红框内存在毛刺。文中所提方法相较于前面三种方法,对平面重建效果比较完整,并且平整度较高,表面凸起较少,如图14(d)红框内所示。表1罗列了三种方法的平面拟合标准差Std和计算最佳投影强度值所需图像数量。标准差越小说明测量出来的三维点越贴合平面,计算得到的三维点精度越高。Chen的方法虽然用的图像最少,但该方法并非逐像素点计算饱和像素点的最佳投影强度值,存在一定误差。在实际测量系统中,需要在测量速度和精度上做权衡,文中所提方法只需投影更少量的灰度图即可实现对金属器件的高精度三维测量。

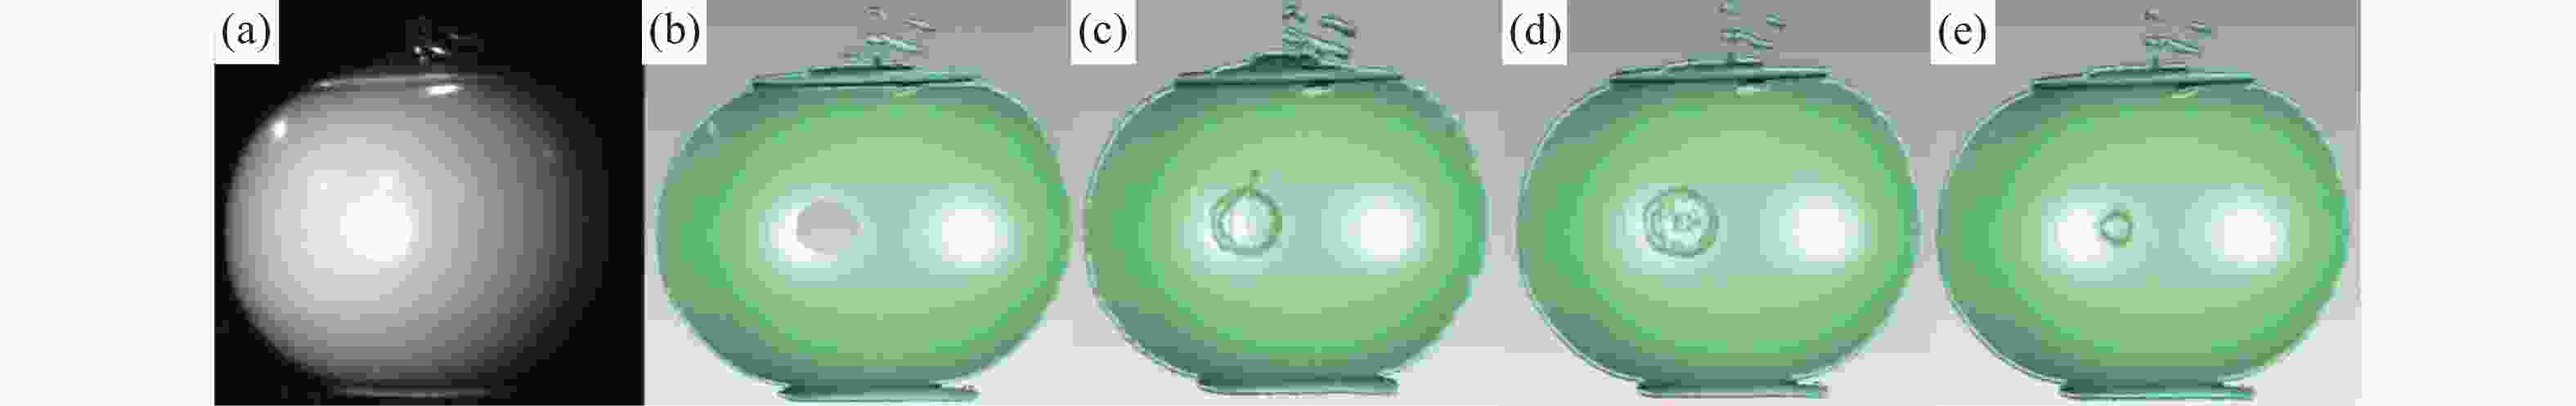
      Figure 13.  3D reconstruction effects of Ru Kiln tea caddy using different methods. (a) Ru Kiln tea caddy; (b) Conventional FPP method; (c) Chen’s method; (d) Zhan’s method; (e) Proposed method

      Figure 14.  3D reconstruction results of the metal plane by different methods: (a) Conventional FPP method; (b) Chen’s method; (c) Zhan’s method; (d) Proposed method

      IMethod
      Chen’sZhan’sProposed
      Std/mm0.250.210.15
      Image/pcs35312

      Table 1.  Standard deviation of different methods and the number of images during projection

    • 针对条纹投影在高反表面产生饱和误差的问题,文中提出了一种基于分块平滑逐点计算饱和像素最佳投影强度值的自适应条纹生成方法。与现有方法相比,文中方法只需投影少量灰度图,即可计算出能够有效抑制饱和区域的最佳投影强度。无需添加额外设备,实现简单,根据文中所提方法在计算出每个饱和像素点最佳投影强度的同时,可同步实现对离散像素孔洞点的填补。对比现有方法的三维重建效果,文中所提方法得到的三维数据更完整,并且重建后饱和区域与正常区域衔接处更平滑。文中所提方法的标准偏差分别减少了40%和28.6%,可适用于高反光物体的三维测量。

Reference (28)

Catalog

    /

    DownLoad:  Full-Size Img  PowerPoint
    Return
    Return