


-
强隐身是新一代先进战斗机的重要技术指标之一,其对提升战机在复杂战场环境下的生存率具有重要意义。飞机的红外隐身能力是强隐身的重要技术体现。航空发动机产生的高温燃气是飞机主要的红外辐射源,并且随着新一代航空发动机的涡轮前温度进一步提高,来自高温燃气的红外辐射信号在飞机整机红外辐射信号中所占的比例会更加突出[1-2]。由于高温燃气中的辐射传输计算涉及到大量分子谱线参数的计算,因此,准确的计算航空发动机高温燃气的红外辐射特性仍然存在一定的困难。
逐线计算法(line-by-line, LBL)是目前最准确的气体辐射传输计算方法,其结果常用作验证其他模型的标准解。但是,LBL的计算谱带宽度取值小,通常在0.0002~0.02 cm−1之间,因此计算量大,计算效率低[3]。窄谱带(narrow-band, NB)模型的计算谱带宽度在5~50 cm−1之间,其计算效率明显高于LBL。其中,统计窄谱带(statistical narrow-band, SNB)模型由于其计算结果与LBL的计算结果吻合较好,因此在辐射传输计算领域得到了广泛的应用。王振华[4]采用统计窄谱带k分布模型(statistical narrow-band correlated-k, SNBCK)研究了发动机热端部件在高温介质内部的辐射换热情况。Yue等[5]采用SNB模型研究了发动机内部的辐射传热问题。Niu等[6]使用SNB模型结合Curtis-Godson近似算法研究了火箭发动机尾焰的红外辐射特征。在航空发动机排气系统红外辐射特性的计算研究方面,金捷等[7]采用的是Goody SNB模型,而陈立海等人[8-11]使用的是Malkmus SNB模型。SNB模型计算效率高,对于等温、均匀气体介质内的辐射传输问题计算误差小。但是对于非等温、非均匀气体介质,特别是温度梯度较大的气体介质内的辐射传输计算,采用SNB模型会造成较大的计算误差[12]。为了应对非等温、非均匀气体介质内的辐射传输计算问题,Leon等[13]提出了假设气体法。Reviere等[12,14]将SNBCK模型结合假设气体法应用到红外辐射计算中。结果表明,对于温度梯度较大的气体介质内的辐射传输计算问题,基于假设气体法的SNBCK模型比传统的SNBCK模型的计算误差更小。Soufiani等[15]发展了基于假设气体法的Curtis-Godson近似SNB模型,并与传统的SNB模型进行了比较。结果表明,对于高温气体红外辐射的远距离传输计算问题,基于假设气体法的Curtis-Godson近似SNB模型的计算结果更准确。
目前,在航空发动机排气系统红外辐射特性的计算研究中普遍采用的仍然是传统的SNB模型。但是,对于航空发动机排气系统,高温燃气除了非等温、非均匀这些特性外,还会存在因激波造成的大温度梯度的情况。而传统的SNB模型在计算大温度梯度气体介质内的辐射传输时存在计算误差较大的固有缺点。文中在传统Malkmus SNB模型的基础上发展了基于假设气体法的统计窄谱带(fictitious gas based statistical narrow-band, SNBFG)模型,计算了航空发动机燃气中主要红外活性成分的辐射特性参数,并与传统SNB模型的计算结果进行了对比,验证了SNBFG模型计算燃气红外辐射特性参数的准确性。
-
目前,高温气体内的辐射传输计算均依赖高温分子谱线数据库的支持。在高温分子谱线数据库中,不同分子谱线的低位跃迁能各不相同,造成各分子谱线对温度变化的敏感程度不一致。其中,低位跃迁能较高的分子谱线在高温环境下对热辐射的贡献大,在低温环境下对热辐射的贡献小;而低位跃迁能较低的分子谱线则正好相反[15]。传统的SNB模型在分子谱线数据库的基础上,将谱带区间内所有分子谱线的平均谱线参数作为谱带模型的参数。高温分子谱线数据库中,对于某一确定的谱带区间,可能存在大量的低位跃迁能相差较大的分子谱线。理论上,传统的SNB模型在计算温度梯度较大的气体辐射问题时会造成较大的计算误差[15]。
假设气体法的主要思想是根据分子谱线低位跃迁能的大小将谱带区间范围内的所有分子谱线分成n组,各组内的分子谱线具有相近的低位跃迁能。因此,同一组内的分子谱线对温度变化的敏感程度接近。假设每一组的分子谱线组成一种气体,则实际的气体可以看作是由n种气体混合组成的。每一种假设气体的谱带模型参数通过传统的SNB模型计算得到。最终,实际气体的谱带平均透过率可以通过n种假设气体的谱带平均透过率相乘得到,即:
$$ {\overline \tau _{\Delta \eta }}{\text{(actual gas) = }}\prod\limits_{i = 1}^n {{{\overline \tau }_{\Delta \eta }}({\text{fictitious gas}},i)} $$ (1) -
研究表明[16-17],Malkmus SNB模型能够较好地处理CO2和H2O等红外活性成分的辐射特性参数计算问题。因此,文中引入Malkmus SNB模型计算谱带平均透过率。对于行程长度为l、计算压强为P、摩尔分数为x的气体组分,其在谱带区间
$\Delta \eta $ 范围内的谱带平均透过率的计算公式为:$$ {\overline \tau _{\Delta \eta }} = \exp \left[ { - \frac{{2\overline \gamma }}{{\overline \delta }}\left( {\sqrt {1 + \frac{{xPl\overline \kappa \overline \delta }}{{\overline \gamma }}} - 1} \right)} \right] $$ (2) 式中:
$\overline \kappa $ 为谱线平均吸收系数;$\overline \gamma $ 为谱线平均半宽;$\overline \delta $ 为谱线平均间距。对于多组分燃气的辐射传输计算问题,假设谱线平均半宽
$\overline \gamma $ 与波数无关,则对于气体组分i,其谱线平均半宽$\overline \gamma $ 可表示为:$$ {\overline \gamma _i} = {({\overline \gamma _{ii}})_{STP}}{x_i}P{\left( {\frac{{{T_0}}}{T}} \right)^{{n_{ii}}}} + \sum\limits_j {{{({{\overline \gamma }_{ij}})}_{STP}}{x_j}P{{\left( {\frac{{{T_0}}}{T}} \right)}^{{n_{ij}}}}} $$ (3) 式中:j表示外增宽气体组分;
${({\overline \gamma _{ii}})_{STP}}$ 表示组分i在标准状态(温度T0 = 296 K,压强P0 = 1 atm)下的自增宽经验常数;${({\overline \gamma _{ij}})_{STP}}$ 表示组分j在标准状态下的外增宽经验常数;${n_{ii}}$ 和${n_{ij}}$ 为温度修正系数。文中采用EM2C实验室提供的增宽常数及温度修正系数,如表1所示。Species Broadener ${\bar \gamma _{ij}}$ ${n_{ij}}$ ${\bar \gamma _{ii}}$ ${n_{ii}}$ H2O H2O 0.079 0.5 0.462 1.0 CO2 0.106 0.5 CO 0.079 0.5 N2 0.079 0.5 O2 0.036 0.5 CO2 H2O 0.1 0.7 0.012 0.7 CO2 0.058 0.7 CO 0.058 0.7 N2 0.058 0.7 O2 0.058 0.7 当谱带区间
$\Delta \eta $ 大于谱线线宽时,谱带平均吸收系数$\overline \kappa $ 主要受温度和谱带区间$\Delta \eta $ 的影响,谱带平均吸收系数$\overline \kappa $ 可表示为:$$ \overline \kappa = \frac{1}{{xp}}\int\limits_{\Delta \eta } {{\kappa _\eta }{\rm{d}}\eta } $$ (4) 式中:
${\kappa _\eta }$ 表示波数$\eta $ 处的吸收系数。可通过下式计算:$$ {\kappa _\eta } = \sum\limits_i {{S_i}(T)N(P,T)f(\eta - {\eta _i})} $$ (5) 式中:
${\eta _i}$ 表示第i条谱线的中心波数;$f(\eta - {\eta _i})$ 表示谱线线型函数;$N(P,T)$ 为分子数密度,可表示为压强P和温度T的函数:$$ N(P,T) = {N_{STP}}\frac{{{T_0}}}{T}\frac{P}{{{P_0}}} $$ (6) 式中:
${N_{STP}}$ = 2.479×10¹⁹,单位为1/cm−3;${S_i}(T)$ 为单个分子的谱线线强,通过分子谱线数据库提供的标准状态下的分子线强${S_{STP}}$ 外推计算得到:$$ {S_i}\left(T\right) = {S_{STP}} \cdot \dfrac{{Q\left({T_0}\right)}}{{Q\left(T\right)}} \cdot \dfrac{{\exp \left(\dfrac{{ - {c_2} \cdot E}}{T}\right)}}{{\exp \left(\dfrac{{ - {c_2} \cdot E}}{{{T_0}}}\right)}} \cdot \dfrac{{1 - \exp \left(\dfrac{{ - {c_2} \cdot {\eta _i}}}{T}\right)}}{{1 - \exp \left(\dfrac{{ - {c_2} \cdot {\eta _i}}}{{{T_0}}}\right)}} $$ (7) 式中:E为分子谱线的低位跃迁能;c2 = 1.438 cm·K为普朗克第二辐射常数;Q(T)为总内配分函数,通过如下拟合的三次多项式进行计算:
$$ Q(T) = a + bT + c{T^2} + d{T^3} $$ (8) 式中:不同种类分子及其在不同温度下的多项式系数可参考文献[18]。
目前,对于谱线平均间距
$\overline \delta $ 的计算,文中采用前人普遍采用的通过LBL法获得谱带平均透过率$\overline \tau $ 随行程长度l的变化曲线,然后通过最小二乘法拟合变化曲线以获得谱线平均间距$\overline \delta $ 。 -
航空发动机产生的燃气主要有CO2、H2O、CO以及其他固态和液态组分。其中,CO2和H2O是最主要的红外活性成分[1,19]。为了验证SNBFG模型计算燃气红外辐射特性参数的准确性,分别采用SNBFG模型和传统的SNB模型计算了单一组分气体(CO2和H2O)和混合气体(CO2-H2O-N2)在不同温度条件下的辐射特性参数,并与LBL的计算结果行了对比。
高温分子谱线数据库采用HITEMP2010数据库[20]。根据分子谱线低位跃迁能的大小将每一种实际气体分成五种假设气体。每一种假设气体对应的分子谱线低位跃迁能的范围如表2所示。计算谱带模型参数时的谱带宽度
$\Delta \eta $ = 25 cm−1。Classes E/cm−1 G1 0-1500 G2 1500-3000 G3 3000-4500 G4 4500-6500 G5 6500-∞ CO2-H2O-N2混合气体的谱带平均透过率等于CO2和H2O谱带平均透过率的乘积:
$$ {\overline \tau _{\Delta \eta }}({\rm{mixture}}) = {\overline \tau _{\Delta \eta }}({\rm{C{O_2}}}) \cdot {\overline \tau _{\Delta \eta }}({\rm{{H_2}O}}) $$ (9) 忽略气体散射的影响,波数
${\eta _1}$ 和${\eta _2}$ 范围内的谱带发射率为:$$ \varepsilon = \dfrac{{\displaystyle\int_{{\eta _1}}^{{\eta _2}} {(1 - {\tau _\eta }) \cdot {e_{\eta ,b}} \cdot {\rm{d}}\eta } }}{{\displaystyle\int_{{\eta _1}}^{{\eta _2}} {{e_{\eta ,b}} \cdot {\rm{d}}\eta } }} $$ (10) 谱带发射率相对误差定义为:
$$ RE = \frac{{{\varepsilon _{Calculated}} - {\varepsilon _{LBL}}}}{{{\varepsilon _{LBL}}}} \cdot 100 {\text{%}} $$ (11) -
红外探测器的工作波段为3~5 μm和8~12 μm,航空发动机的燃气辐射主要集中在3~5 μm范围内[1]。文中基于HITEMP2010数据库计算了等温、均匀条件和非等温、非均匀条件下CO2在4.3 μm吸收带(1800~2600 cm−1)内的辐射特性参数,并与LBL的计算结果进行了比较。表3给出了不同温度条件下等温、均匀CO2气体的计算条件。非等温、非均匀CO2气体由三段等温、均匀气体组成,各段参数见表4。
表 3 等温、均匀CO2气体计算条件
Table 3. Calculation conditions for CO2 in isothermal and homogeneous columns
Case T/K P/atm ${x_{{\text{C}}{{\text{O}}_{\text{2}}}}}$ ${x_{{{\text{H}}_{\text{2}}}{\text{O}}}}$ ${x_{{{\text{N}}_{\text{2}}}}}$ l/cm C1 800 1.0 0.04 0 0.96 50 C2 1000 1.0 0.04 0 0.96 50 C3 1200 1.0 0.04 0 0.96 50 C4 1500 1.0 0.04 0 0.96 50 表 4 非等温、非均匀CO2气体计算条件
Table 4. Calculation conditions for CO2 in nonisothermal and nonhomogeneous columns
Column T/K P/atm ${x_{{\text{C}}{{\text{O}}_{\text{2}}}}}$ ${x_{{{\text{H}}_{\text{2}}}{\text{O}}}}$ ${x_{{{\text{N}}_{\text{2}}}}}$ l/cm 1 800 1.0 0.01 0 0.99 50 2 1500 1.0 0.06 0 0.94 50 3 2 000 1.0 0.10 0 0.90 50 图1是在等温、均匀条件下,SNBFG模型和SNB模型计算的不同温度下CO2在4.3 μm吸收带的谱带平均透过率与LBL计算结果的对比。其中,上部分给出了LBL的计算结果,下部分给出了SNBFG模型和SNB模型的计算误差。文中LBL计算谱带宽度为0.01 cm−1,为便于与窄谱带模型的计算结果进行比较,将LBL的计算结果在谱带宽度
$\Delta \eta $ = 25 cm−1内进行数值平均。
图 1 等温、均匀条件下CO2在4.3 μm吸收带的谱带平均透过率
Figure 1. Transmissivity for 4.3 μm band of CO2 in isothermal and homogeneous column
在不同温度条件下,SNBFG模型和SNB模型的计算结果与LBL的计算结果之间的差异主要集中在2200 cm−1和2400 cm−1附近,如图1所示。在2200 cm−1附近,SNBFG模型的计算结果稍小于LBL的计算结果,而SNB模型的计算结果则相反。两种模型的计算结果之间存在差异的主要原因是传统的SNB模型通过额外的相关性假设来处理分子谱线之间的关联效应;而对于SNBFG模型,同一种假设气体中的分子谱线之间仍然沿用了传统SNB模型的相关性假设,但是忽略了不同假设气体的分子谱线之间的关联效应[13]。在2400 cm−1附近,SNBFG模型和SNB模型的计算结果均大于LBL的计算结果。不同温度条件下,SNBFG模型的计算误差最大为0.11,均方根误差最大为0.021;SNB模型的计算误差最大为0.04,均方根误差最大为0.009。
等温、均匀条件下,CO2在4.3 μm吸收带的谱带发射率计算结果如图2所示。结果表明,在800~1500 K温度范围内,SNB模型的计算误差在−1.1% ~ 0.1%之间,SNBFG模型的计算误差在−2.3% ~ −2.2%之间。不同温度条件下,SNB模型的计算误差小于SNBFG模型的计算误差,但SNBFG模型的计算误差受温度的影响较小。在不同温度条件下,SNB模型的误差变化为1.2%,而SNBFG模型的误差变化为0.1%。

图 2 等温、均匀条件下CO2在4.3 μm吸收带的谱带发射率
Figure 2. Band emissivity for 4.3 μm band of CO2 in isothermal and homogeneous column
总体上看,在等温、均匀条件下,对于CO2在4.3 μm吸收带辐射特性参数的计算,SNB模型的计算误差小于SNBFG模型的计算误差,后者的最大均方根误差是前者的2.3倍。因为传统的SNB模型有额外的假设条件处理分子谱线之间的关联效应,而SNBFG模型忽略了不同假设气体的分子谱线之间的关联效应,所以对于等温、均匀燃气介质辐射特性参数的计算,SNBFG模型并不能有效地降低计算误差,甚至会在一定程度上增加计算误差。
图3是在非等温、非均匀条件下,SNBFG模型和SNB模型计算的CO2在4.3 μm吸收带的谱带平均透过率与LBL计算结果的对比。结果表明,SNBFG模型的计算结果与LBL的计算结果吻合较好,最大计算误差为0.03;SNB模型的计算结果与LBL的计算结果在2 050 cm−1附近存在一定的偏差,最大计算误差为−0.07。SNBFG模型和SNB模型的均方根误差分别为0.006和0.021,后者明显大于前者。这主要是由传统的SNB模型对大温度梯度条件适应性差造成的。总体上看,在非等温、非均匀条件下,SNBFG模型的计算误差明显小于SNB模型的计算误差,后者的均方根误差是前者的3.5倍。

图 3 非等温、非均匀条件下CO2在4.3 μm吸收带的谱带平均透过率
Figure 3. Transmissivity for 4.3 μm band of CO2 in nonisothermal and nonhomogeneous column
-
文中基于HITEMP2010数据库计算了H2O在3~5 μm波段附近两个主要吸收带(6.3 μm和2.7 μm)内的谱带平均透过率和谱带发射率,并与LBL的计算结果进行了比较。表5给出了不同温度条件下等温、均匀气体H2O的计算条件。非等温、非均匀气体H2O由三段等温、均匀气体组成,各段参数见表6。
表 5 等温、均匀气体H2O计算条件
Table 5. Calculation conditions for H2O in isothermal and homogeneous columns
Case T/K P/atm ${x_{{\text{C}}{{\text{O}}_{\text{2}}}}}$ ${x_{{{\text{H}}_{\text{2}}}{\text{O}}}}$ ${x_{{{\text{N}}_{\text{2}}}}}$ l/cm W1 800 1.0 0 0.03 0.97 50 W2 1000 1.0 0 0.03 0.97 50 W3 1200 1.0 0 0.03 0.97 50 W4 1500 1.0 0 0.03 0.97 50 表 6 非等温、非均匀气体H2O计算条件
Table 6. Calculation conditions for H2O in nonisothermal and nonhomogeneous columns
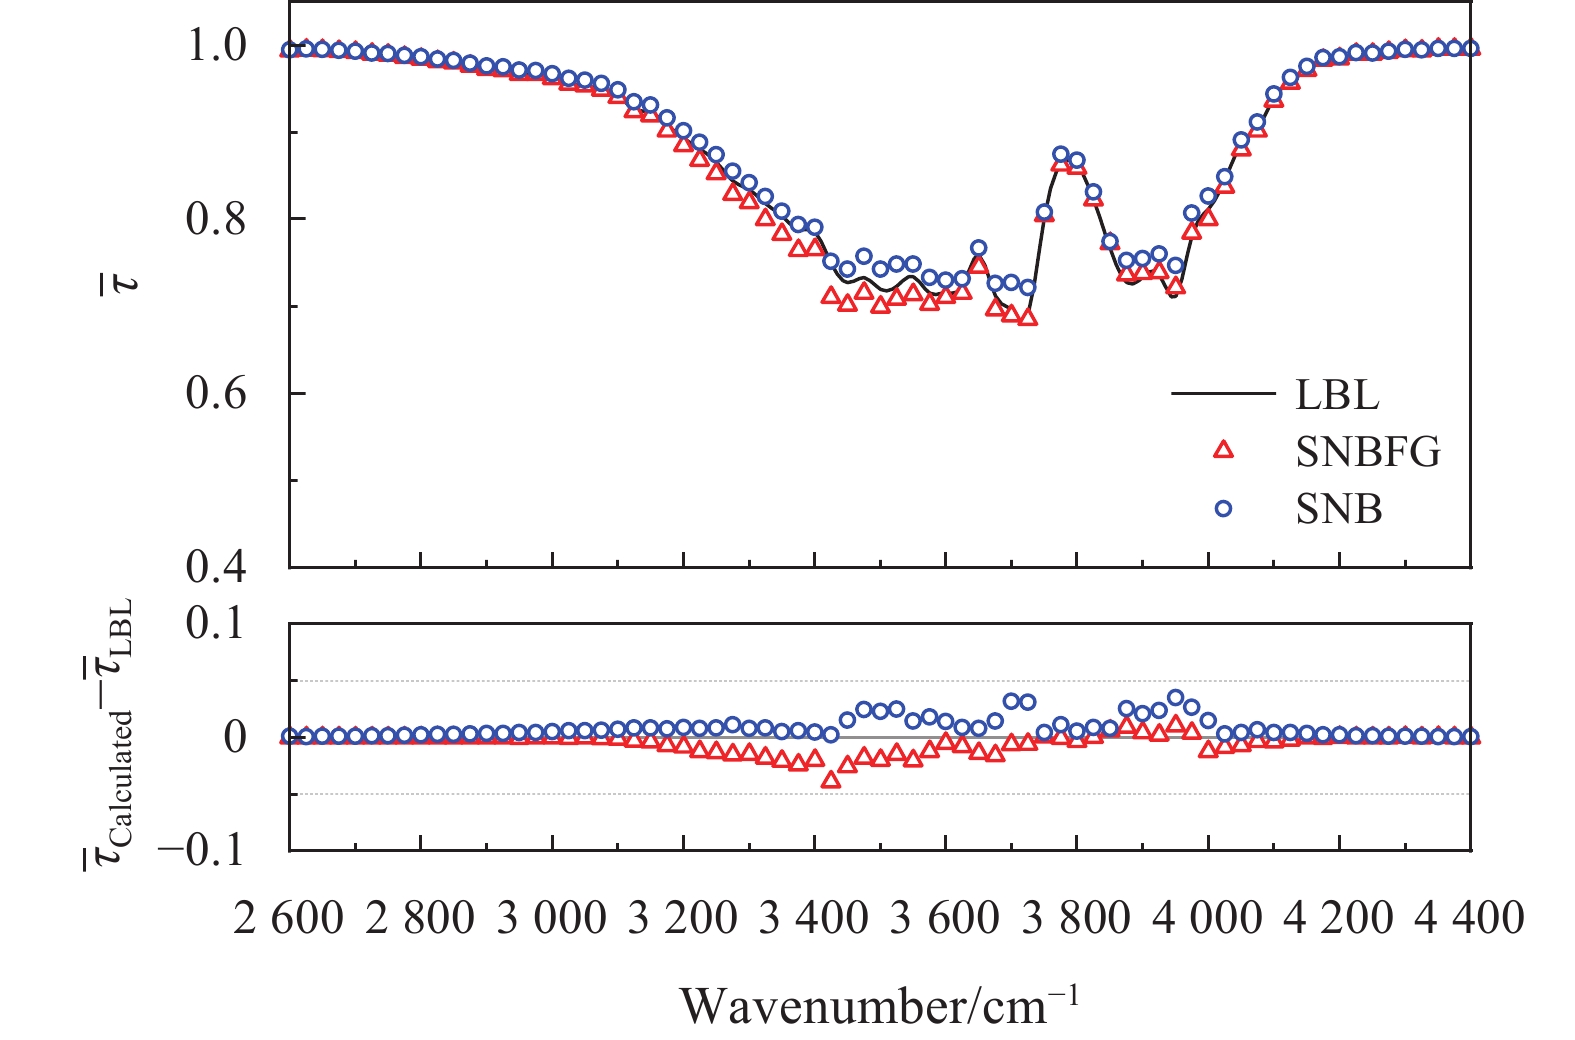
Column T/K P/atm ${x_{{\text{C}}{{\text{O}}_{\text{2}}}}}$ ${x_{{{\text{H}}_{\text{2}}}{\text{O}}}}$ ${x_{{{\text{N}}_{\text{2}}}}}$ l/cm 1 800 1.0 0 0.01 0.99 50 2 1500 1.0 0 0.06 0.94 50 3 2000 1.0 0 0.10 0.90 50 图4和图5是在等温、均匀条件下,SNBFG模型和SNB模型计算的不同温度下H2O在6.3 μm吸收带(1000~2500 cm−1)和2.7 μm吸收带(2600~4400 cm−1)内的谱带平均透过率与LBL计算结果的对比。
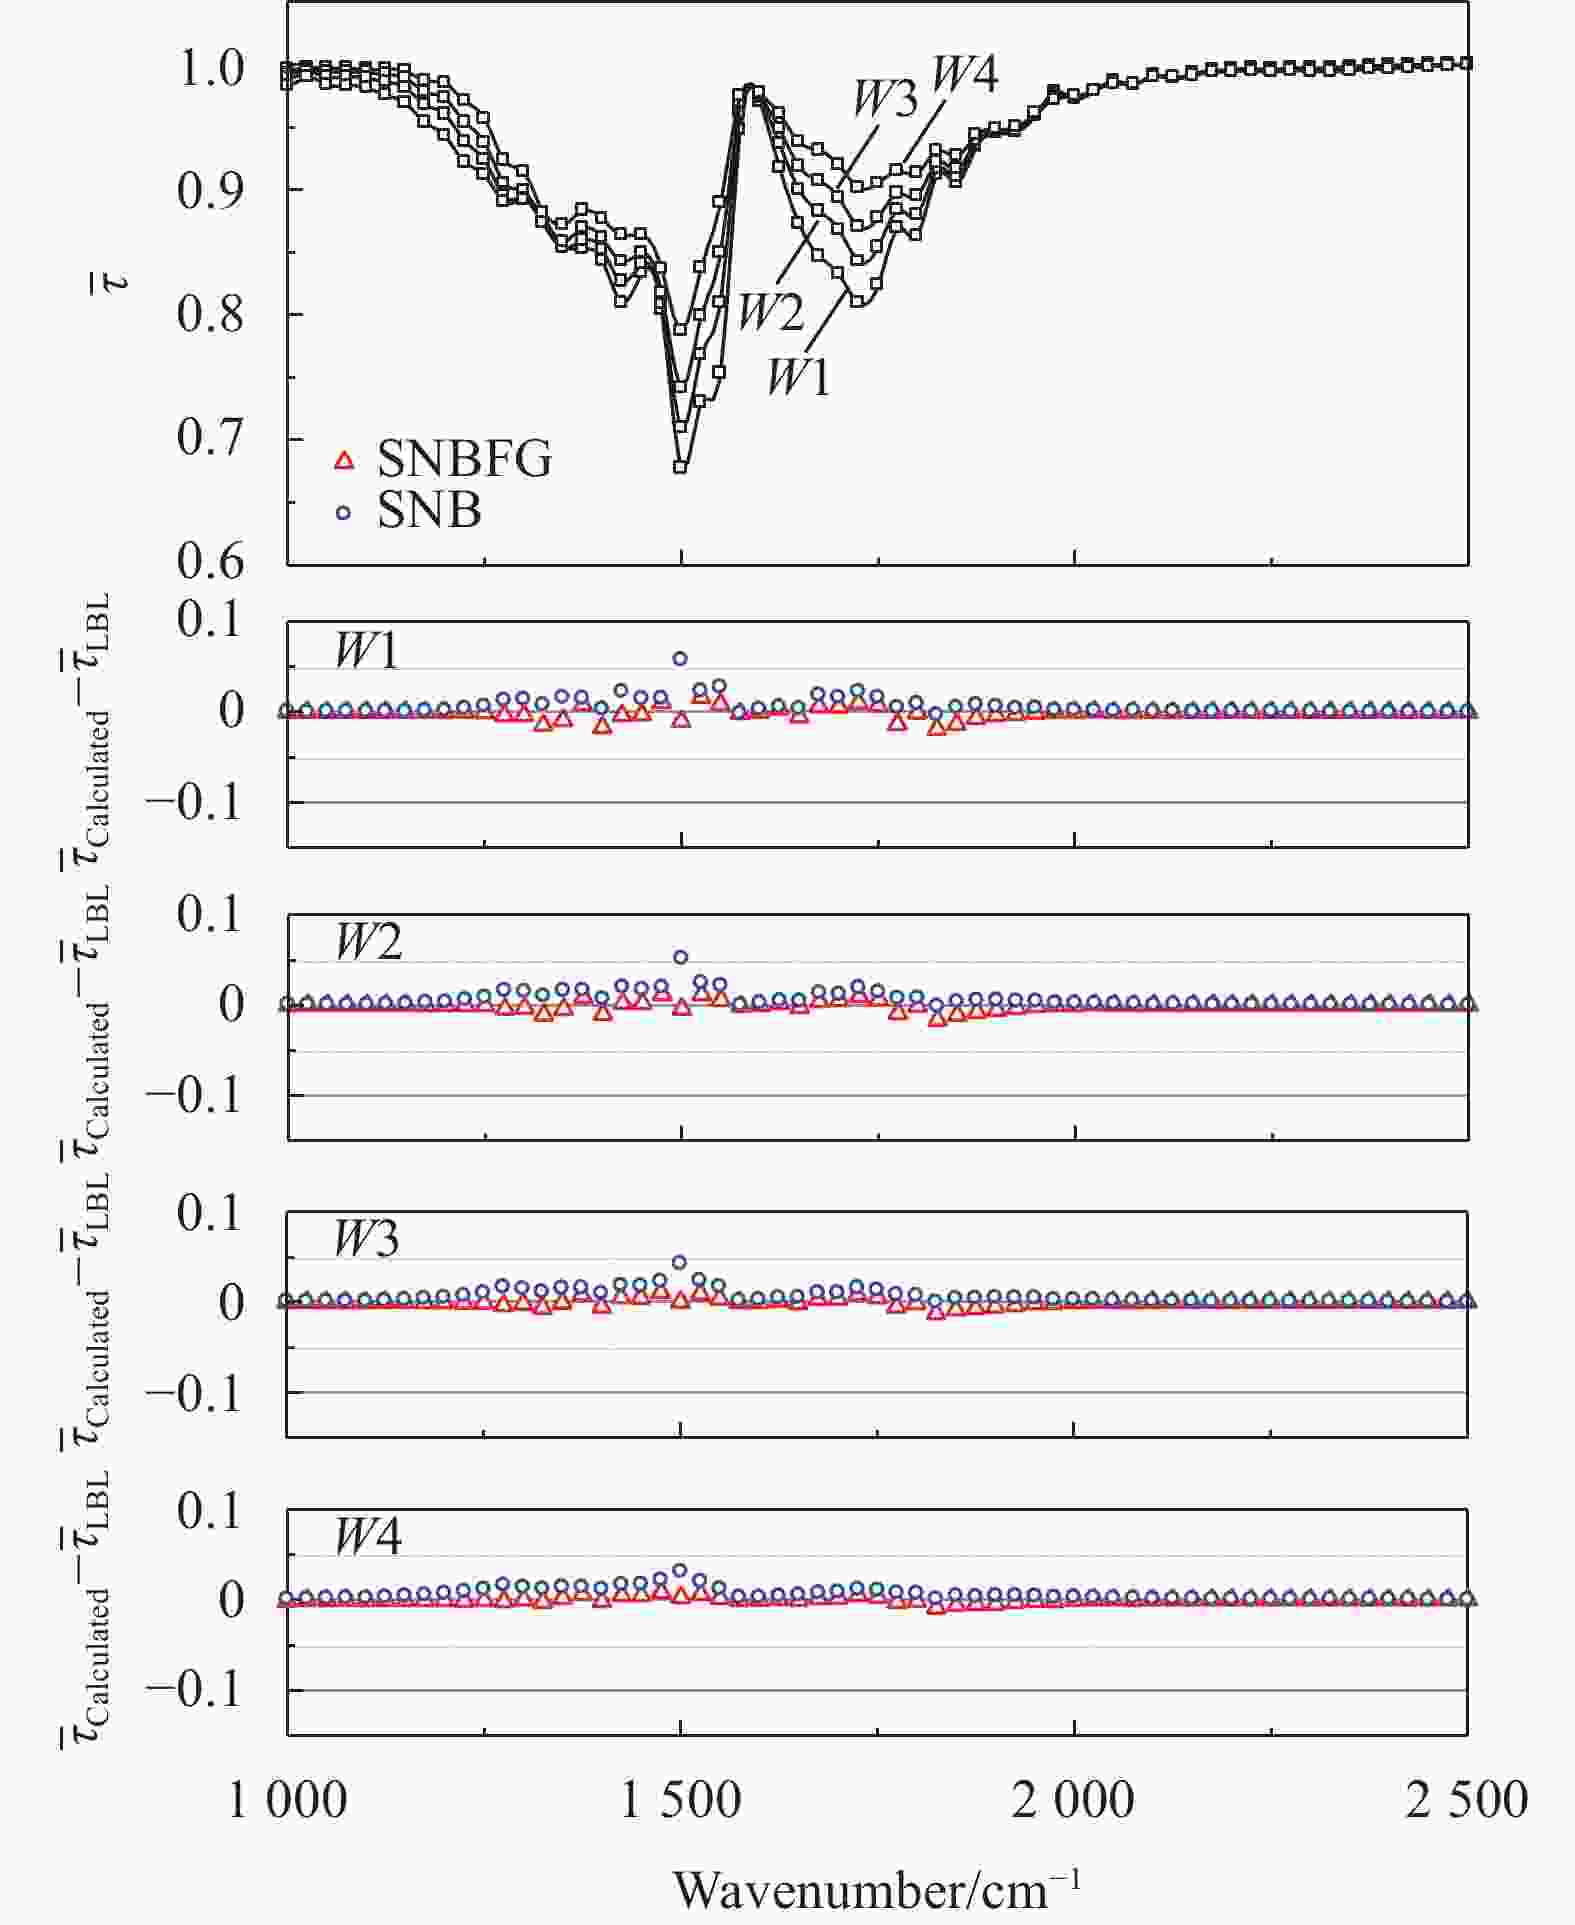
图 4 等温、均匀条件下H2O在6.3 μm吸收带的谱带平均透过率
Figure 4. Transmissivity for 6.3 μm band of H2O in isothermal and homogeneous column

图 5 等温、均匀条件下H2O在2.7 μm吸收带的谱带平均透过率
Figure 5. Transmissivity for 2.7 μm band of H2O in isothermal and homogeneous column
在6.3 μm吸收带,SNBFG模型的计算结果与LBL的计算结果基本相同,如图4所示。不同温度条件下,SNBFG模型的最大计算误差为0.02,均方根误差最大为0.005。SNB模型的计算结果与LBL的计算结果之间的差异主要集中在1500 cm−1附近,如图4所示。不同温度条件下,SNB模型的最大计算误差为0.06,均方根误差最大为0.006。
在2.7 μm吸收带,SNBFG模型和SNB模型的计算结果与LBL的计算结果之间的差异主要集中在3300~4100 cm−1范围内,如图5所示。不同温度条件下,SNBFG模型的最大计算误差为−0.02,最大均方根误差为0.005;SNB模型的最大计算误差为0.02,最大均方根误差为0.006。
在等温、均匀条件下,H2O在6.3 μm和2.7 μm吸收带内的谱带发射率计算结果分别如图6和图7所示。在6.3 μm和2.7 μm吸收带,SNBFG模型计算的谱带发射率均大于LBL的计算结果,且随着温度增加,计算误差逐渐减小;SNB模型计算的谱带发射率均小于LBL的计算结果,且随着温度增加,计算误差逐渐减增加。在6.3 μm吸收带,SNBFG模型的最大误差为|RE|=1.3%,SNB模型的最大误差|RE|=13.0%,前者明显小于后者;在2.7 μm吸收带,SNBFG模型的最大误差为|RE|= 6.6%,SNB模型的最大误差|RE|= 8.9%,前者小于后者。
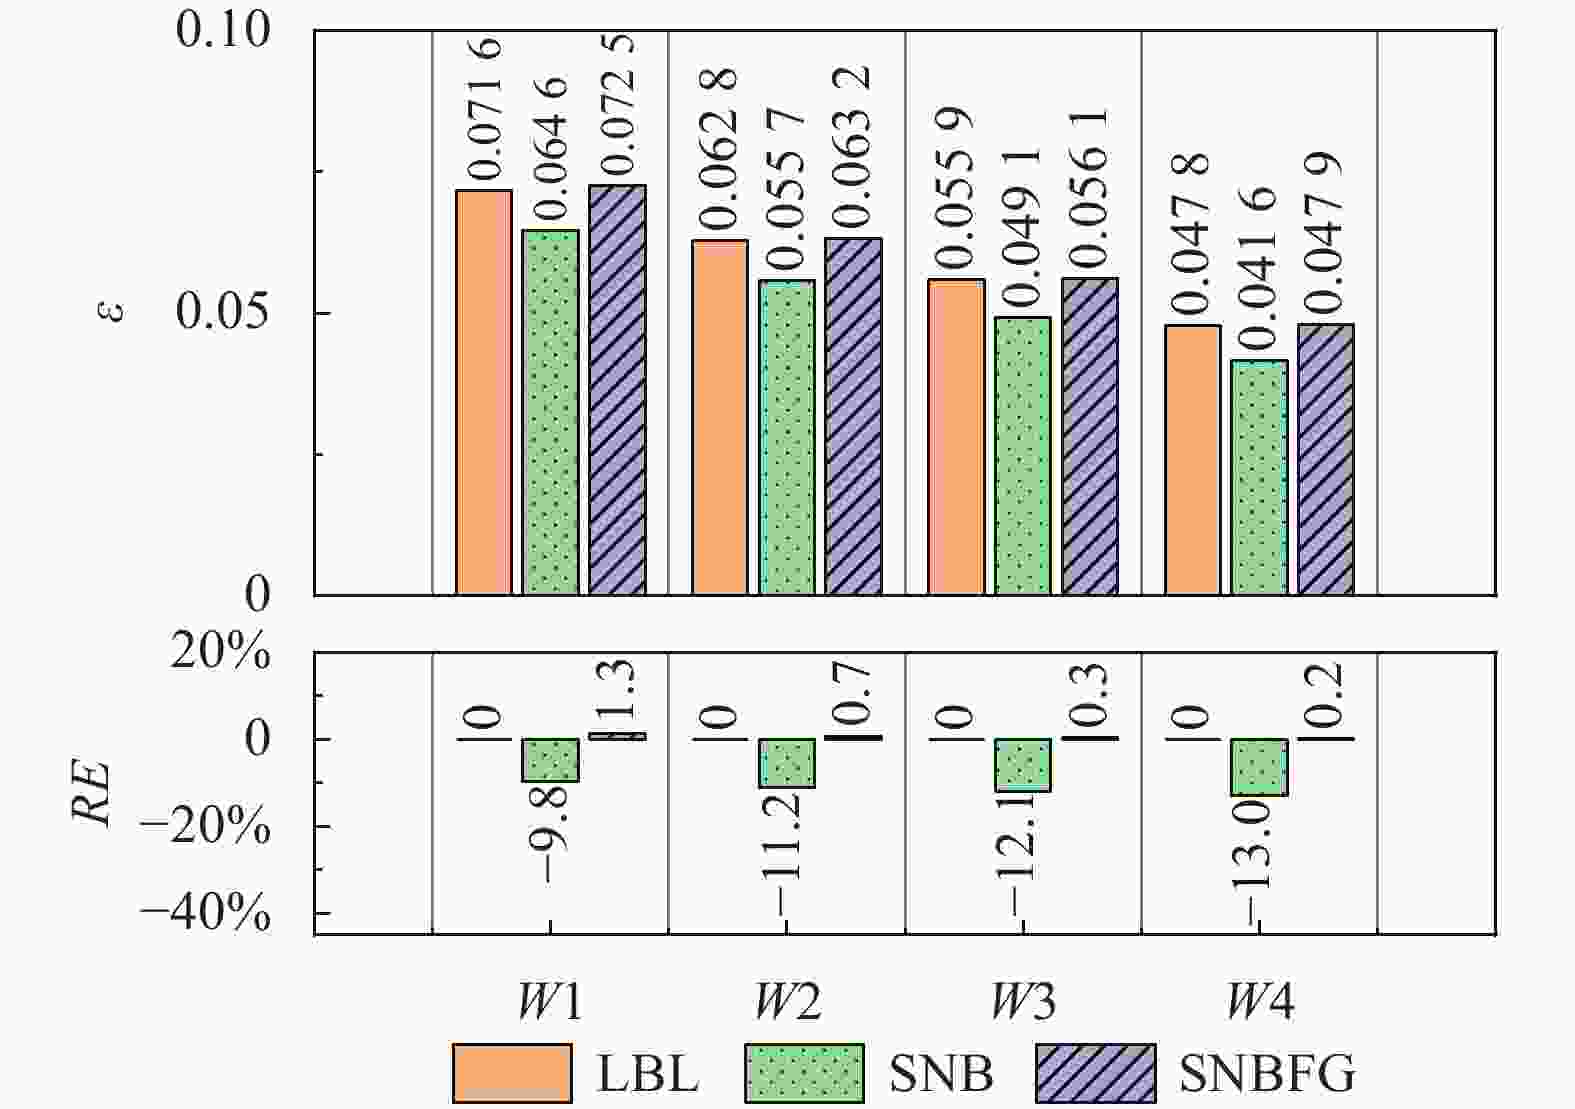
图 6 等温、均匀条件下H2O在6.3 μm吸收带的谱带发射率
Figure 6. Band emissivity for 6.3 μm band of H2O in isothermal and homogeneous column

图 7 等温、均匀条件下H2O在2.7 μm吸收带的谱带发射率
Figure 7. Band emissivity for 2.7 μm band of H2O in isothermal and homogeneous column
总体上看,在等温、均匀条件下,对于H2O在6.3 μm和2.7 μm吸收带辐射特性参数的计算,SNBFG模型的计算误差小于SNB模型的计算误差,且随着温度的增加,SNBFG模型对计算精度的提升越明显,如图6和图7所示。
图8和图9是在非等温、非均匀条件下,SNBFG模型和SNB模型计算的H2O在6.3 μm和2.7 μm吸收带的谱带平均透过率与LBL计算结果的对比。在6.3 μm吸收带,SNBFG模型的计算误差明显小于SNB模型的计算误差,SNBFG模型的最大计算误差为0.03,均方根误差为0.010;SNB模型的最大计算误差为0.06,均方根误差为0.014。在2.7 μm吸收带,SNBFG模型的最大误差为−0.04,均方根误差为0.010;SNB模型的最大误差为0.04,均方根误差为0.012。总体上看,在非等温、非均匀条件下,对于H2O在6.3 μm和2.7 μm吸收带的谱带平均透过率,SNBFG模型的计算误差小于SNB模型的计算误差,后者的最大均方根误差是前者的1.4倍。

图 8 非等温、非均匀条件下H2O在6.3 μm吸收带的谱带平均透过率
Figure 8. Transmissivity for 6.3 μm band of H2O in nonisothermal and nonhomogeneous column

图 9 非等温、非均匀条件下H2O在2.7 μm吸收带的谱带平均透过率
Figure 9. Transmissivity for 2.7 μm band of H2O in nonisothermal and nonhomogeneous column
-
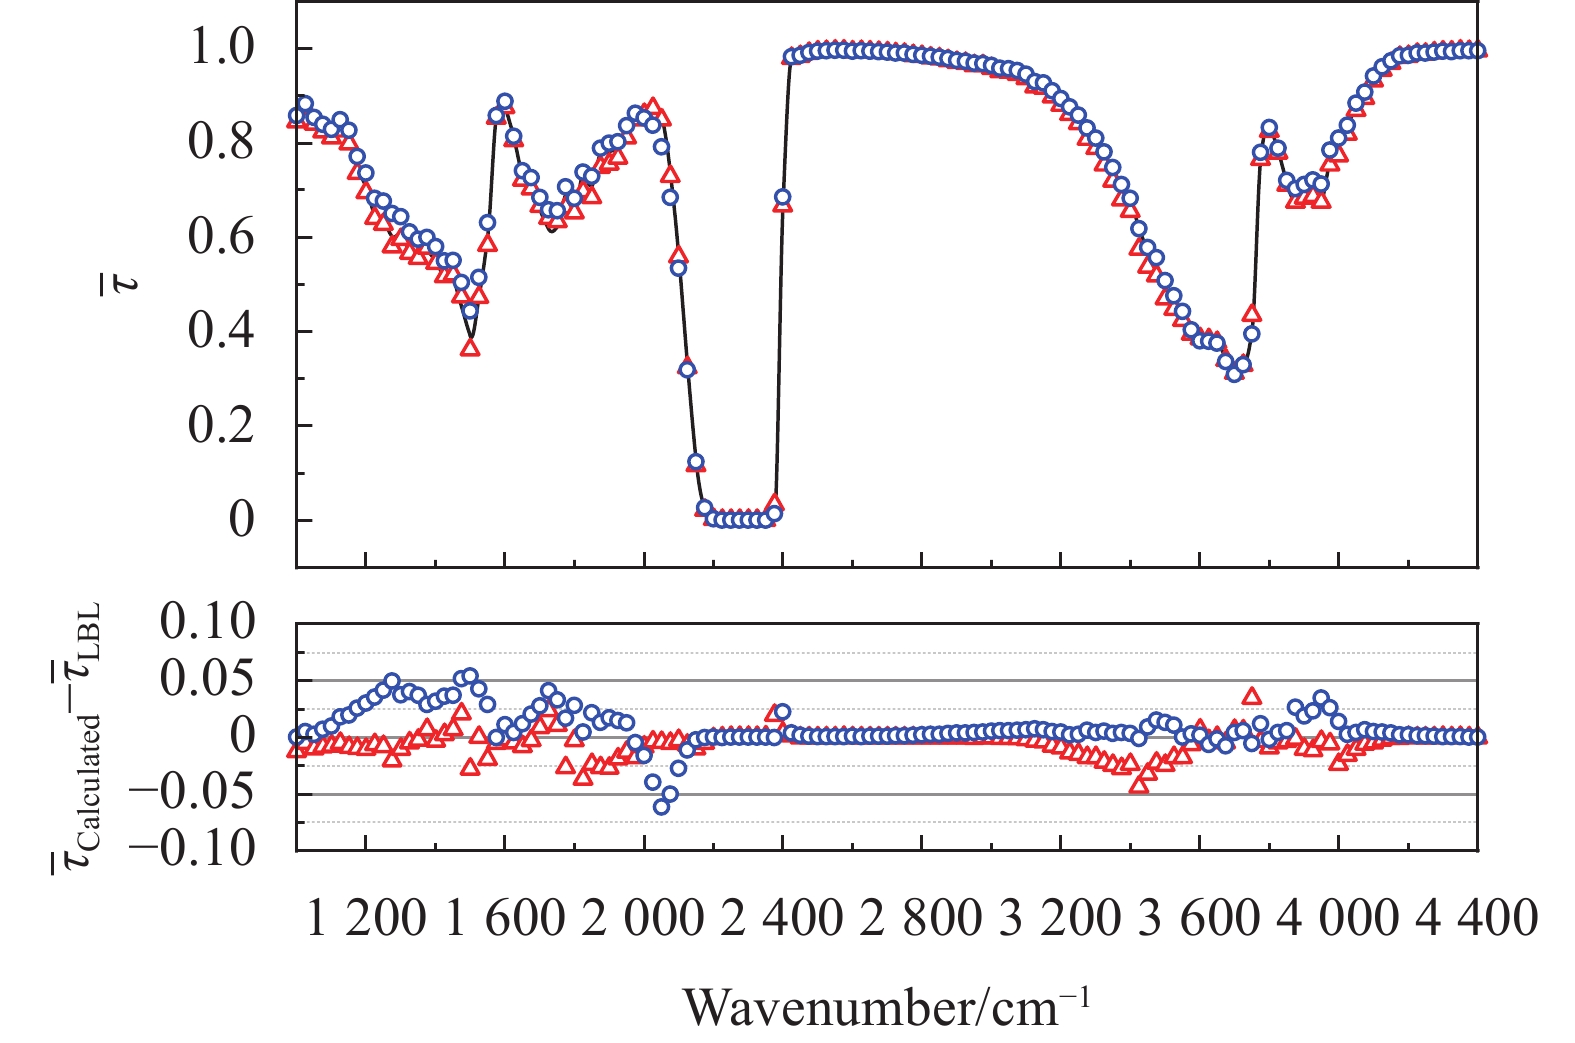
文中基于HITEMP2010数据库计算了CO2-H2O-N2混合气体在非等温、非均匀条件下的谱带平均透过率。非等温、非均匀混合气体由三段等温、均匀混合气体组成,各段参数见表7。计算波数范围为1000~4400 cm−1,覆盖了CO2的4.3 μm吸收带以及H2O的6.3 μm和2.7 μm吸收带。
表 7 非等温、非均匀CO2-H2O-N2混合气体计算条件
Table 7. Calculation conditions for CO2-H2O-N2 mixture in nonisothermal and nonhomogeneous columns
Path T/K P/atm ${x_{{\text{C}}{{\text{O}}_{\text{2}}}}}$ ${x_{{{\text{H}}_{\text{2}}}{\text{O}}}}$ ${x_{{{\text{N}}_{\text{2}}}}}$ l/cm 1 2 000 1.0 0.10 0.10 0.8 50 2 1500 1.0 0.06 0.06 0.88 50 3 800 1.0 0.04 0.03 0.93 50 图10给出了在非等温、非均匀条件下,CO2-H2O-N2混合气体在1000~4400 cm−1范围内的谱带平均透过率的计算结果。结果表明,对于谱带平均透过率的计算,SNBFG模型的最大误差为−0.04,均方根误差为0.012;SNB模型的最大误差为−0.06,均方根误差为0.018。总体上看,在非等温、非均匀条件下,对于CO2-H2O-N2混合气体在1000~4400 cm−1内的辐射特性参数,SNBFG模型的计算误差明显小于SNB模型的计算误差,后者的均方根误差是前者的1.5倍。
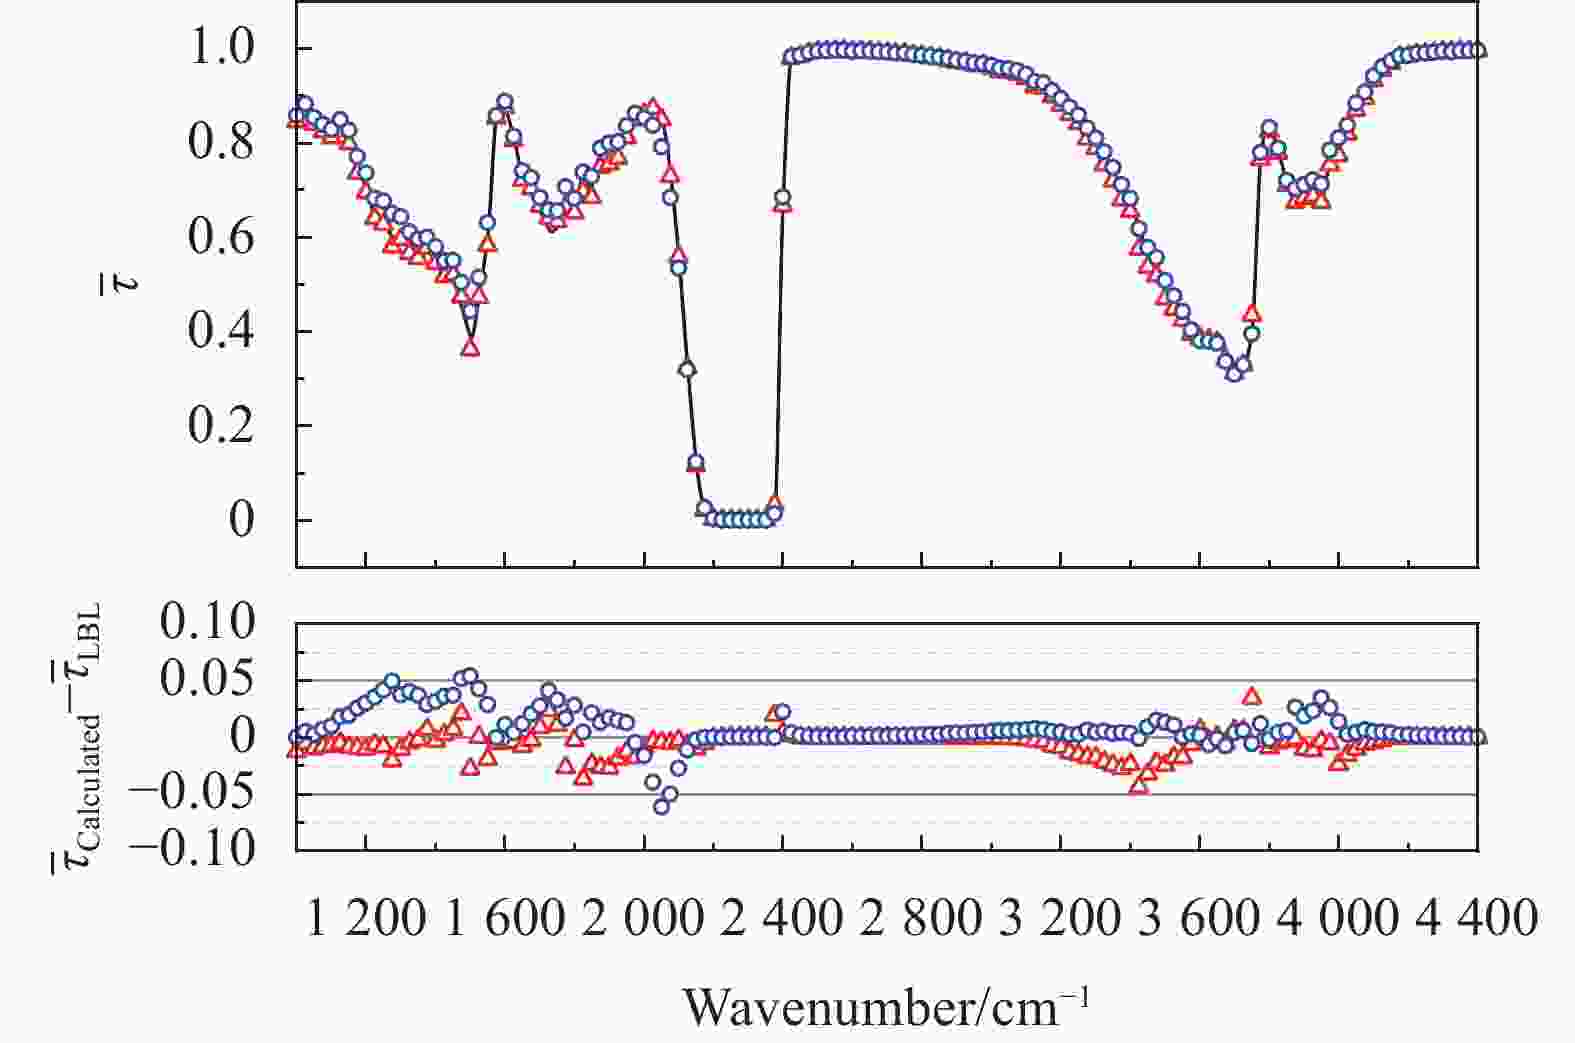
图 10 非等温、非均匀条件下CO2-H2O-N2混合气体的谱带平均透过率
Figure 10. Transmissivity for CO2-H2O-N2 mixture in nonisothermal and nonhomogeneous column
-
文中对航空发动机燃气红外辐射特性参数计算模型进行了研究,可以得到以下结论:
(1)等温、均匀条件下,与传统的SNB模型相比,SNBFG模型并不能有效地降低燃气介质辐射特性参数的计算误差,甚至会在一定程度上增加计算误差;
(2)非等温、非均匀条件下,与传统的SNB模型相比,SNBFG模型能够显著降低燃气介质辐射特性参数的计算误差;
(3)与传统的SNB模型相比,SNBFG模型对温度变化的敏感程度更低。采用SNBFG模型可以有效地降低航空发动机排气系统高温燃气红外辐射特性的计算误差。
存在的问题:与传统的SNB模型相比,采用SNBFG模型会增加计算工作量。
Fictitious gas-based model for calculating radiation characteristics of gas
-
摘要: 为了降低航空发动机排气系统高温燃气红外辐射特性的计算误差,发展了基于假设气体法的Malkmus统计窄谱带模型,并通过与逐线计算法的计算结果对比,验证了该模型的准确性。结果表明,基于假设气体法的Malkmus统计窄谱带模型能够显著降低非等温、非均匀高温燃气辐射特性参数的计算误差。在非等温、非均匀条件下,对CO2-H2O-N2混合气体谱带平均透过率的计算结果表明,传统的Malkmus统计窄谱带模型的均方根误差为0.018,而基于假设气体法的Malkmus统计窄谱带模型的均方根误差为0.012,后者的计算误差相对前者降低了33.3%。Abstract: The classical Malkmus statistical narrow-band model was extended with a fictitious gas method to improve the numerical accuracy of the infrared radiation signature of high-temperature gas in aeroengine exhaust systems. In this study, the accuracy of the extended model and the classical Malkmus statistical narrow-band model were evaluated. The results show that the numerical accuracy of the classical Malkmus statistical narrow-band model was improved significantly by the fictitious gas assumption, particularly for nonisothermal and nonhomogeneous gases. Compared with the line-by-line results, the root mean square error of the classical Malkmus statistical narrow-band model for the average band transmissivity of CO2-H2O-N2 mixture is 0.018, while the root mean square error of the fictitious gas-based Malkmus statistical narrow-band model is 0.012, which is reduced by 33.3% compared with the former.
-
Key words:
- fictitious gas method /
- gas radiation /
- narrow-band model /
- aero-engine /
- infrared radiation
-
图 1 等温、均匀条件下CO2在4.3 μm吸收带的谱带平均透过率
Figure 1. Transmissivity for 4.3 μm band of CO2 in isothermal and homogeneous column
图 2 等温、均匀条件下CO2在4.3 μm吸收带的谱带发射率
Figure 2. Band emissivity for 4.3 μm band of CO2 in isothermal and homogeneous column
图 3 非等温、非均匀条件下CO2在4.3 μm吸收带的谱带平均透过率
Figure 3. Transmissivity for 4.3 μm band of CO2 in nonisothermal and nonhomogeneous column
图 4 等温、均匀条件下H2O在6.3 μm吸收带的谱带平均透过率
Figure 4. Transmissivity for 6.3 μm band of H2O in isothermal and homogeneous column
图 5 等温、均匀条件下H2O在2.7 μm吸收带的谱带平均透过率
Figure 5. Transmissivity for 2.7 μm band of H2O in isothermal and homogeneous column
图 6 等温、均匀条件下H2O在6.3 μm吸收带的谱带发射率
Figure 6. Band emissivity for 6.3 μm band of H2O in isothermal and homogeneous column
图 7 等温、均匀条件下H2O在2.7 μm吸收带的谱带发射率
Figure 7. Band emissivity for 2.7 μm band of H2O in isothermal and homogeneous column
图 8 非等温、非均匀条件下H2O在6.3 μm吸收带的谱带平均透过率
Figure 8. Transmissivity for 6.3 μm band of H2O in nonisothermal and nonhomogeneous column
图 9 非等温、非均匀条件下H2O在2.7 μm吸收带的谱带平均透过率
Figure 9. Transmissivity for 2.7 μm band of H2O in nonisothermal and nonhomogeneous column
图 10 非等温、非均匀条件下CO2-H2O-N2混合气体的谱带平均透过率
Figure 10. Transmissivity for CO2-H2O-N2 mixture in nonisothermal and nonhomogeneous column
Species Broadener ${\bar \gamma _{ij}}$ ${n_{ij}}$ ${\bar \gamma _{ii}}$ ${n_{ii}}$ H2O H2O 0.079 0.5 0.462 1.0 CO2 0.106 0.5 CO 0.079 0.5 N2 0.079 0.5 O2 0.036 0.5 CO2 H2O 0.1 0.7 0.012 0.7 CO2 0.058 0.7 CO 0.058 0.7 N2 0.058 0.7 O2 0.058 0.7  下载: 导出CSV
Classes E/cm−1 G1 0-1500 G2 1500-3000 G3 3000-4500 G4 4500-6500 G5 6500-∞
下载: 导出CSV
表 3 等温、均匀CO2气体计算条件
Table 3. Calculation conditions for CO2 in isothermal and homogeneous columns
Case T/K P/atm ${x_{{\text{C}}{{\text{O}}_{\text{2}}}}}$ ${x_{{{\text{H}}_{\text{2}}}{\text{O}}}}$ ${x_{{{\text{N}}_{\text{2}}}}}$ l/cm C1 800 1.0 0.04 0 0.96 50 C2 1000 1.0 0.04 0 0.96 50 C3 1200 1.0 0.04 0 0.96 50 C4 1500 1.0 0.04 0 0.96 50
下载: 导出CSV
表 4 非等温、非均匀CO2气体计算条件
Table 4. Calculation conditions for CO2 in nonisothermal and nonhomogeneous columns
Column T/K P/atm ${x_{{\text{C}}{{\text{O}}_{\text{2}}}}}$ ${x_{{{\text{H}}_{\text{2}}}{\text{O}}}}$ ${x_{{{\text{N}}_{\text{2}}}}}$ l/cm 1 800 1.0 0.01 0 0.99 50 2 1500 1.0 0.06 0 0.94 50 3 2 000 1.0 0.10 0 0.90 50
下载: 导出CSV
表 5 等温、均匀气体H2O计算条件
Table 5. Calculation conditions for H2O in isothermal and homogeneous columns
Case T/K P/atm ${x_{{\text{C}}{{\text{O}}_{\text{2}}}}}$ ${x_{{{\text{H}}_{\text{2}}}{\text{O}}}}$ ${x_{{{\text{N}}_{\text{2}}}}}$ l/cm W1 800 1.0 0 0.03 0.97 50 W2 1000 1.0 0 0.03 0.97 50 W3 1200 1.0 0 0.03 0.97 50 W4 1500 1.0 0 0.03 0.97 50
下载: 导出CSV
表 6 非等温、非均匀气体H2O计算条件
Table 6. Calculation conditions for H2O in nonisothermal and nonhomogeneous columns
Column T/K P/atm ${x_{{\text{C}}{{\text{O}}_{\text{2}}}}}$ ${x_{{{\text{H}}_{\text{2}}}{\text{O}}}}$ ${x_{{{\text{N}}_{\text{2}}}}}$ l/cm 1 800 1.0 0 0.01 0.99 50 2 1500 1.0 0 0.06 0.94 50 3 2000 1.0 0 0.10 0.90 50
下载: 导出CSV
表 7 非等温、非均匀CO2-H2O-N2混合气体计算条件
Table 7. Calculation conditions for CO2-H2O-N2 mixture in nonisothermal and nonhomogeneous columns
Path T/K P/atm ${x_{{\text{C}}{{\text{O}}_{\text{2}}}}}$ ${x_{{{\text{H}}_{\text{2}}}{\text{O}}}}$ ${x_{{{\text{N}}_{\text{2}}}}}$ l/cm 1 2 000 1.0 0.10 0.10 0.8 50 2 1500 1.0 0.06 0.06 0.88 50 3 800 1.0 0.04 0.03 0.93 50
下载: 导出CSV
-
[1] Mahulikar S P, Sonawane H R, Rao G A. Infrared signature studies of aerospace vehicles [J]. Progress in Aerospace Sciences, 2007, 43(7): 218-245. [2] Cheng W, Wang Z X, Zhou L, et al. Infrared signature of serpentine nozzle with engine swirl [J]. Aerospace Science and Technology, 2019, 86: 794-804. doi: 10.1016/j.ast.2019.01.057 [3] Zheng S, Yang Y, Zhou H C. The effect of different HITRAN databases on the accuracy of the SNB and SNBCK calculations [J]. International Journal of Heat and Mass Transfer, 2019, 129: 1232-1241. doi: 10.1016/j.ijheatmasstransfer.2018.10.067 [4] Wang Z H. Numerical study on radiative heat transfer of high temperature non-gray medium at high temperature part in engine[D]. Harbin: Harbin Institute of Technology, 2017. (in Chinese) [5] Yue Z Y, Reitz R D. Numerical investigation of radiative heat transfer in internal combustion engines [J]. Applied Energy, 2019, 235: 147-163. doi: 10.1016/j.apenergy.2018.10.098 [6] Niu Q L, Fu D B, Dong S K, et al. A simplified model for fast estimating infrared thermal radiation of low-altitude under-expanded exhaust plumes [J]. International Journal of Heat and Mass Transfer, 2019, 136: 276-287. doi: 10.1016/j.ijheatmasstransfer.2019.03.003 [7] Jin J, Zhu G J, Xu N R, et al. Numerical simulation of infrared radiation characteristics for aeroengine high-speed exhaust system [J]. Journal of Aerospace Power, 2022, 17(5): 582-585. (in Chinese) [8] Chen L H. Numerical simulation on the infrared radiation/radar cross section characteristics of exhaust system of the aircraft[D]. Xi’an: Northwestern Polytechnical University, 2013. (in Chinese) [9] Gao X. Investigation on the infrared radiation and radar scattering characteristics of aircraft and engine [D]. Xi’an: Northwestern Polytechnical University, 2016. (in Chinese) [10] Cheng W. Infrared signature prediction and optimization design method for serpentine nozzle[D]. Xi’an: Northwestern Polytechnical University, 2019. (in Chinese) [11] Chen S G, Chen L H, Mo D L, et al. Construction of Malkmus statistical narrow spectral band model parameters database based on HITEMP2010 [J]. Infrared and Laser Engineering, 2015, 44(8): 2327-2333. (in Chinese) [12] Rivière P, Soufiani A, Taine J. Correlated-k and fictitious gas methods for H2O near 2.7 μm [J]. Journal of Quantitative Spectroscopy & Radiative Transfer, 1992, 48(2): 187-203. [13] Leon R, Taine J. A fictive gas-method for accurate computations of low-resolution IR gas transmissivities: Application to the 4.3 μm CO2 band [J]. Revue de Physique Appliquee, 1986, 21(12): 825-831. doi: 10.1051/rphysap:019860021012082500 [14] Rivière P, Soufiani A, Taine J. Correlated-k fictitious gas model for H2O infrared radiation in the voigt regime [J]. Journal of Quantitative Spectroscopy & Radiative Transfer, 1995, 53(3): 335-346. [15] Soufiani A, André F, Taine J. A fictitious-gas based statistical narrow-band model for IR long-range sensing of H2O at high temperature [J]. Journal of Quantitative Spectroscopy & Radiative Transfer, 2002, 73: 339-347. [16] Soufiani A, Hartmann J M, Taine J. Validity of band-model calculations for CO2 and H2O application to radiative properties and conductive-radiative transfer [J]. Journal of Quantitative Spectroscopy & Radiative Transfer, 1985, 33(3): 243-257. [17] Soufiani A, Taine J. High temperature gas radiative property parameters of statistical narrow-band model for H2O, CO2 and CO, and correlated-K model for H2O and CO2 [J]. International Journal of Heat and Mass Transfer, 1997, 40(4): 987-991. doi: 10.1016/0017-9310(96)00129-9 [18] Gamache R R, Kennedy S, Hawkins R, et al. Total internal partition sums for molecules in the terrestrial atmosphere [J]. Journal of Molecular Structure, 2000, 517: 407-425. [19] Cheng W, Wang Z X, Zhou L, et al. Influences of shield ratio on the infrared signature of serpentine nozzle [J]. Aerospace Science and Technology, 2017, 71: 299-311. doi: 10.1016/j.ast.2017.09.001 [20] Rothman L S, Gordon I E, Barber R J, et al. HITEMP, the high-temperature molecular spectroscopic database [J]. Journal of Quantitative Spectroscopy & Radiative Transfer, 2010, 111(15): 2139-2150. -

 点击查看大图

计量
- 文章访问数: 292
- HTML全文浏览量: 44
- PDF下载量: 44
- 被引次数: 0