


-
多层胶接结构主要由复合材料和胶粘剂组成,在机械工业、航空航天等领域发挥着重要作用[1]。多层胶接结构的粘接过程主要依靠人工涂胶方法实现,若胶粘剂涂抹不均,将导致应力分布不平衡,从而降低构件间的连接强度,因此涂胶的均匀程度是保障多层胶接结构粘接强度的关键[2]。太赫兹时域光谱技术(THz-TDS)因具有光子能量低、穿透性强等特点,是目前无损检测领域中,最为安全、精度最高的无损检测技术之一[3-5],已被证明能够有效实现多层胶接结构材料内部的孔洞、脱粘和分层等缺陷的无损检测[6-8]。并且基于太赫兹时域光谱技术进行材料表面均匀度的研究工作已见报道,如李丽娟等对铝板表面涂抹的胶粘剂的厚度分布离散程度进行了研究,通过飞行时间建立厚度提取模型对其进行评价[9];于淼等对金属表面均匀度进行了研究,同样利用飞行时间对均匀性进行表征[10],但目前对于具有复杂胶接结构的复合材料内部胶层均匀性的研究工作尚有待开展。
文中以耐高温复合材料的多层胶接结构为研究对象,采用THz-TDS对其内部胶层进行无损检测,分别以飞行时间、能量及幅值等太赫兹时域特征信息对胶层的均匀性进行表征,用以评估多层胶接结构材料的粘接质量。首先,基于飞行时间差对实验样件胶层区域进行成像,以飞行时间相对标准差定量地对胶层均匀性进行分析;其次,基于能量积分对实验样件胶层区域进行成像,采用能量积分曲线中的峰度和偏度进行定性分析,并以能量标准偏差定量地对胶层均匀性进行分析;最后,以太赫兹时域光谱幅值作为特征参数,以幅值离散系数定量地对胶层均匀性进行评价。
-
文中采用反射式太赫兹时域光谱系统对多层胶接结构样品进行光谱检测,其工作原理见图1。飞秒激光器发射的激光脉冲经分束镜分为泵浦光和探测光,泵浦光入射到THz发射元件产生THz脉冲,探测光从分光镜出射后,经光电导取样测量获取太赫兹脉冲电场强度随时间变化的太赫兹光谱信息。检测样件时按一定顺序对垂直于THz波的传播方向的x-y平面进行采样,将实验样件放在检测区进行逐点检测,使THz波通过样品的不同点,记录样品不同位置的反射信息,得到的太赫兹时域波形数据阵列与平面各采样点相对应,最终得到反映样件特定信息的图像[11-12]。

图 1 太赫兹时域光谱系统原理图
Figure 1. Schematic diagram of terahertz time-domain spectroscopy system
实验中所采用的多层胶接结构由耐高温复合材料、上胶层、纤维垫、下胶层、金属基体等组成,样件尺寸为60 mm×60 mm,如图2所示。在制作样件的过程中,分别在4块实验样件的上下胶层涂抹胶粘剂,并在室温为23 ℃和空气湿度为15%的条件下进行固化。然后采用反射式太赫兹时域光谱系统对固化好的多层胶接结构样品进行检测,获得太赫兹时域反射光谱。当THz波从一种介质进入另一种介质时,在界面处会发生反射及透射,反射波被太赫兹接收器接收,透射部分则继续向下传播,当太赫兹脉冲入射到不同材料介质中时,由于各介质群折射率的不连续性,形成了具有不同飞行时间的反射脉冲,使获得的太赫兹时域光谱呈现出多个特征峰(谷) [13]。实验系统的采样时间窗口为0~160 ps,太赫兹波在胶层区域传播时间范围在65~120 ps之间,图2中,
${A_1}$ ~${A_2}$ 之间的波形对应于太赫兹波在样品上胶层范围传播,${A_3}$ ~${A_4}$ 之间的波形对应于太赫兹波在样品下胶层范围传播。这样太赫兹波在样品中传播过程中的时间、能量、强度变化等信息均可反映在太赫兹时域光谱图中。
图 2 多层胶接结构及太赫兹时域波形示意图
Figure 2. Schematic diagram of multiple bonding structure and terahertz time-domain waveform
-
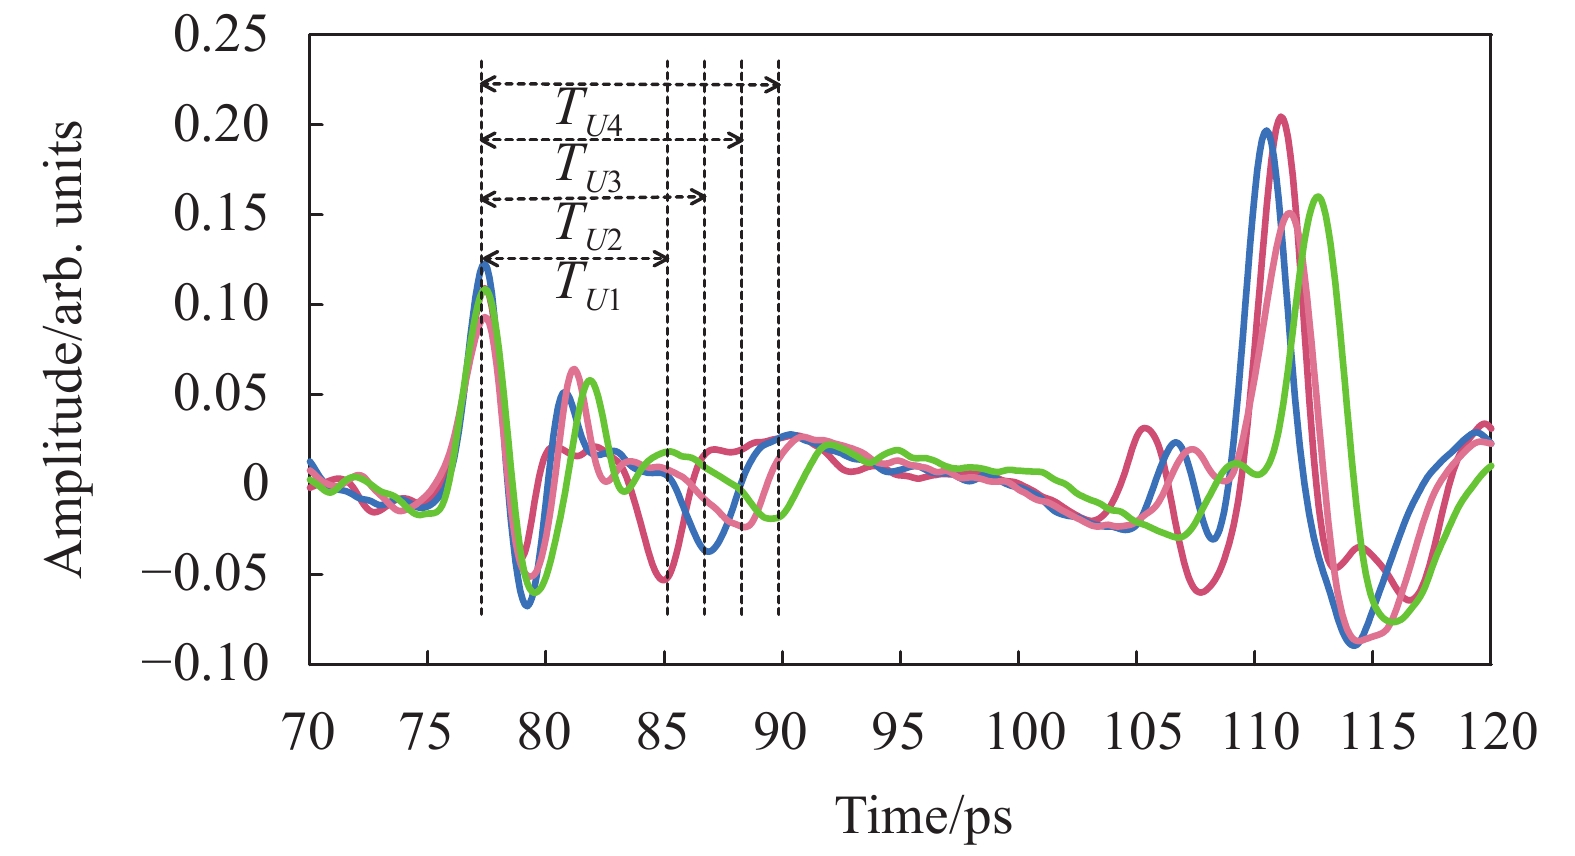
图3给出了从实验样件1随机选取4个检测点获得的太赫兹时域光谱图,由图可知,当太赫兹波入射至实验样件的上胶层的不同区域时,将具有不同的飞行时间。胶层厚度与飞行时间的关系由公式(1)决定:

图 3 上胶层不同位置处的飞行时间示意图
Figure 3. Schematic diagram of flight time at different positions of upper adhesive layer
$$ d = \frac{c}{{2n}}{T_U} $$ (1) 式中:
${T_U}$ 为上胶层飞行时间;$c$ 为光在真空中的传播速度;$n$ 为胶层折射率,即胶层厚度与飞行时间成正比。因此,可根据太赫兹飞行时间信息对胶层不同位置的厚度进行表征,实现胶层均匀性的评价。通过对整个样品的胶层区域取点获得飞行时间,即可得到胶层厚度的分布情况。对4块实验样件分别选取3600个点进行检测,并提取上胶层区域数据进行飞行时间成像,成像结果如图4所示。由图可知,样件3的色度分布相对均匀,表明该样件的胶层厚度均匀性较好,而样件1和样件4的胶层厚度均匀较差。


图 4 不同实验样件飞行时间差成像图
Figure 4. Flight time of difference imaging of different experimental samples
进一步对每个实验样件所选取3600个点的飞行时间进行离散化计算,根据公式(2)获得飞行时间相对标准差:
$$RSD{T_{uniformity}} = \frac{{\sqrt {\dfrac{1}{{n - 1}}\displaystyle\sum\limits_{i = 1}^n {(\Delta {T_i} - \Delta \overline T } {)^2}} }}{{\Delta \overline T }} \times 100 {\text{%}} $$ (2) 式中:
$\Delta \overline T $ 表示飞行时间差平均值;$\Delta {T_i}$ 表示每一点飞行时间,计算结果如表1所示,4个样件上胶层的均匀性由好到坏依次为样件3、样件2、样件1和样件4。表 1 不同实验样件飞行时间相对标准差
Table 1. Relative standard deviation of flight time of different experimental samples
Sample number 1 2 3 4 Standard deviation of flight time 8.78% 8.09% 7.30% 9.57% -
当太赫兹波穿过胶层区域时将受到胶层的吸收作用而导致能量损失,其被吸收程度与胶层厚度直接相关,因此对通过太赫兹波在胶层传播后的剩余能量进行积分求和,即可得到被胶层吸收的太赫兹波能量大小,从而实现胶层厚度的表征。图5给出了从实验样件1随机选取4个检测点获得的太赫兹时域光谱图,由图可知,太赫兹波在上胶层不同位置传播时(图中实线区域),其能量积分可由公式(3)表示:

图 5 上胶层不同厚度能量积分图
Figure 5. Energy integral diagram of different thickness of upper rubber layer
$$S = \sum\limits_{i = 1}^N {(x_1^2 + x_2^2 + \cdots + x_i^2)} $$ (3) 式中:
$S$ 为上胶层区域的能量积分值;${x_i}$ 为上胶层区域任一点的强度值。分别对4个实验样件选取3600个点进行能量积分成像,如图6所示,由图可知,样件3图像色度变化缓和,胶层厚度均匀性较好;样件1和样件4的色度变化较大,胶层厚度均匀性较差。

图 6 不同实验样件能量积分成像图
Figure 6. Energy integration imaging of different experimental samples
对实验样件上每一检测点的能量积分数值进行统计,构建能量积分曲线,利用能量积分曲线中偏度和峰度两个特征值对胶层均匀性进行分析。其中偏度是统计数据分布偏斜方向和程度的度量[14],由公式(4)表示:
$$ S[X] = E\left[{\left(\frac{{x - \mu }}{\sigma }\right)^3}\right] $$ (4) 式中:
$\mu $ 为均值;$\sigma $ 为标准差。峰度表征概率密度分布曲线在平均值处峰值高低的特征数,反映了峰部的尖度[15],由公式(5)表示:$$ K = \frac{1}{n}\sum\limits_{i = 1}^n {\left[{{\left(\frac{{{X_i} - \mu }}{\sigma }\right)}^4}\right]} $$ (5) 在胶层厚度绝对均匀的情况下,胶层上每一点的能量值比较接近,能量大小在一小段范围内浮动,因此其能量积分曲线接近一条直线,其峰度和偏度较小;在胶层厚度不均匀的情况下,胶层区域能量值差别较大,其能量积分曲线变化也较大。图7为4个实验样件的能量积分曲线,由图可知样件3积分曲线峰度和偏度较小,胶层均匀性较好,该结果与图6中的结果一致。

图 7 不同实验样件能量积分曲线图
Figure 7. Energy integration curves of different experimental samples
以能量标准偏差对胶层均匀性进行定量表征,利用公式(6)对能量标准偏差进行计算,其中
$\Delta \overline E $ 表示能量平均值,${E_i}$ 为每一点的能量值,能量标准偏差数值越小,说明胶层均匀性越好。表2给出了4个实验样件能量标准偏差,结果表明四个样件胶层均匀性由好到坏依次为样件3、样件2、样件1和样件4。表 2 不同实验样件能量标准偏差
Table 2. Energy standard deviation of different experimental samples
Sample number 1 2 3 4 Energy value
standard deviation0.95 0.9 0.71 1.01 $$SD.E.V = \sqrt {\frac{1}{{n - 1}}\sum\limits_{i = 1}^n {(\Delta {E_i} - \Delta \overline E } {)^2}} $$ (6) -
太赫兹波穿过不同厚度的胶层时形成的太赫兹时域光谱的幅值不同。图8给出了从实验样件1随机选取4个检测点获得的太赫兹时域光谱图,由图可知,不同的胶层厚度对应于不同的太赫兹时域光谱幅值,因此利用这一点可实现胶层均匀性的分析。
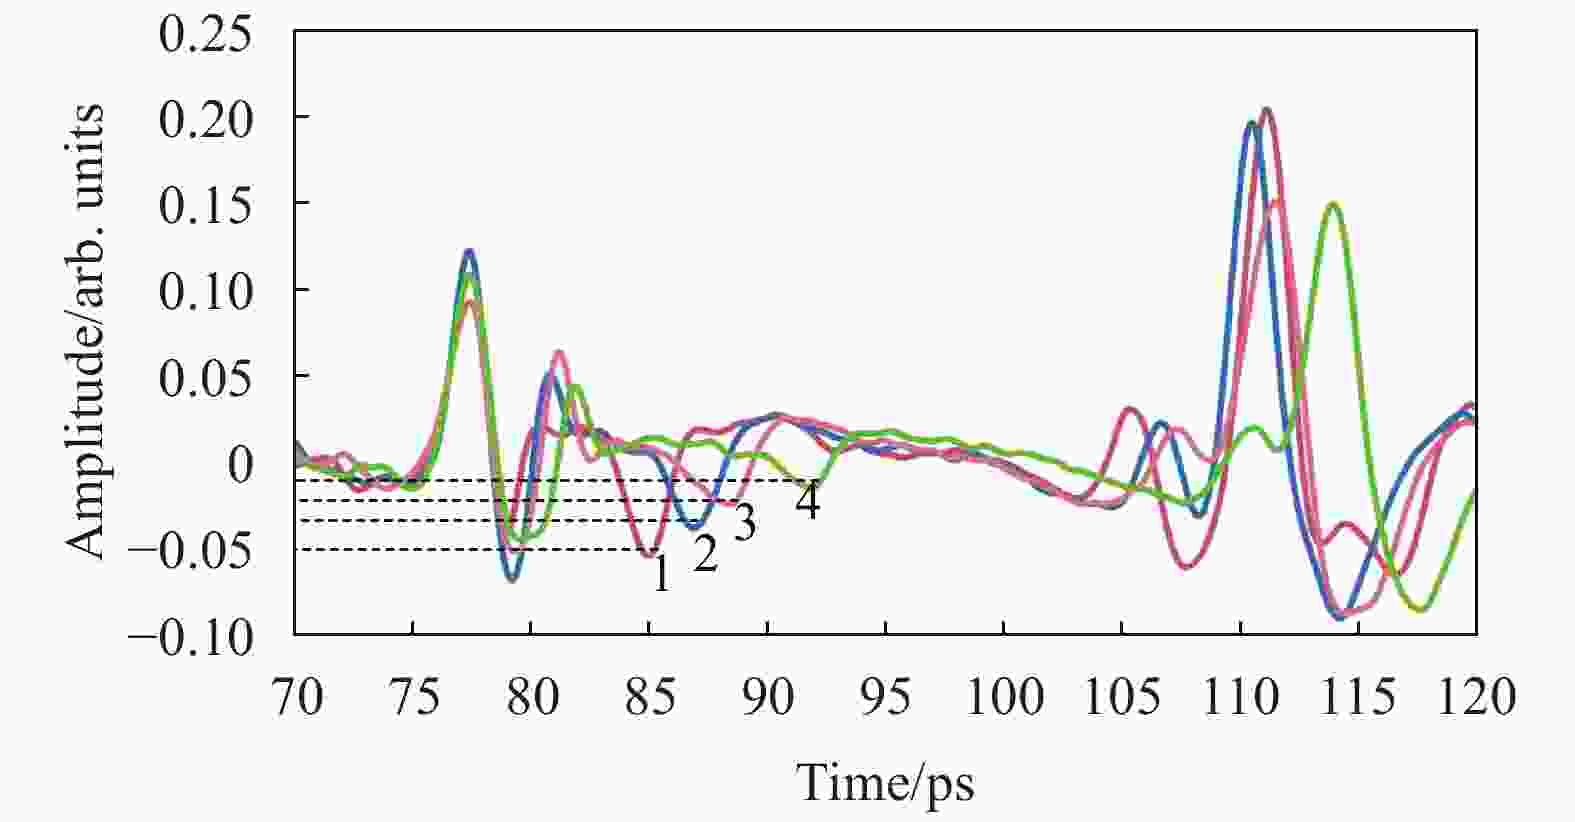
图 8 上胶层不同厚度幅值变化示意图
Figure 8. Schematic diagram of amplitude variation of different thickness of upper adhesive layer
分别对4个实验样件上的3600个点进行幅值成像,如图9所示,从幅值成像图中可以看出,样件3胶层厚度均匀性较好,而样件1和样件4胶层厚度均匀性较差。

图 9 不同实验样件幅值成像图
Figure 9. Amplitude imaging of different experimental samples
通过计算幅值离散系数对胶层均匀性进行定量表征,幅值变化范围越小,说明胶层厚度越均匀,利用公式(7)对幅值离散系数进行计算,其中
$s$ 为幅值标准差,$\overline x $ 为幅值平均值,离散系数越小,胶层均匀性越好。表3为4个实验样件幅值离散系数统计表,如表中所示,4个样件胶层厚度均匀性由好到坏依次为样件3、样件2、样件1和样件4,与前文给出的评价方法结论一致。$${V_s} = \frac{s}{{\bar x}}$$ (7) 表 3 不同实验样件幅值离散系数
Table 3. Amplitude dispersion coefficient of different experimental samples
Sample number 1 2 3 4 Amplitude dispersion coefficient 0.60 0.58 0.52 0.63 -
文中基于太赫兹时域光谱技术对4块多层胶接结构实验样件胶层的均匀性进行研究,分别利用太赫兹飞行时间、能量积分和幅值等太赫兹时域光谱参数对均匀性进行了定性和定量的表征和评价。研究结果表明,利用飞行时间、能量积分和幅值等信息对胶层区域进行成像,能够比较直观的判断胶层均匀性的好坏,但对于均匀度比较接近的样品(如样件1和样件4)难以给出直接的比较,使其应用范围受到限制;而通过计算飞行时间相对标准差、能量标准偏差及幅值离散系数,均能够有效地实现不同样件之间均匀性的比较,样件胶层均匀性由好到坏为样件3、样件2、样件1和样件4,并且能够对样品的绝对均匀性给出定量的评价。因此,文中提出的方法能够为多层胶接结构样件内部胶层厚度均匀性的评估提供可靠的手段,进而对分析样件粘接强度和使用寿命提供了有效依据。
Terahertz time domain characterization method of the adhesive layer uniformity in multiple bonding structures
-
摘要: 多层胶接结构广泛应用于航空航天领域中,其粘接强度是保障工程安全的关键因素。采用飞行时间、能量、幅值等不同的太赫兹时域光谱参数表征多层胶接结构胶层的均匀性,进而评价多层胶接结构材料的胶接质量。采用太赫兹时域光谱飞行时间成像法对胶层区域的均匀性进行定性分析,通过计算获得4块实验样件的飞行时间相对标准差分别为8.78%、8.09%、7.30%和9.57%,实现了胶层均匀性的定量评价;利用太赫兹时域光谱能量积分信息,分别采用能量积分曲线的峰度和偏度定性分析胶层均匀性,通过计算获得4块实验样件能量标准偏差分别为0.95、0.9、0.71和1.01,实现了胶层均匀性的定量评价;此外,根据太赫兹时域光谱的幅值特征信息,以幅值离散系数定量地表征胶层均匀性。研究结果表明:太赫兹时域光谱的飞行时间、能量积分及幅值3种特征参数均能够实现多层胶接结构胶层均匀性的定量评价,该方法能够为多层胶接结构粘接强度的评估提供可靠的手段。Abstract: Multilayer bonding structure is widely used in aerospace field, and its bonding strength is the key factor to ensure engineering safety. Different terahertz time-domain spectroscopy parameters such as time-of-flight, energy and amplitude were used to characterize the uniformity of the adhesive layer of multilayer bonding structure, and then evaluate the bonding quality of multilayer bonding structure materials. The uniformity of the adhesive layer was qualitatively analyzed by the terahertz time-domain spectroscopy time-of-flight imaging method. The relative standard deviations of flight time of four experimental samples are 8.78%, 8.09%, 7.30% and 9.57% respectively; Using the energy integration information of terahertz time-domain spectroscopy, the kurtosis and skewness of the energy integration curve were used to qualitatively analyze the uniformity of the adhesive layer. The energy standard deviations of four experimental samples were 0.95, 0.9, 0.71 and 1.01, respectively; In addition, according to the amplitude characteristic information of terahertz time-domain spectroscopy, the uniformity of adhesive layer was quantitatively characterized by amplitude dispersion coefficient. The results show that the time-of-flight, energy integral and amplitude of terahertz time-domain spectroscopy can be use to quantitatively evaluate the adhesive layer uniformity of multi-layer adhesive structures. This method can provide a reliable means for evaluating the adhesive strength of multi-layer adhesive structures.
-
图 1 太赫兹时域光谱系统原理图
Figure 1. Schematic diagram of terahertz time-domain spectroscopy system
图 2 多层胶接结构及太赫兹时域波形示意图
Figure 2. Schematic diagram of multiple bonding structure and terahertz time-domain waveform
图 3 上胶层不同位置处的飞行时间示意图
Figure 3. Schematic diagram of flight time at different positions of upper adhesive layer
图 4 不同实验样件飞行时间差成像图
Figure 4. Flight time of difference imaging of different experimental samples
图 5 上胶层不同厚度能量积分图
Figure 5. Energy integral diagram of different thickness of upper rubber layer
图 6 不同实验样件能量积分成像图
Figure 6. Energy integration imaging of different experimental samples
图 7 不同实验样件能量积分曲线图
Figure 7. Energy integration curves of different experimental samples
图 8 上胶层不同厚度幅值变化示意图
Figure 8. Schematic diagram of amplitude variation of different thickness of upper adhesive layer
表 1 不同实验样件飞行时间相对标准差
Table 1. Relative standard deviation of flight time of different experimental samples
Sample number 1 2 3 4 Standard deviation of flight time 8.78% 8.09% 7.30% 9.57%  下载: 导出CSV
表 2 不同实验样件能量标准偏差
Table 2. Energy standard deviation of different experimental samples
Sample number 1 2 3 4 Energy value
standard deviation0.95 0.9 0.71 1.01
下载: 导出CSV
表 3 不同实验样件幅值离散系数
Table 3. Amplitude dispersion coefficient of different experimental samples
Sample number 1 2 3 4 Amplitude dispersion coefficient 0.60 0.58 0.52 0.63
下载: 导出CSV
-
[1] 李春威. 复合材料胶接技术的发展与应用[J]. 航空制造技术, 2011(20): 88-91. doi: 10.3969/j.issn.1671-833X.2011.20.019 Li Chunwei. Development and application of composites adhesive bonding technology [J]. Aeronautical Manufacturing Technology, 2011(20): 88-91. (in Chinese) doi: 10.3969/j.issn.1671-833X.2011.20.019 [2] Jie Wang, Jin Zhang, Tianying Chang, et al. A comparative study of non-destructive evaluation of glass fiber reinforced polymer composites using terahertz, x-ray, and ultrasound imaging [J]. International Journal of Precision Engineering and Manufacturing, 2019, 6(20): 963-972. [3] 蔡禾, 郭雪娇, 和挺, 等. 太赫兹技术及其应用研究进展[J]. 中国光学与应学, 2010, 3(03): 209-222. Cai He, Guo Xuejiao, He Ting, et al. Terahertz wave and its new applications [J]. Chinese Journal of Optics and Applied Optics, 2010, 3(3): 209-222. (in Chinese) [4] Gowen A A, O'Sullivan C, O'Donnell C P. Terahertz time domain spectroscopy and imaging: Emerging techniques for food process monitoring and quality control [J]. Trends in Food Science and Technology, 2012, 25(1): 40-46. [5] Xing Liyun, Cui Hongliang, Shi Changcheng, et al. Nondestructive examination of polymethacrylimide composites structures with terahertz time-domain spectroscopy method [J]. Polymer Testing, 2017, 57: 141. doi: 10.1016/j.polymertesting.2016.11.022 [6] 周小丹, 李丽娟, 赵铎, 等. 太赫兹技术在陶瓷基复合材料缺陷无损检测中的应用[J]. 红外与激光工程, 2016, 45(08): 234-241. Zhou Xiaodan, Li Lijuan, Zhao Duo, et a1. Application of terahertz technology in nondestructive testing of ceramic matrix composite defects [J]. Infrared and Laser Engineering, 2016, 45(8): 0825001. (in Chinese) [7] 刘陵玉, 常天英, 杨传法. 太赫兹时域光谱技术检测复合材料与金属的脱粘缺陷[J]. 红外技术, 2018, 40(01): 79-84. Liu Lingyu, Chang Tianying, Yang Chuangfa. Detection of the debonding defect between a composite material and metal based on terahertz time-domain spectroscopy [J]. Infrared Technology, 2018, 40(1): 79-84. (in Chinese) [8] 郭小弟, 王强, 谷小红, 等. 玻璃纤维复合材料缺陷的太赫兹光谱检测实验分析[J]. 红外技术, 2015, 37(09): 764-768. Guo Xiaodi, Wang Qiang, Gu Xiaohong, et a1. Analysis of terahertz spectroscopic inspection experiment for glass fiber composite material defects [J]. Infrared Technology, 2015, 37(9): 764-768. (in Chinese) [9] 李丽娟, 周明星, 任姣姣. 基于太赫兹时域光谱的胶层厚度均匀性检测[J]. 激光与外, 2014, 44(07): 801-804. Li Lijuan, Zhou Mingxing, Ren Jiaojiao. Test of the adhesive thickness uniformity based on terahertz time-domain spectroscopy [J]. Laser & Infrared, 2014, 44(7): 801-804. (in Chinese) [10] 于淼, 刘伟, 王可心, 等. 基于太赫兹时域光谱技术的金属表面均匀度检测研究[J]. 航空科学技术, 2021, 32(02): 74-79. Yu Miao, Liu Wei, Wang Kexin, et a1. Research on metal surface uniformity detection based on terahertz time domain spectroscopy [J]. Aeronautical Science & Technology, 2021, 32(2): 74-79. (in Chinese) [11] 郭澜涛, 牧凯军, 邓朝, 等. 太赫兹波谱与成像技术[J]. 红外与激光工程, 2013, 42(01): 51-56. doi: 10.3969/j.issn.1007-2276.2013.01.010 Guo Lantao, Mu Kaijun, Deng Chao, et a1. Terahertz spectroscopy and imaging [J]. Infrared and Laser Engineering, 2013, 42(1): 51-56. (in Chinese) doi: 10.3969/j.issn.1007-2276.2013.01.010 [12] 方波, 戚岑科, 邓玉强, 等. 宽频段太赫兹辐射计高吸收率涂层的特性[J]. 中国激光, 2019, 46(06): 224-229. Fang Bo, Qi Cenke, Deng Yuqiang, et a1. Characteristics of highly absorptive coatings used in terahertz radiometry [J]. Chinese Journal of Lasers, 2019, 46(6): 0614020. (in Chinese) [13] 张洪桢, 何明霞, 石粒力, 等. 随机优化算法应用于太赫兹测厚方法的研究[J]. 光谱学与光谱分析, 2020, 40(10): 3066-3070. Zhang Hongzhen, He Mingxia, Shi Lili, et a1. Terahertz thickness measurement based on stochastic optimization algorithm [J]. Spectroscopy and Spectral Analysis, 2020, 40(10): 3066-3070. (in Chinese) [14] 金秉福. 粒度分析中偏度系数的影响因素及其意义[J]. 海洋科学, 2012, 36(02): 129-135. Jin Bingfu. Influencing factors and significance of the skewness coefficient in grain size analysis [J]. Marine Sciences, 2012, 36(2): 129-135. (in Chinese) [15] Joanes D N,Gill C A. Comparing measures of sample skewness and kurtosis [J]. Journal of the Royal Statistical Society (Series D), 1998, 47(1): 183-189. -

 点击查看大图

计量
- 文章访问数: 93
- HTML全文浏览量: 47
- PDF下载量: 32
- 被引次数: 0


