


-
成像光谱仪既能对目标成像又能获取目标物体的光谱信息,可以对地球表面物体的分类、物质的成分和含量等进行研究。高光谱成像的光谱分辨率高,波段连续性强,波段之间相关性大,对地表覆盖的识别能力强,使得地形要素的定量或半定量分类识别成为可能。随着高光谱遥感在地物属性探测方面的能力不断提高,应用范围越来越广,成像光谱技术得到了各个国家的普遍重视[1-6]。
成像光谱仪的主要技术指标有光谱范围、光谱分辨率、信噪比、幅宽和空间分辨率等,其中机载成像光谱仪和星载成像光谱仪比较典型的探测波段范围为可见至短波红外(0.4~2.5 μm)[7-8]。成像光谱仪可见光波段采用Si探测器,近红外波段则主要采用锑化铟(InSb)、碲镉汞(Hg1-xCdxTe)或铟镓砷(InGaAs)探测器,碲镉汞短波红外探测器的响应波段一般为1.0~2.5 μm,经过光谱拓展可以实现0.4~2.5 μm的宽谱响应,在成像光谱仪中有着广泛的应用[9-14]。探测器的光谱响应率对成像光谱的定量反演起着重要作用。另外,当成像光谱仪的幅宽较大时,必须采用多个探测器的拼接技术实现大幅宽高光谱成像,相比成像器件来说,对探测器模块的光谱响应性能的一致性提出了更高的要求,因此,研究拼接型探测器的光谱响应性能对高光谱成像具有重要意义。量子效率是衡量红外探测器光电转换性能的重要参数,准确测量探测器的光谱响应率可更加准确地测算量子效率曲线[15]。文中分析了不同中心波长和不同半带宽的滤光片对短波红外探测器测量光谱响应率的影响,实现了绝对光谱响应的准确测量,提出采用光谱响应率及其非均匀性来评价光谱成像用拼接型红外探测器的光谱响应性能。
-
所用样品为中国科学院上海技术物理研究所研制的高光谱用碲镉汞短波红外探测器,响应波段为1.0~2.5 μm, 规格为2 000×256,中心距为30 μm×60 μm,由512×256器件拼接而成,其中,2 000方向为空间维,256方向为光谱维,器件示意图如图1所示。由于探测器是由四个不同的探测器拼接而成,光谱维上的探测器的光谱响应一致性对高光谱成像应用显得尤为重要。实验中对四个512×256探测器模块进行了绝对光谱响应的测量,滤光片选用瑞典Spectrongon公司的五个型号的窄带滤光片。

图 1 2 000×256拼接型碲镉汞短波红外探测器
Figure 1. 2 000×256 mosaic Hg1-xCdxTe SWIR detector
-
测量红外探测器的光谱响应率一般有两种方法。一种方法是通过测量探测器的黑体响应率和相对光谱响应,通过公式(1)计算[16]:
$$ {{{R}}}\left({\lambda}\right)=\dfrac{{{R}}_{{b}{b}}\times {G}\left({\lambda }\right)}{{{\displaystyle\int }_{0}^{{\infty }}{G}\left({\lambda }\right)\times {{\varPhi }}_{{\lambda }}{{\rm{d}}}{\lambda }}\bigg/{{\displaystyle\int }_{0}^{{\infty }}{{\varPhi }}_{{\lambda }}{{\rm{d}}}{\lambda }}} $$ (1) 其中
$$ G(\lambda)=\frac{V_{s}(\lambda) \times G_{R}(\lambda)}{V_{S R}(\lambda)} $$ (2) 式中:R(λ)为探测器的单色响应率;λ为单色光的波长; Rbb为探测器的黑体响应率;Φλ为黑体的单色辐射功率;G(λ)为被测探测器的相对单色响应率;VSR(λ)和VS(λ)为参考探测器和被测探测器的输出信号;GR(λ)为参考探测器的相对单色响应率[16]。
另一种方法是测出响应波长范围内某一波长点上的绝对响应,再根据相对光谱响应推算到整个响应波长范围,某一波长点的获取比较难,一般用光谱宽度比较窄的带通滤光片让某一窄波段范围的光入射到探测器表面,近似为该光谱宽度中心波长点的绝对响应。文中试验采用第二种方法。
文中试验采用《红外焦平面阵列参数测试方法》(GB/T 17444)对探测器的相对光谱响应和窄带性能进行测试。
-
相对光谱响应是红外探测器的重要特性之一,描述了探测器响应率与入射波长的相对关系。相对光谱响应测试一般采用傅里叶变换法和光栅分光法[17]。傅里叶变换法采用傅里叶变换红外光谱仪、前置放大器等组成的测试系统对红外器件的光谱响应进行测试。采用傅里叶变换法测量相对光谱响应时,探测器上接收的光信号是按傅里叶频率调制的信号,与动镜扫描速度和测量的波数相关,即便是通过仪器函数进行校正,由于FTIR光谱仪中的IR光源相当于具有一定温度范围的辐射体而非单一温度黑体,光源的光谱分布以及探测器在短波一侧的响应一般较低,仍然会造成探测器在短波方向的相对光谱响应测量误差。光栅分光法用一个宽谱光源经光栅分光产生波长连续变化的单色光,记录被测探测器对不同波长的响应[18]。这两种方法获得的光谱响应一般是探测器的相对光谱响应,是探测器对不同波长光的相对响应,典型的碲镉汞短波红外探测器的相对光谱响应如图2所示。由于衍射效率和高级次衍射,光栅元件的工作范围一般都比较窄,最长波长不超过最短波长的两倍,采用光栅分光法测量相对光谱响应时,测量器件的不同波段需要切换光栅,为了在不同波段有足够的信噪比,还有需要更换光源和标准探测器。文中试验采用光栅分光的方法测量相对光谱响应。

图 2 典型的碲镉汞短波红外探测器的相对光谱响应曲线
Figure 2. Typical relative spectral response curve of the Hg1-xCdxTe SWIR detector
-
探测器的相对光谱响应测量有明确的测试方法和标准,因此,探测器光谱响应率的关键在于窄带性能的准确测量。中国科学院上海技术物理研究所研制的高光谱用碲镉汞短波红外探测器的响应波段为1~2.5 μm。为了准确判断探测器的光谱特性,希望能在1~2.5 μm波段范围内选择几个波长点进行窄带性能测试、比较。滤光片选用瑞典Spectrongon公司的五个型号的窄带滤光片,如表1所示,如果能准确获得窄带响应,结合相对光谱响应曲线,则可以获得短波红外焦平面探测器的光谱响应率。表1中的半带宽(Full Width at Half Maximum, FWHM)指滤光片最高透过率的1/2处所对应的波长,左右波长相减得到;截止范围是指除了有效带宽以外,要求截止的波长范围;截止深度(Optical Density, OD)指截止带中允许能透过光的最大透过率大小,OD=−lg(TOD)。OD3表示透过率TOD低于0.001,OD4表示透过率TOD低于0.0001,OD5表示透过率TOD低于0.00001。
表 1 滤光片的性能参数
Table 1. Specification of the filter
Filter Center
wavelength/nmFWHM/
nmPeak
transmittanceBlocking
wavelength/nmOD 1# 1225 10 50% 190-3200 OD3 2# 1670 10 60% 200-3500 OD3 3# 2062 10 60% 190-3500 OD3 4# 2420 10 60% 190-3500 OD3 5# 2470 50 70% 100-30000 OD3 -
假设探测器的截止波长为2.6 μm,光敏元大小为30 μm×60 μm,测试杜瓦的F数为0.9,F数为探测器光敏面至冷光阑开口的距离与冷光阑开口孔径之比,读出电路的积分时间为4.4 ms,积分电容为65 fF,探测器的量子效率按0.7估算,滤光片的截止范围为190~3200 nm,截止深度OD3,根据黑体辐射出射度的计算公式可以估算探测器的输出信号。
$$ M_{q}=\int_{1}^{\lambda_{c}} \frac{2 \pi c}{\lambda^{4} \times\left({\rm e}^{\tfrac{h c}{\lambda k T}-1}\right)} {\rm{d}} \lambda $$ (3) 式中:Mq为探测器响应波段的黑体辐射出射度,定义为单位辐射表面积向半球空间发射的黑体辐射通量;c为真空中的光速;h为普朗克常数;T为黑体的温度;k为玻耳兹曼常数。
辐射到样品光敏元表面的光子数计算公式为:
$$ N_{q}=\frac{\eta_{0} \times t_{\text {int }} \times A_{d} \times M_{q}}{4 \times F^{2}+1} $$ (4) 式中:$ {N}_{q} $为辐射到样品光敏元表面的光子数;η0为测试时杜瓦窗口等引起的外量子效率;tint为积分时间; $ {A}_{d} $为光敏元面积。焦平面探测器的输出电压计算公式为:
$$ {V}_{\rm out}=\frac{{\eta }_{d}\times {N}_{q}\times q}{{C}_{\rm int}} \times k $$ (5) 式中:${V}_{\rm out}$为焦平面探测器的输出电压;$ {\eta }_{d} $为探测器的量子效率;$ {N}_{q} $为辐射到样品光敏元表面的光子数;q为基本电荷;${C}_{\rm int}$为读出电路的积分电容;k为输出级增益。
由于滤光片带外截止不是完全截止,都有一定的透过率,因此估算了带外完全截止(理想滤光片)和OD3的带外截止深度的信号对比,以评估窄带滤光片带外截止对窄带性能测试的影响。表2为测试时冷屏上安装不同滤光片时,根据滤光片透过率曲线估算的探测器输出电压。
表 2 不同滤光片下的输出信号比较
Table 2. Comparison of output signal with different filters
Filter Blackbody temperature/℃ OD Wavelength range of integration/μm Photon number Output voltage/V 1# 140 - 1.22-1.23 35 6.02×10⁻⁵ OD3 1-2.60 2664 4.59×10⁻³ 2# 140 - 1.665-1.675 328997 5.67×10⁻¹ OD3 1-2.60 331610 5.71×10⁻¹ 3# 140 - 2.057-2.067 549490 9.47×10⁻¹ OD3 1-2.60 552103 9.51×10⁻¹ 4# 80 - 2.415-2.425 311731 5.37×10⁻¹ OD3 1-2.60 311890 5.37×10⁻¹ 5# 80 - 2.445-2.495 2233836 3.85 OD3 1-2.60 2234074 3.85 从表2的数据比较可以看出,在黑体温度为80 ℃下,4#和5#这两种滤光片带外截止深度OD3时对窄带性能测试影响很小。1#滤光片1~2.6 μm波段范围辐射到样品表面的光子数2664远远高于窄带带通范围1.22~1.23 μm范围的光子数35。这是由于黑体辐射的能量分布在短波方向比较少,OD3的滤光片在带外截止波段范围辐射到样品表面的光子数较多,图3为黑体辐射透过1#滤光片辐射到样品表面的光子数密度分布的理论计算结果。从图3可以看出,黑体温度为140 ℃的测试条件下,OD3滤光片的带外截止性能不能满足短波1.225 μm的窄带测试性能,目前市面上难于获得黑体温度高于140 ℃的黑体,如果滤光片的截止深度可以做到更低或者增加短波窄带滤光片的半带宽,可以更好地抑制带外截止的辐射影响。

图 3 黑体辐射透过1#滤光片到样品表面的光子通量密度分布
Figure 3. Distribution of blackbody radiation photon flux density on 1# filter
图4为黑体辐射透过5#滤光片到样品表面的光子通量密度分布的理论计算结果。从图4可以看出,黑体温度为80 ℃的测试条件下,5#滤光片的带外产生的光子数远远小于带内波段的光子数,可以用于准确测量窄带信号。

图 4 黑体辐射透过5#滤光片到样品表面的光子通量密度分布
Figure 4. Distribution of blackbody radiation photon flux density on 5# filter
表3列出了黑体温度为140 ℃时,在1.2 μm附近估算的短波波段不同半带宽和不同截止深度的滤光片对窄带性能测试的准确性的影响。
表 3 不同带外截止深度和不同半带宽的滤光片输出信号比较
Table 3. Comparison of filter output signal with diffe-rent out-of-band ODs and FWHM
Center
wavelength/nmFWHM/
nmOD Wavelength
range of
integration/μmPhoton
numberOutput
voltage/V1225 10 - 1.22-1.23 35 6.02×10⁻⁵ OD3 1-2.60 2664 4.59×10⁻³ OD6 1-2.60 38 6.50×10⁻⁵ 1225 50 - 1.20-1.25 181 3.11×10⁻⁴ OD3 1-2.60 2804 4.83×10⁻³ OD5 1-2.60 211 3.63×10⁻⁴ 1250 100 - 1.20-1.3 646 1.11×10⁻³ OD3 1-2.60 3271 5.64×10⁻³ OD5 1-2.60 672 1.16×10⁻³ 1300 200 - 1.20-1.4 4253 7.33×10⁻³ OD3 1-2.60 6875 1.18×10⁻² OD4 1-2.60 4514 7.78×10⁻³ OD5 1-2.60 4277 7.37×10⁻³ 从表3中的数据可以看出,滤光片的半带宽增加到200 nm,带外截止深度达到OD5的情况下,才可以忽略带外的黑体辐射对带内的窄带性能测试的影响。市面上短波窄带滤光片既要有较大范围的带外截止,而且截止深度达到OD5的水平,滤光片难获得,而且价格比较昂贵。
-
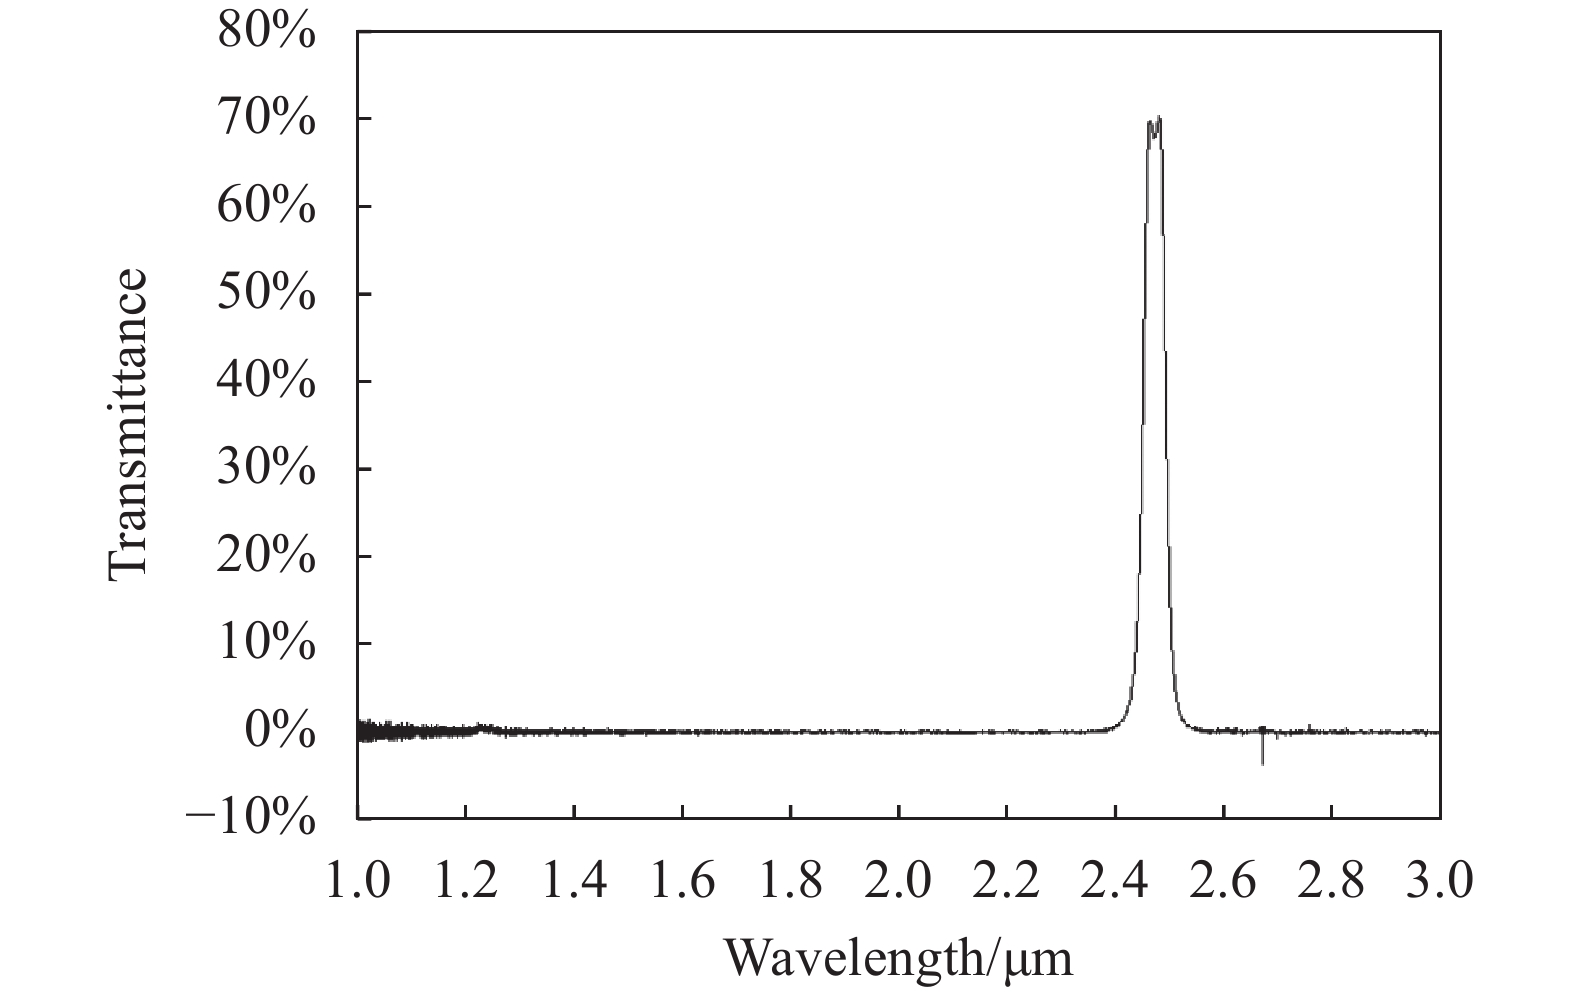
根据前面的分析,短波红外焦平面探测器用5#滤光片,即中心波长为2.47 μm、半带宽为50 nm、截止深度OD3的窄带滤光片可以准确测量窄带性能,5#滤光片的透过率曲线如图5所示,同时,2.5 μm附近的窄带响应是系统应用比较关注的性能。因此,测量2.47 μm处的窄带响应,根据该响应和相对光谱响应推算其他短波波段的光谱响应,这比直接测量短波1.2 μm的窄带性能可行性和准确性更高,探测器的相对光谱响应曲线短波方向误差比长波方向稍大,这也是在推算光谱响应率时造成误差的主要原因。为了解决这一问题,利用相对光谱响应经过标定的探测器对测试系统误差进行校准,采用该方法来获得被测探测器准确的相对光谱响应[19]。

图 5 5#滤光片的透过率曲线
Figure 5. Transmittance curve of the 5# filter
根据《红外焦平面阵列参数测试方法》[20]对四个512×256探测器进行了相对光谱响应测试,波长的步进为50 nm,测试结果如图6所示,探测器相对光谱响应一致性非常好。同时对探测器的2.47 μm处50 nm半带宽的窄带响应率进行了测试,根据2.47 μm处的绝对光谱响应,结合相对光谱响应,按比例推算,得到探测器的光谱响应率。图7为四个探测器的光谱响应率曲线,从图7可以看出,原本相对光谱响应一致性非常好的四个探测器,其光谱响应率由于每个谱段的绝对响应差异而出现了分离,图8为计算的四个探测器光谱响应非均匀性,从图中可以看出,探测器在1 μm、1.9 μm和2.5 μm处的响应非均匀性分别为6.23%、6.06%、4.07%。相比传统的测量探测器相对光谱响应和黑体响应率的方法,采用光谱响应率可以更加准确地评价短波红外探测器的光谱响应特性,有利于探测器在高光谱成像中的合理应用。
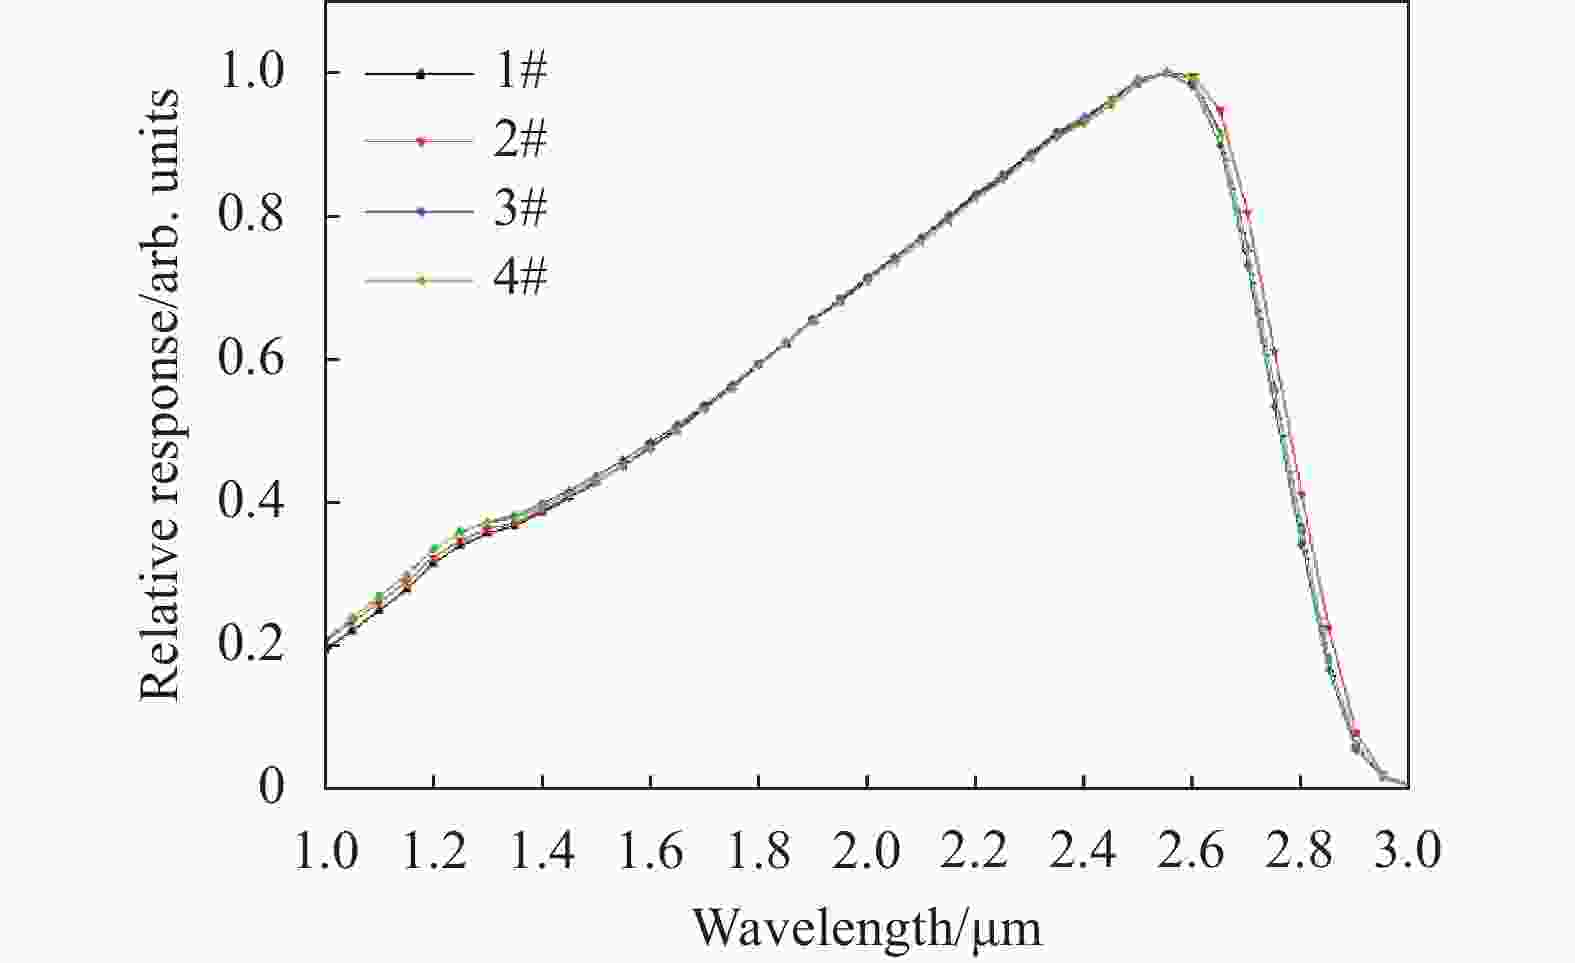
图 6 短波红外探测器的相对光谱响应曲线
Figure 6. Relative spectral response curve of the SWIR detectors

图 7 短波红外探测器的光谱响应率曲线
Figure 7. Spectral responsivity curve of SWIR detectors

图 8 短波红外探测器的光谱响应非均匀性
Figure 8. Spectral response nonuniformity of SWIR detectors
-
文中对高光谱成像用拼接型短波红外探测器光谱响应特性进行了研究,提出采用光谱响应率及其均匀性来评价光谱成像用红外探测器的光谱响应性能。分析了80 ℃和140 ℃不同的黑体温度下,选择不同半带宽以及不同带外截止深度的窄带滤光片时,带外信号对窄带性能测试误差的影响。根据分析结果,对短波红外探测器来说,中心波长2470 nm、半带宽50 nm、截止深度OD3的滤光片在测量短波红外探测器光谱响应率时,能够保证足够小的半带宽同时能准确测量窄带性能。通过准确测量相对光谱响应和窄带性能,获得了光谱响应范围1.0~2.5 μm的碲镉汞短波红外探测器的光谱响应率。光谱响应率测量实现了拼接型短波红外探测器光谱响应的定量化测量,有助于探测器在高光谱成像应用中更加准确的评价和应用。
Spectral responsivity of mosaic SWIR detectors
-
摘要: 红外探测器的光谱响应一致性影响高光谱成像仪器的动态范围,研究高光谱成像用拼接型短波红外探测器在同一光谱维的响应均匀性对提高高光谱成像性能有重要意义。通过测量相对光谱响应和窄带响应,对响应波段为1.0~2.5 μm、规格为2000×256的碲镉汞短波红外探测器光谱响应率进行测量和分析,提出用光谱响应非均匀性定量化分析光谱响应一致性。分析了在80 ℃和140 ℃不同的黑体温度下,窄带滤光片的中心波长和半带宽不同时,带外截止深度为OD3时,带外信号对窄带性能测试误差的影响。通过测量探测器模块的光谱响应率,计算拼接的2000×256探测器在1 μm、1.9 μm和2.5 μm处的响应非均匀性分别为6.23%、6.06%和4.07%。光谱响应率的准确测量实现了拼接型短波红外探测器的光谱响应一致性的定量化评价,有利于探测器在高光谱成像中的合理应用。Abstract:
Objective Hyperspectral imaging can not only get the two-dimensional geometric spatial information of the observed objects, but also obtain the continuous high-resolution spectral information which can reflect the physical and chemical characteristics of the target. It is a very important method for target detection and recognition based on hyperspectral remote sensing information. Spectral range of typical imaging spectrometer is 0.4-2.5 µm due to the ground objects' reflection of solar radiation. Mercury Cadmium Telluride (Hg1-xCdxTe) detectors cover a bandwidth of 0.8-30 µm as the alloy composition of Hg1-xCdxTe material is tuned in terms of cut-off wavelength. Hg1-xCdxTe detectors are the major part of the imaging spectrometer for detection in short waveband. As the swath width of the imaging spectrometer increased, larger scale infrared focal plane array (IRFPA) is needed. Mosaic ultra-large scale shortwave infrared (SWIR) detectors can meet the demand for wide field of view detection in space application. The detector modules for butting have their own spectral responsivity. Hyperspectral imaging demands that the mosaic IRFPA has high uniformity of the spectral response. Therefore, it is necessary to measure and analyse the spectral responsivity specification of the mosaic IRFPA accurately and quantitatively for the hyperspectral imaging application. For this purpose, a method for evaluating the absolute spectral responsivity of the mosaic SWIR detectors is proposed in this paper. Methods This paper presents a method for measuring the absolute spectral responsivity accurately and quantitative analysis of the spectral responsivity specification of the mosaic 2 000×256 SWIR detector for imaging spectrometer. The relative response spectrum is measured by a precisely calibrated grating monochromator system. Five optical filters with different center wavelength (CW) and full width at half maximum (FWHM) were chosen to analyze and measure the narrow band responsivity (Tab.1). The center wavelength of the filter is 1225 nm, 1670 nm, 2062 nm, 2420 nm and 2470 nm respectively. The bandwidth is 10 nm and 50 nm, and the cut-off depth is OD3 (optical density). Spectral responsivity is calculated by relative response and narrow-band responsivity. Results and Discussions The cut-off wavelength of detector to be tested is 2.6 μm, and its pitch size is 30 μm×60 μm. The integration time of the read-out integrated circuit (ROIC) is 4.4 ms and integration capacity is 65 fF. F number of the Dewar is 0.9. The results of output signal analysis with filter of different CW at different black body temperature show that narrow-band responsivity is much lower than out-of-band response (Tab.2, Fig.3) with 1# filter and much higher (Tab.2, Fig.4) with 5# filter. The possibility of narrow-band signal's accurate measurement at 1200 nm is discussed if the bandwidth is widened to 200 nm and the cut-off depth is adapted to OD4 and OD5 (Tab.3). It shows that narrow band responsivity can be measured precisely only when cut-off depth is smaller than OD5 and FWHM is wider than 200 nm. Based on the result of the analysis, for HgCdTe SWIR detector the measurement error is smallest when the filter's center wavelength is 2470 nm, FWHM is 50 nm, and cut-off depth is OD3 at 80 ℃ black body temperature. The absolute spectral responsivity of four HgCdTe detectors is measured by the relative response curve and narrow-band responsivity (Fig.7). According to the spectral responsivity curve, the responsivity non-uniformity of four detectors can be calculated to be 6.23%, 6.06%, 4.07% at 1 μm, 1.9 μm and 2.5 μm respectively (Fig.8). Conclusions In this study, a quantitative method for measuring the spectral responsivity accurately and analyzing the spectral responsivity specification of the mosaic 2000×256 SWIR detector for imaging spectrometer is proposed. The results of this study demonstrated that spectral responsivity of Hg1-xCdxTe SWIR can be measured accurately when the filter's center wavelength is 2470 nm, FWHM is 50 nm, and cut-off depth is OD3 at 80 ℃ black body temperature. Narrow-band spectral response output signal is much larger than signal caused by out-of-band response. The spectral responsivity non-uniformity of the four detectors helps to evaluate the response uniformity of spectral dimension response of 2000×256 SWIR detector quantitatively. The results have demonstrated that the use of this measuring method promotes appropriate application of IRFPA detectors in hyperspectral imaging. -
Key words:
- hyperspectral imaging /
- spectral responsivity /
- quantitative analysis /
- SWIR detector /
- Hg1-xCdxTe
-
图 2 典型的碲镉汞短波红外探测器的相对光谱响应曲线
Figure 2. Typical relative spectral response curve of the Hg1-xCdxTe SWIR detector
图 3 黑体辐射透过1#滤光片到样品表面的光子通量密度分布
Figure 3. Distribution of blackbody radiation photon flux density on 1# filter
图 4 黑体辐射透过5#滤光片到样品表面的光子通量密度分布
Figure 4. Distribution of blackbody radiation photon flux density on 5# filter
表 1 滤光片的性能参数
Table 1. Specification of the filter
Filter Center
wavelength/nmFWHM/
nmPeak
transmittanceBlocking
wavelength/nmOD 1# 1225 10 50% 190-3200 OD3 2# 1670 10 60% 200-3500 OD3 3# 2062 10 60% 190-3500 OD3 4# 2420 10 60% 190-3500 OD3 5# 2470 50 70% 100-30000 OD3  下载: 导出CSV
表 2 不同滤光片下的输出信号比较
Table 2. Comparison of output signal with different filters
Filter Blackbody temperature/℃ OD Wavelength range of integration/μm Photon number Output voltage/V 1# 140 - 1.22-1.23 35 6.02×10⁻⁵ OD3 1-2.60 2664 4.59×10⁻³ 2# 140 - 1.665-1.675 328997 5.67×10⁻¹ OD3 1-2.60 331610 5.71×10⁻¹ 3# 140 - 2.057-2.067 549490 9.47×10⁻¹ OD3 1-2.60 552103 9.51×10⁻¹ 4# 80 - 2.415-2.425 311731 5.37×10⁻¹ OD3 1-2.60 311890 5.37×10⁻¹ 5# 80 - 2.445-2.495 2233836 3.85 OD3 1-2.60 2234074 3.85
下载: 导出CSV
表 3 不同带外截止深度和不同半带宽的滤光片输出信号比较
Table 3. Comparison of filter output signal with diffe-rent out-of-band ODs and FWHM
Center
wavelength/nmFWHM/
nmOD Wavelength
range of
integration/μmPhoton
numberOutput
voltage/V1225 10 - 1.22-1.23 35 6.02×10⁻⁵ OD3 1-2.60 2664 4.59×10⁻³ OD6 1-2.60 38 6.50×10⁻⁵ 1225 50 - 1.20-1.25 181 3.11×10⁻⁴ OD3 1-2.60 2804 4.83×10⁻³ OD5 1-2.60 211 3.63×10⁻⁴ 1250 100 - 1.20-1.3 646 1.11×10⁻³ OD3 1-2.60 3271 5.64×10⁻³ OD5 1-2.60 672 1.16×10⁻³ 1300 200 - 1.20-1.4 4253 7.33×10⁻³ OD3 1-2.60 6875 1.18×10⁻² OD4 1-2.60 4514 7.78×10⁻³ OD5 1-2.60 4277 7.37×10⁻³
下载: 导出CSV
-
[1] 李春来, 刘成玉, 金健, 等. 红外高光谱遥感成像的技术发展与气体探测应用[J], 红外与激光工程, 2022, 51(7): 33-45. doi: 10.3788/IRLA20210866 Li Chunlai, Liu Chengyu, Jin Jian, et al. Development of infrared hyperspectral remote sensing imaging and application of gas detection [J]. Infrared and Laser Engineering, 2022, 51(7): 20210866. (in Chinese) doi: 10.3788/IRLA20210866 [2] 崔廷伟, 马毅, 张杰, 航空高光谱遥感的发展与应用[J], 遥感技术与应用, 2003, 18(2): 118-122. Cui Tingwei, Ma Yi, Zhang Jie. The development and applications of the airborne hyperspectral remote sensing [J]. Remote Sensing Technology and Application, 2003, 18(2): 118-122. (in Chinese) [3] 王建宇, 李春来. 高光谱遥感成像技术的发展与展望[J], 空间科学学报, 2021, 41(1): 22-33. Wang Jianyu, Li Chunlai. Development and prospect of hyperspectral imager and its application [J]. Chinese Journal of Space Science, 2021, 41(1): 22-33. (in Chinese) [4] 王君光, 关松. 高光谱成像卫星发展研究[J], 光电技术应用, 2020, 35(3): 1-7. doi: 10.3969/j.issn.1673-1255.2020.03.001 Wang Junguang, Guan Song. Research on development of hyper-spectral imaging satellite [J]. Electro-Optic Technology Application, 2020, 35(3): 1-7. (in Chinese) doi: 10.3969/j.issn.1673-1255.2020.03.001 [5] 刘银年. 高光谱成像遥感载荷技术的现状与发展[J], 遥感学报, 2021, 25(1): 439-459. Liu Yinnian. Development of hyperspectral imaging remote sensing technology [J]. National Remote Sensing Bulletin, 2021, 25(1): 439-459. (in Chinese) [6] 付严宇, 杨桄, 关世豪. 航空航天高光谱成像仪研究现状及发展趋势[J], 红外, 2020, 41(8): 1-8. Fu Yanyu, Yang Guang, Guan Shihao. Research status and development trend of hyperspectral imagers onboard airborne and spaceborne platforms [J]. Infrared, 2020, 41(8): 1-8. (in Chinese) [7] 刘银年, “高分五号”卫星可见短波红外高光谱相机的研制[J], 航天返回与遥感, 2018, 39(3): 25-28. Liu Yinnian. Visible-shortwave infrared hyperspectral imager of GF-5 satellite [J]. Spacecraft Recovery & Remote Sensing, 2018, 39(3): 25-28. (in Chinese) [8] 董新丰, 甘甫平, 李娜, 等. 高分五号高光谱影像矿物精细识别[J], 遥感学报, 2020, 24(4): 454-464. Dong Xinfeng, Gan Fuping, Li Na, et al. Fine mineral identification of GF-5 hyperspectral image [J]. Journal of Remote Sensing, 2020, 24(4): 454-464. (in Chinese) [9] 马旭, 李云雪, 黄润宇, 等. 短波红外探测器的发展与应用[J], 红外与激光工程, 2022, 51(01): 135-146. doi: 10.3788/IRLA20210897 Ma Xu, Li Yunxue, Huang Runyu, et al. Development and application of short wavelength infrared detectors [J]. Infrared and Laser Engineering, 2022, 51(1): 20210897. (in Chinese) doi: 10.3788/IRLA20210897 [10] Leroy C, Fieque B, Jamin N, et al. SWIR space detectors and future developments at SOFRFADIR[C]//SPIE, 2013, 8889: 88891A. [11] Bouakka-Manesse A, Jamin N, Delannoy A, et al. Space activity and programs at Sofradir[C]//SPIE, 2016, 10000: 100000N. [12] 蔡毅, 碲镉汞探测器的回顾与展望[J], 红外与激光工程, 2022, 51(1): 20210988. doi: 10.3788/IRLA20210988 Cai Yi. Review and prospect of HgCdTe detectors [J]. Infrared and Laser Engineering, 2022, 51(1): 20210988. (in Chinese) doi: 10.3788/IRLA20210988 [13] 丁瑞军, 杨建荣, 何力, 等. 碲镉汞红外焦平面器件技术进展[J], 红外与激光工程, 2020, 49(1): 93-99. doi: 10.3788/IRLA202049.0103010 Ding Ruijun, Yang Jianrong, He Li, et al. Development of technologies for HgCdTe IRFPA [J]. Infrared and Laser Engineering, 2020, 49(1): 0103010. (in Chinese) doi: 10.3788/IRLA202049.0103010 [14] Hu Xiaoning, Huang Aibo, Liao Qingjun, et al. Large-format high SNR SWIR HgCdTe/Si FPA with multiple-choice gain for hyperspectral detection [C]//SPIE, 2017, 10213: 102130E. [15] 王亮, 杨微. 碲镉汞红外探测器量子效率计算研究, 激光与红外, 2019, 49(7): 871-875. Wang Liang, Yang Wei. Study on the quantum efficiency calculation of HgCdTe infrared detector [J]. Laser & Infrared, 2019, 49(7): 871-875. (in Chinese) [16] 汤定元, 糜正瑜. 光电器件概论[M]. 上海: 上海科学技术文献出版社, 1989. [17] 张小倩, 周翠. 红外探测器相对光谱响应测试[J], 红外, 2020, 41(6): 1-6. Zhang Xiaoqian, Zhou Cui. Measurement of relative spectral of infrared detector [J]. Infrared, 2020, 41(6): 1-6. (in Chinese) [18] 张永刚, 周立, 顾溢, 等. FTIR测量的量子型光电探测器响应光谱校正[J], 红外与毫米波学报, 2015, 34(6): 737-743. Zhang Yonggang, Zhou Li, Gu Yi, et al. Correction of response spectra of quantum type photodetectors measured by FTIR [J]. Journal of Infrared and Millimeter Waves, 2015, 34(6): 737-743. (in Chinese) [19] 陈郁, 贺香荣, 邵秀梅, 等. 基于Labview的短波红外焦平面相对响应光谱测试系统[J], 光学与光电技术, 2013, 11(6): 25-28. doi: 10.3969/j.issn.1672-3392.2013.06.006 Chen Yu, He Xiangrong, Shao Xiumei, et al. Measurement system of relative spectral response for SWIR FPA based on LabVIEW [J]. Optics & Optoelectronic Technology, 2013, 11(6): 25-28. (in Chinese) doi: 10.3969/j.issn.1672-3392.2013.06.006 [20] 中华人民共和国工业和信息化部. GB/T 17444—2013, 红外焦平面阵列参数测试方法[S]. 北京: 中国标准出版社, 2013. -

 点击查看大图

计量
- 文章访问数: 132
- HTML全文浏览量: 22
- PDF下载量: 60
- 被引次数: 0

