


 下载:
下载:


-
铝合金构件因具有强度高、材料性能稳定、焊接性良好、耐受环境范围宽等特点,而广泛应用于航空航天领域[1-2]。航空航天器在往返空天过程中受到复杂交变应力、冲击载荷等因素的影响,极易造成铝合金构件产生疲劳裂纹,这对航空航天器的安全性能造成极大的威胁。因此,快速、实时、高效、精准地检出微小裂纹缺陷显得极为重要[3]。相对于常规无损检测技术,激光红外检测具有非接触、效率高、检测速度快、便于集成等优点,在材料微小裂纹的检测领域具有广阔的应用前景[4-5]。激光红外热成像技术一般分为飞点热成像、激光脉冲热成像、激光线扫描成像、激光阵列热成像。激光飞点热成像适合材料表面裂纹、近表面分层缺陷检测,检测效率、信噪比较高,但激光扫描参数受材料表面状态影响大;激光脉冲热成像适合低扩散率表面裂纹检测,能够获得高信噪比热图,但受材料表面损伤阈值限制[6],检测效率低;激光线扫描适合近表面缺陷、表面裂纹检测,检测效率高,但信噪比低且受材料表面状态影响大;激光阵列热成像适合大面积材料表面裂纹、近表面缺陷检测,检测效率高,但需较为复杂的重建算法重构热图[7]。其中飞点热成像和激光线扫描热成像对裂纹定位具有巨大优势[8-9],而定量检测裂纹宽度深度,激光长脉冲热成像更具优势。
裂纹宽度是裂纹危险程度的重要维度尺寸,通过激光红外无损检测技术可以定量表征裂纹宽度,从而及时发现由于裂纹宽度扩展所带来的危害[10]。但随着裂纹宽度的增大,激光激发的热源在裂纹附近迅速衰减,严重影响检测精度[11]。基于温度幅值构造指标是激光红外检测量化裂纹尺寸的重要方法[12],但由于温度场的扩散性,即使微小的观测波动也会导致裂纹检测结果出现较大的偏差,进而导致解析式拟合裂纹宽度时出现明显的病态性[10]。从热阻的自由量入手可以克服这一问题,根据裂纹附近温度分布对含热阻的自由量进行非线性拟合,可以得到裂纹宽度的估计值[13]。但是当裂纹宽度小于或接近空气分子的平均自由程时,热阻公式将不再有效[14],而通过拉普拉斯变换、伽利略变换等方法,建立激光锁相热成像、飞点热成像、激光脉冲热成像之间的内在联系则能够实现裂纹宽度的测量且具有高的微米级裂纹的检测精度[15-17]。Yang[16]等采用一种无参考缺陷的可视化算法,在特定时间点获取原始热图像,应用边缘检测算法提取缺陷边界处形成的热不连续性,成功检测出半导体芯片和陶瓷环氧复合材料4~40 μm宽的微裂纹。而对于铝合金材料,由于其热扩散率快、发射率低、所需激励能量大,目前大多数研究主要是针对其微小裂纹的定性检测[18],而较少对其微小裂纹宽度的定量研究。
基于上述问题,文中结合激光红外热成像检测的特点,在铝合金表面裂纹处热传导规律分析的基础上,进行了不同宽度裂纹的激光长脉冲热成像试验,构建了基于空域特征参量组合的裂纹宽度综合指标,实现了50~700 μm宽度表面裂纹的定量表征,这能够为实现激光红外热成像技术在航空航天裂纹量化检测的应用奠定坚实基础。
-
为了研究激光线长脉冲激励下裂纹处的传热规律,简化处理带有表面裂纹的试件,试件关于裂纹中心对称分布,铝合金为半无限各向同性传热介质且完全绝热;裂纹为具有一定宽度的半无限垂直薄片,裂纹内部充满空气,其热导率为空气热导率。
理想状态下,激光线能量均匀分布,激光线光斑激励时,界面热量沿激光光斑方向的传导方式如图1所示。试件表面受激励部位吸收激光能量成为热源,热源位置与周围区域存在温度差,促使热量向周围传播。在远离裂纹位置处(A、B两点),热流可在铝合金内部任意方向传播(如图中黑色细线所示),进而沿着激光光斑方向叠加,形成垂直于试样表面的热流。在裂纹边缘位置处(C点),由于空气的热导率远小于铝合金热导率,绝大部分热量被裂纹阻滞,进而导致裂纹边缘位置处温度升高;只有极少量的热量通过铝合金表面进入裂纹,在裂纹内部的空气中传递。由于裂纹中的空气不能直接从激光中吸收能量,因此,热量传递是影响裂纹温度的唯一因素。此时,试件表面的温度场处于准稳态分布状态。

图 1 激光线长脉冲激励下裂纹附近热传导示意图
Figure 1. Schematic diagram of heat transfer near cracks under laser line of long pulse
对于裂纹内空气隙中的热量分布,忽略空气对流,空气薄层中温度传导的热流密度可视为常数[15],根据傅里叶热传导定律,宽度为D的裂纹中热量传递规律如图2所示。

图 2 热量在裂纹空气隙中的传递示意图
Figure 2. Schematic diagram of heat conduction in cracked air gaps
将裂纹宽度n等分,根据傅里叶定律以及热阻的定义,第i个区域的温度变化$ \Delta {T_i} $为:
$$ \Delta {{{T}}_{{i}}} = \frac{{{q_i} \cdot d}}{{{k_{air}}}} $$ (1) 式中:$ {q_i} $为第i个区域的热量;$ {k_{air}} $为空气热导率;$ d = L/n $。
当i=1时:
$$ \Delta {{{T}}_1} = \frac{{{q_1} \cdot d}}{{{k_{air}}}} $$ (2) 式中:$ {q_1} $仅由铝合金结构的温度分布决定。
当i>1时,热量的扩散随传导距离呈指数衰减,即:
$$ {q_i} = {q_1}\exp [ - \lambda (i - 1)d] $$ (3) 式中:λ为衰减指数。
则裂纹内部距离左侧边界$ s \cdot d $处与左侧边界的温度差$ \Delta {T_s} $为:
$$ \Delta {{{T}}_s} = \sum\limits_{i = 1}^s {\Delta T{d_i}} $$ (4) 式中:$ \Delta T{d_i} $为第i薄层两侧的温度差。
由于裂纹左右边界对称,对于第i薄层,其与左边界距离为$ s \cdot d $,与右边界距离为$ (n - s) \cdot d $。左右两侧传导的热量部分抵消,于是:
$$ {q_s} = {q_1}(\exp ( - \lambda (s - 1)d) - \exp ( - \lambda (n - s)d) $$ (5) 由于裂纹宽度较小,有:
$$ \exp (x) \approx 1 + x $$ (6) 于是:
$$ {q_s} = {q_1}(2n - 2s + 1)\lambda d $$ (7) 代入公式(4)中可得:
$$ \Delta {T_s} = \sum\limits_{i = 1}^s {\Delta T{d_s} = - \frac{{{q_1}{k_{air}}}}{d} \cdot \lambda (ns - {s^2}} ) $$ (8) 此即为与左边界距离为$ s \cdot d $位置处的温升幅值公式,令$ x = s \cdot d $,则:
$$ \Delta {T_s} = \frac{{\lambda \cdot {q_1} \cdot {k_{air}}}}{{{d^3}}} \cdot ({x^2} - L \cdot x) $$ (9) 从公式(9)可以看出,温升$ \Delta {T_s} $是关于${{x}} = \dfrac{L}{2}$中心对称的抛物线,即在裂纹中心位置处温升幅值最低,为:
$$ {(\Delta T)_{\min }} = - \frac{{\lambda \cdot {q_1} \cdot {k_{air}}}}{{4{d^3}}} \cdot {L^2} $$ (10) 公式(10)表明,随着裂纹宽度的增加,裂纹中心位置处的温升幅值降低,即裂纹中心位置的温度值更低。
综合公式(9)、(10)可以看出,激光线长脉冲激励时,裂纹表面温度呈现准稳态分布,裂纹内部中心位置的温升幅值最小,且随着裂纹宽度的增加,裂纹中心位置的温升幅值减小,这说明沿激光线方向的温度分布能够用于裂纹宽度的定量检测。
-
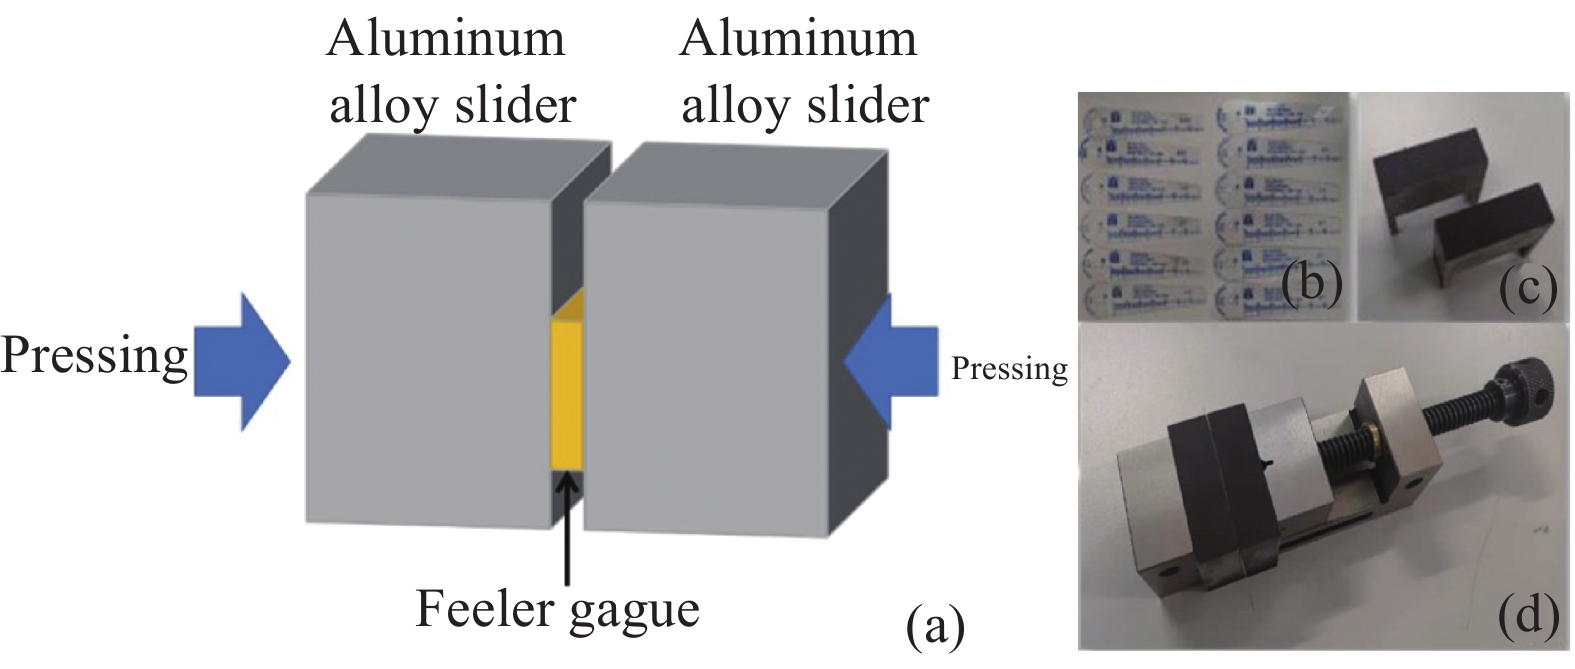
试样设计思路及实物如图3所示,将已知厚度的塞尺水平放置于两个完全相同的光滑铝合金块之间,铝合金滑块置于精密滑道上并施加压力使两滑块与塞尺紧密贴合,塞尺厚度即为模拟裂纹的宽度。试验前,在铝合金表面喷涂黑色哑光漆以提高其表面热量的吸收率。

图 3 裂纹宽度模拟试件设计。(a) 构造示意图;(b) 塞尺;(c) 铝合金滑块;(d) 组合试件
Figure 3. Analog specimen design of crack width. (a) Schematic diagram of the structure; (b) Plug gauges; (c) Aluminum alloy slider; (d) Com-bined specimen
-
搭建的激光长脉冲热成像试验平台及仪器如图4所示,主要包括波形发生器、激光器、线性发生器、红外热像仪、电控平台等。激光功率和激光波形由波形发生器控制,试验采用的激光最大功率为100 W,波长为808 nm,激光光斑直径为2 mm。温度采集使用NEC-R300S型红外热像仪,其空间分辨率为320 pixel×240 pixel,灵敏度为0.2 ℃,采样频率为60 Hz,工作温度范围为−40~500 ℃。
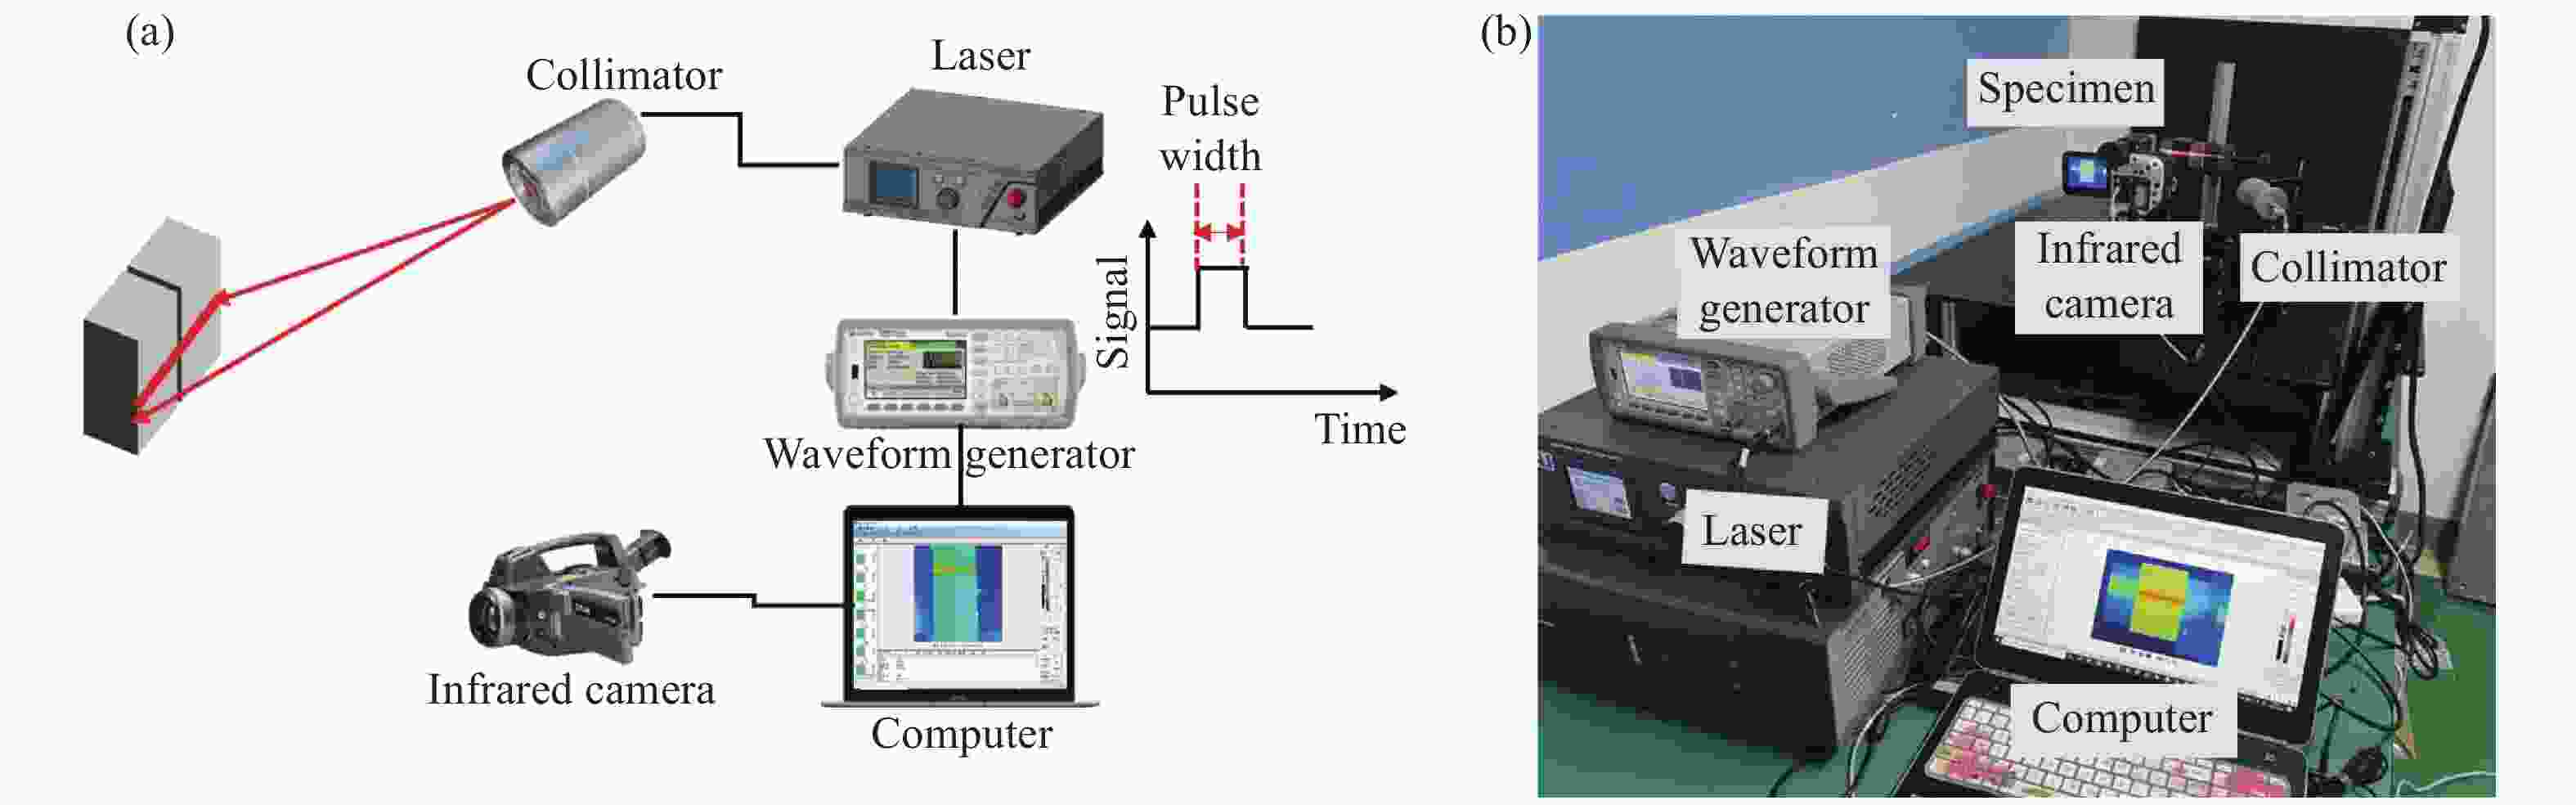
图 4 激光长脉冲热成像试验平台。 (a) 示意图;(b) 试验装置
Figure 4. Test platform for laser long pulse thermography. (a) Schematic diagram; (b) Test setup
-
将热像仪与裂纹模拟试件平行放置于试验平台上。试验时,利用波形发生器触发脉冲波形信号激活激光,调节脉冲宽度控制激励时间,使激励持续时间为0.5~5 s。激光器以连续恒定功率线性形式输出,联通线性发生器激励试件,试件表面被直接照射的部位吸收能量形成热源。利用热像仪同步采集不同宽度模拟裂纹试件在激光长脉冲激励下的热像图,热像图传输到计算机,并采用专用软件进行处理与分析。
-
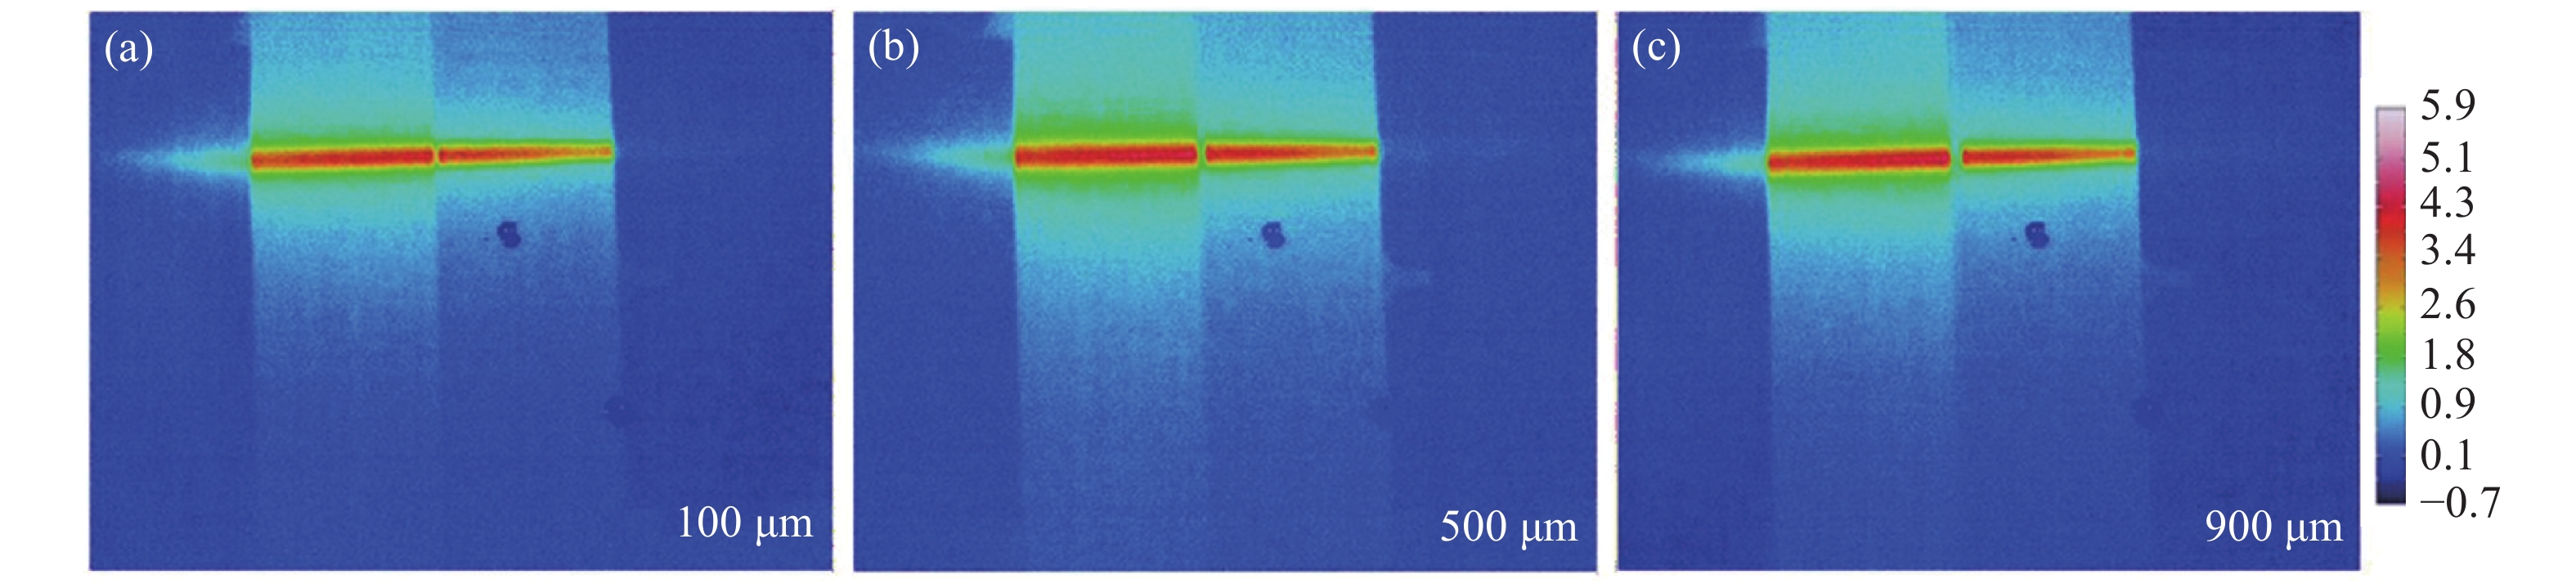
试验采用塞尺厚度分别为50、75、100、200、300、···、900、1000 μm,共12个宽度。为了便于分析与讨论,此节仅展示宽度为100、500、900 μm时裂纹附近的温升分布情况。图5所示为不同宽度模拟裂纹表面的热图。从图中可以看出,100 μm宽度裂纹表面热斑的中断距离最小,500 μm的次之,900 μm的最大。这说明通过不同宽度裂纹试样表面的温度分布,可以区分裂纹大小。

图 5 激光激励下模拟裂纹宽度热图
Figure 5. Thermal map of analog crack width under laser excitation
各裂纹模拟试件热斑附近温升分布如图6所示,可以看出,非裂纹区域受激光直接激励,温度上升明显,温升达到3 K,且形成较大的温升梯度分布;裂纹处温升幅度显著低于非裂纹区域,形成了明显的“山谷”波形。
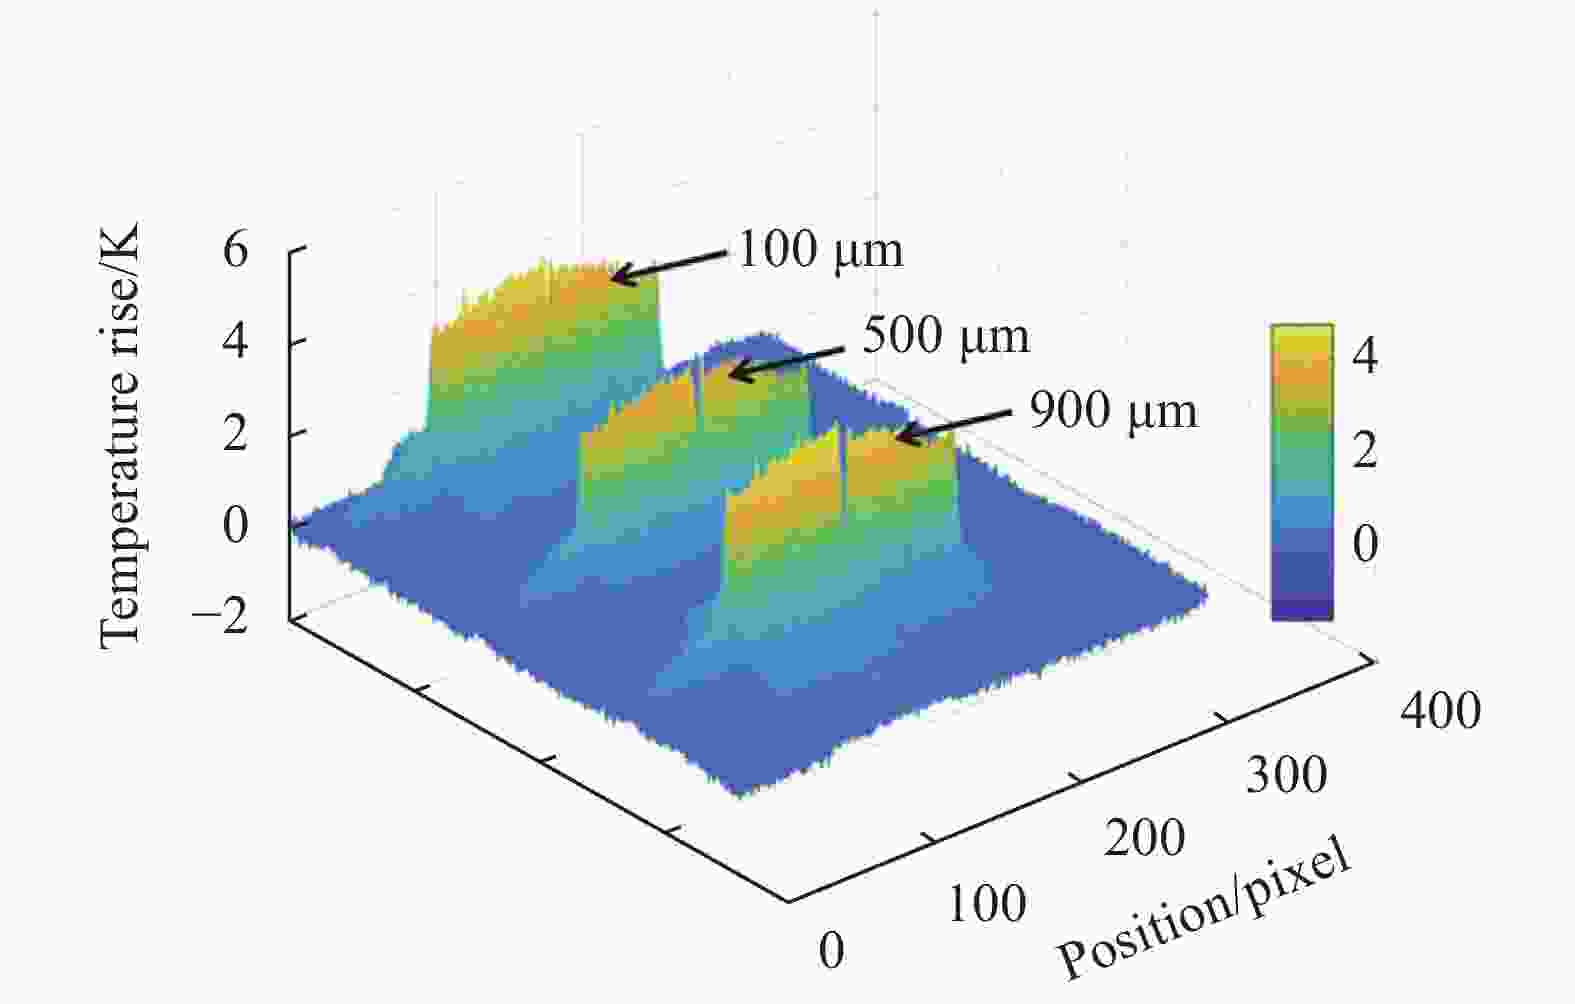
图 6 不同裂纹宽度下激光热斑附近的温升分布
Figure 6. Temperature rise distribution near the laser hot spot with different crack widths
由于激光高度聚焦,且铝合金滑块表面热扩散系数高,热量进入滑块后能够迅速充分扩散,因此,激光线光斑长脉冲激励下温度幅度能够迅速达到准稳态状态。此时,温度场各点温度几乎不随时间变化。而在裂纹位置处,空气隙不能吸收激光能量,其热量只能通过裂纹内的空气以对流方式传导,因此温度上升缓慢。所以,温度沿着线光斑方向形成稳定的温度梯度分布后,裂纹处温升出现明显的凹陷。
在宽度为100 μm裂纹的热图中分别在裂纹位置选取一点P1、在非裂纹位置选取一点P2,两点位置处温升随时间变化如图7(a)所示,以激光开始激励时间为时间零点。从图中可以看出,P1与P2两点的温升变化具有相同的趋势。在激励前,两点位置处仅有背景温升,且温升幅度基本为0;激励开始后,P1、P2位置处的温升幅值快速增加,激励1 s后,温升幅值缓慢增大,而后趋于稳定。P2、P1两点位置处温升比h2/h1如图7(b)所示,从图中可以看出,激励开始时,由于两点位置处温度幅值急剧增大,温升比波动较大;约0.4 s后,该比值较为稳定且逐渐减小;在3 s后,该值便趋于稳定且在小范围内波动,说明此时试件表面温度处于准稳态分布状态。
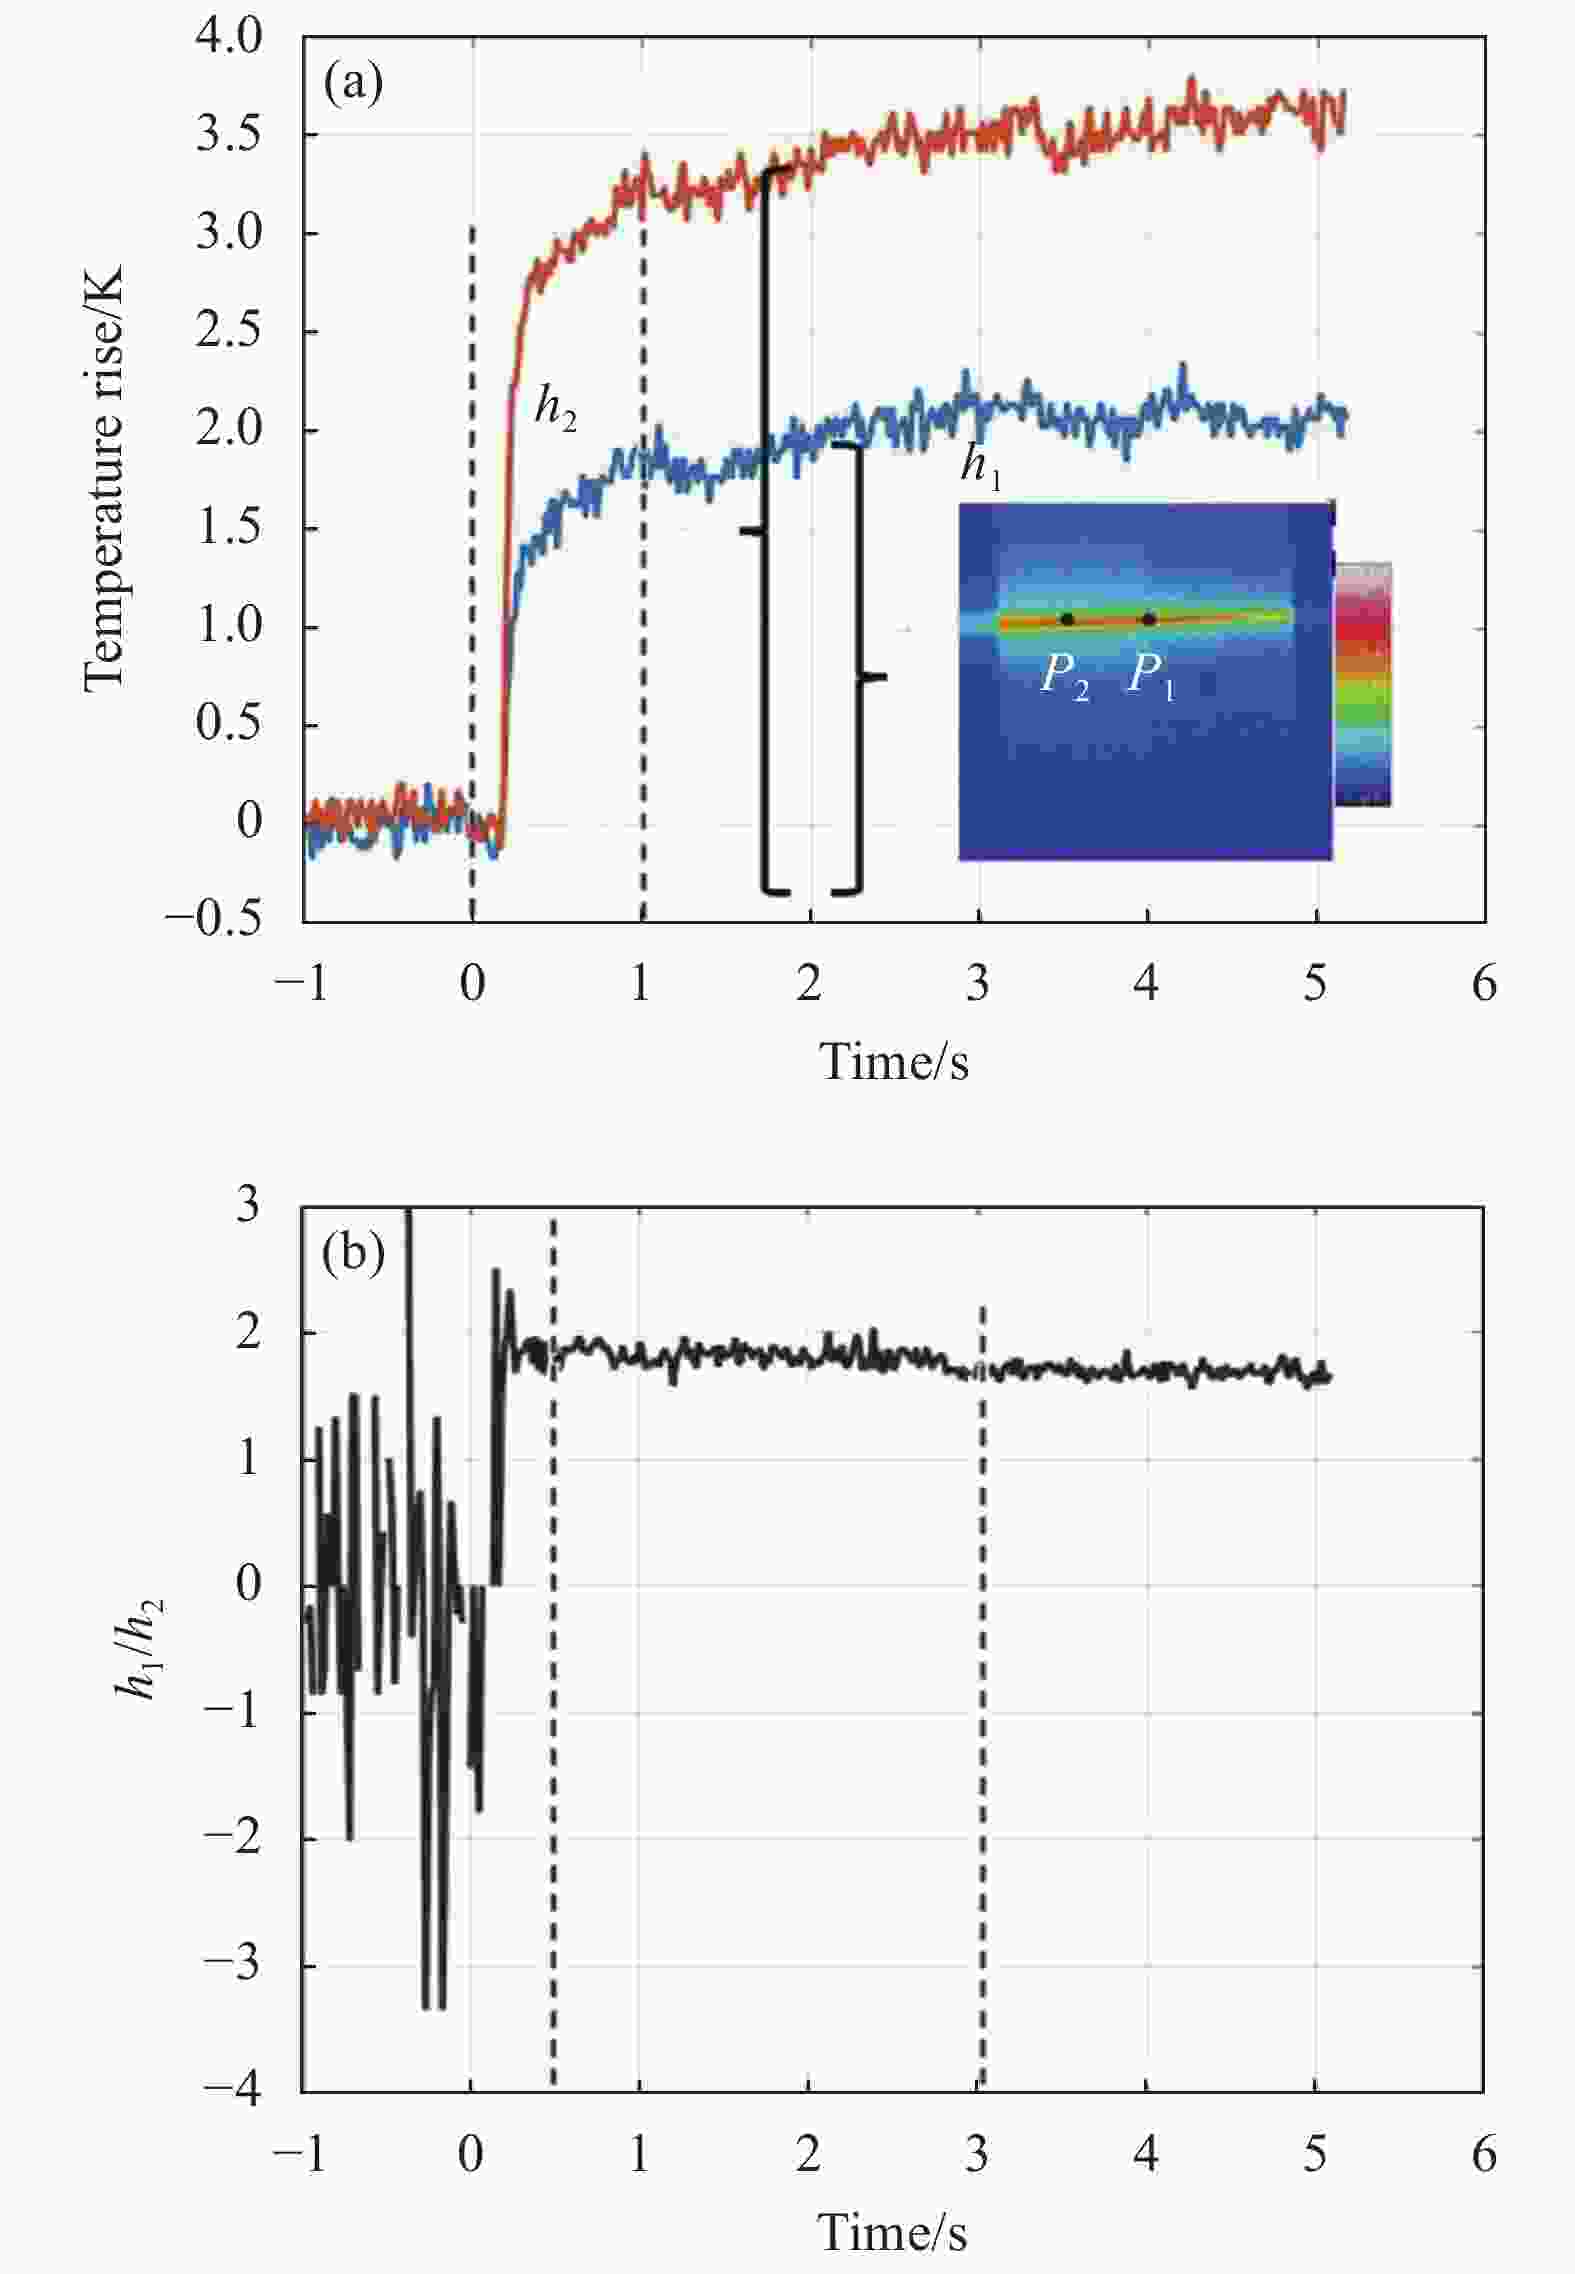
图 7 试件表面温升变化。(a)温升随时间变化;(b)温升幅度比随时间变化
Figure 7. Variation in temperature rise of specimen surface. (a) Temperature rise over time; (b) Temperature rise amplitude ratio over time
以上试验结果表明,在激光激励下,试件表面的温度能够快速达到准稳态状态,此时,裂纹位置处的温升明显低于非裂纹处,且根据公式(10)可知,随着裂纹宽度的增加,裂纹中心位置的温升幅值减小。此外,在长脉冲激光激励过程中,各试样表面温升均经历快速上升和接近准稳态两个阶段,通过温升曲线的2-范数可以实现局部热导率变异情况的表征,而文中条件下,热导率变异情况与试样裂纹宽度显著相关[19]。
-
当试件表面温度处于准稳态分布时,沿图8(a)中黑色横线标记的温升“山脊线”(温升最大值)提取温升值,图8(b)所示是宽度为100 μm裂纹的温升分布。从图中可以看出,在裂纹位置处(图中A-C区域)温升值发生明显的凹陷,而在裂纹两侧(A点左侧及C点右侧),温升值则逐渐减小,呈现一定的低频趋势。

图 8 试样表面温升分布。(a)采样线;(b)采样线上的温升分布
Figure 8. Distribution of specimen surface temperature rise. (a) Sampling line; (b) Distribution of temperature rise along the sampling line
裂纹两侧温升分布呈现低频分布趋势是由于铝合金表面黑色哑光漆为手动喷涂,漆层厚度不均匀造成的。采用DB5小波对温升信号进行6层分解去除低频趋势项[20],以去除表面哑光漆漆层厚度不均的影响。而后将温升曲线中心化处理,结果如图9所示。

图 9 温升分布曲线中心化处理
Figure 9. Centralized processing of the temperature rise distribution curve
利用主成分分析法计算激光线长脉下裂纹表面温升分布的权值向量,以提取温升曲线中表征裂纹宽度的有用信息。前3个主成分分量的绝对值并计算其贡献率,结果如图10所示。

图 10 中心化轮廓分布的前3个主成分分量绝对值
Figure 10. Absolute value of the first 3 principal components of centralized contour distribution
构建位置权值向量$ \nu $:
$$ v = \frac{{\displaystyle\sum\limits_{i = 1}^{12} {{\lambda _i} \cdot {\omega _i}} }}{{\displaystyle\sum\limits_{k = 1}^n {\displaystyle\sum\limits_{i = 1}^{12} {{\lambda _{k,j}} \cdot {\omega _i}} } }} $$ (11) 式中:$\lambda = ({\lambda _{i1}},{\lambda _{i2}}, \cdots ,{\lambda _{in}})$,为主成分分量,$\omega = ({\omega _1}, {\omega _2}, \cdots , {\omega _{12}})$,为载荷向量。
根据公式(10)计算沿光斑位置的归一化温升权值,如图11所示。从图中可以看出,权值向量${\boldsymbol{ \nu}} $的分布类似于狄拉克脉冲函数,在裂纹位置处具有突出的权值极值,说明最小温升幅值(即裂纹位置处的温升幅值)对于裂纹宽度具有较高的方差,而其余位置的方差则较小。这表明,铝合金滑块表面热量分布相差不大,而裂纹宽度不同时裂纹处温升变化具有显著差异。
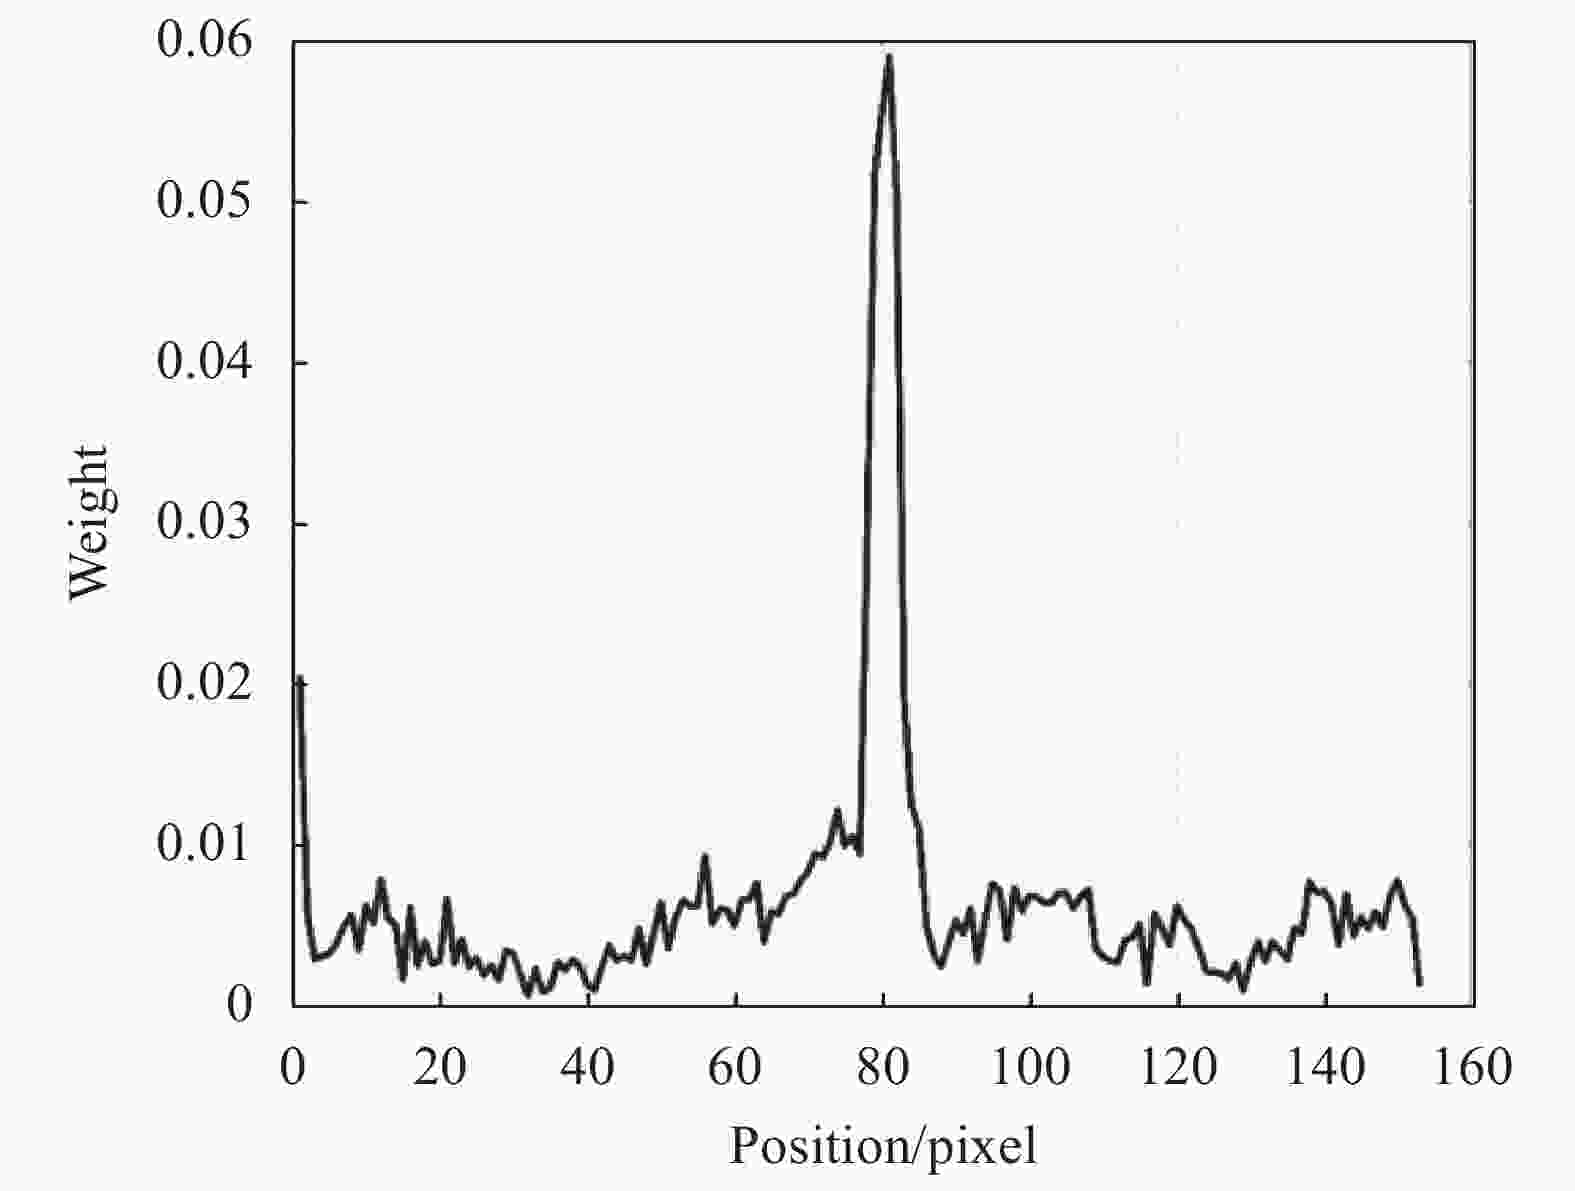
图 11 权值向量$ {\boldsymbol{\nu }}$的位置分布
Figure 11. Location distribution of the weight vector ${\boldsymbol{ \nu}} $
将裂纹处温升振幅与非裂纹区域平均温升的比值构建特征参量$ \gamma $以消除激光功率对裂纹处温升幅度的影响:
$$ \gamma {\text{ = }}\frac{{\left| {\Delta T} \right|}}{{\overline {{T_0}} }} $$ (12) 式中:ΔT表示裂纹中心位置处的温升;$ \overline {{T_0}} $表示试件表面温升的平均值。
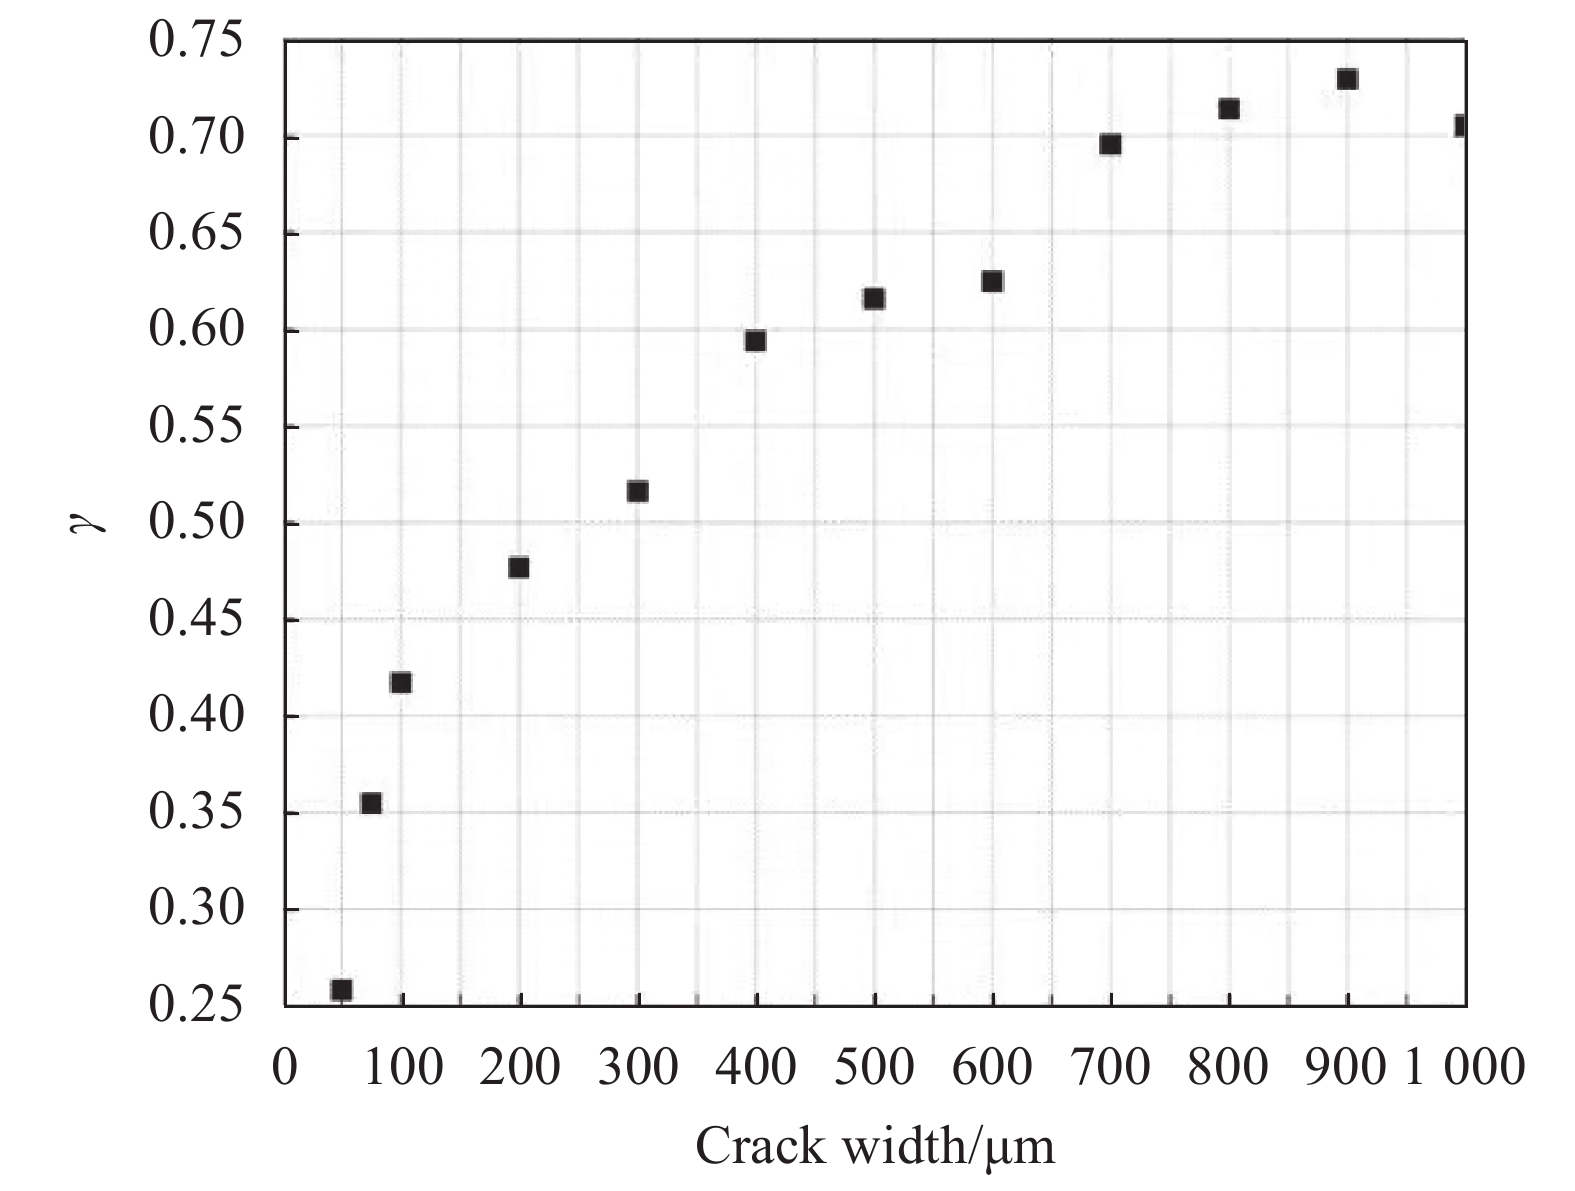
图12为$ \gamma $与裂纹宽度的关系。从图中可以看出,随着裂纹宽度的增加,$ \gamma $整体上保持单调增大,且增大速率随着裂纹宽度的增大而放缓。当裂纹宽度超过600 μm时,$ \gamma $趋于饱和,此时呈现出一定的病态性。其主要原因是随着裂纹宽度的增加,空气隙的热阻效应显著增强,热量由于热扩散而迅速衰减,因而温升幅度的变化速度减缓。

图 12 $\gamma$随裂纹宽度的变化
Figure 12. Variation of $ \gamma $with crack width
-
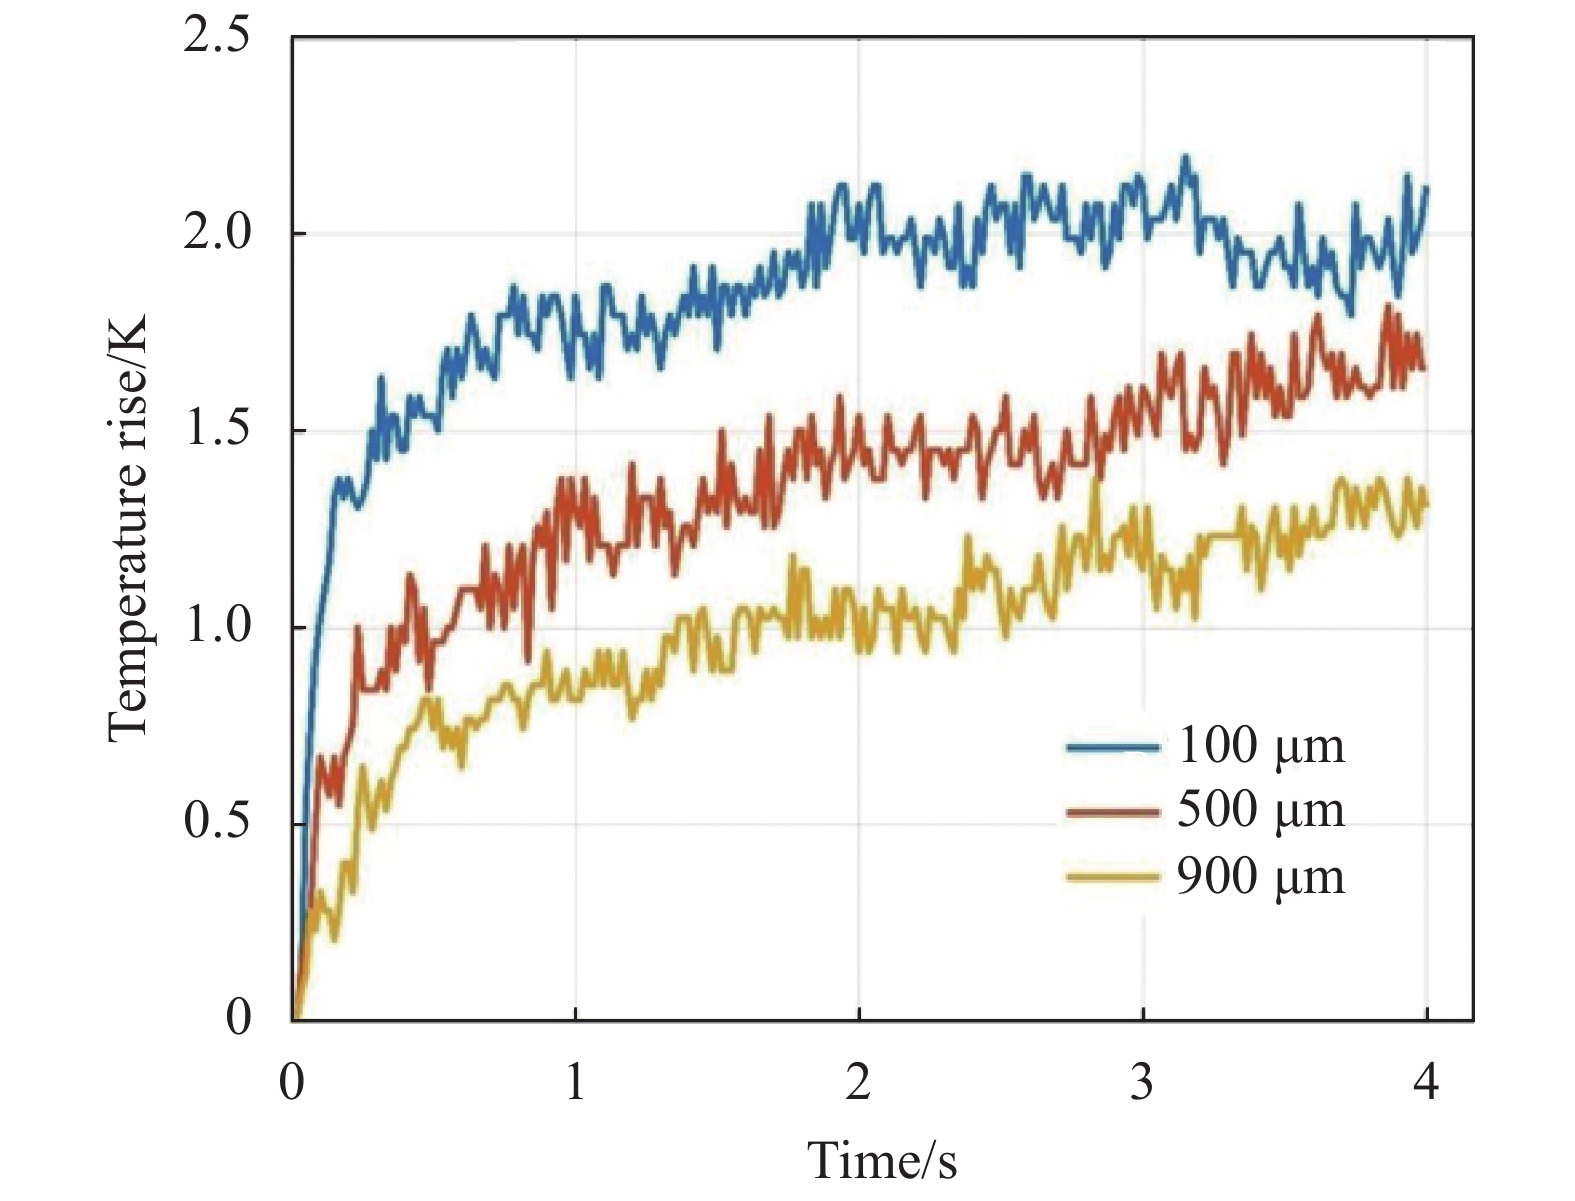
图13所示为长脉冲激光激励4 s内,不同裂纹宽度试样裂纹位置处的温升曲线。从图中可以看出,裂纹宽度为100 μm,试样裂纹处温升幅度最大,为2.2 K;500 μm的次之;900 μm的裂纹处温升幅度最小,为1.4 K。
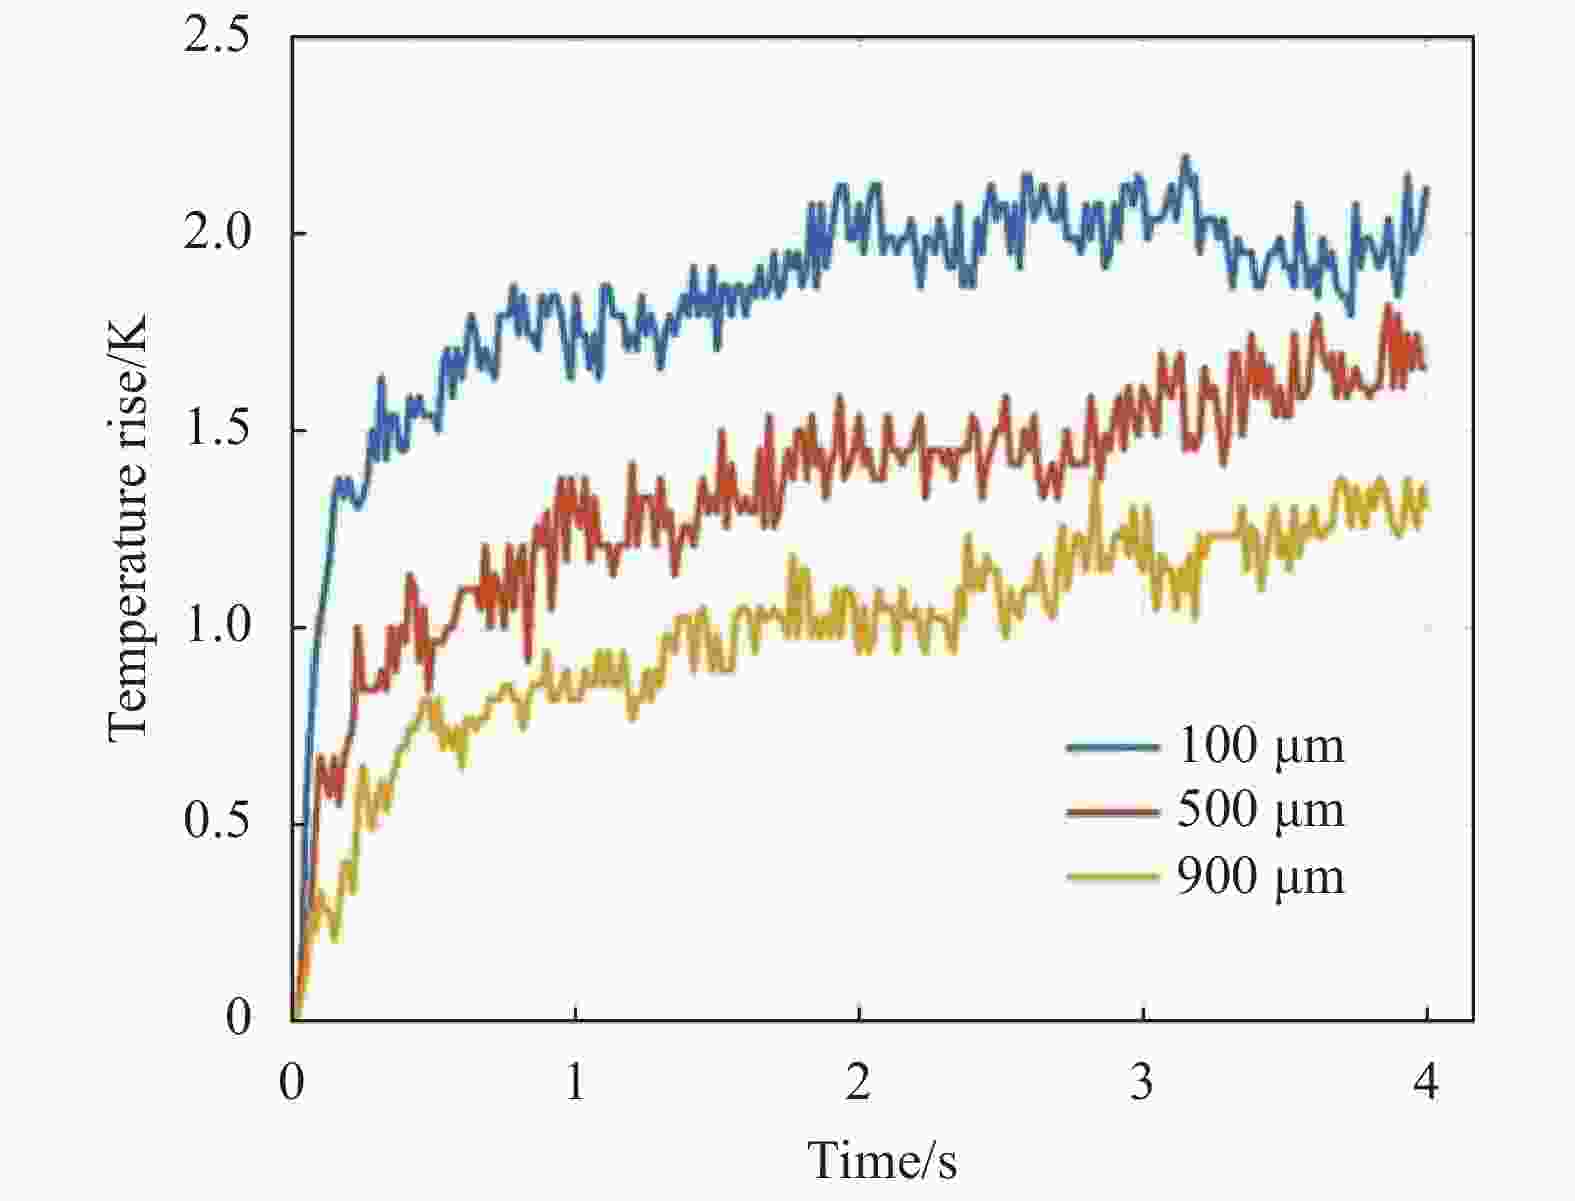
图 13 试样裂纹位置处的温升曲线
Figure 13. Temperature rise curves at the location of the crack in the specimen
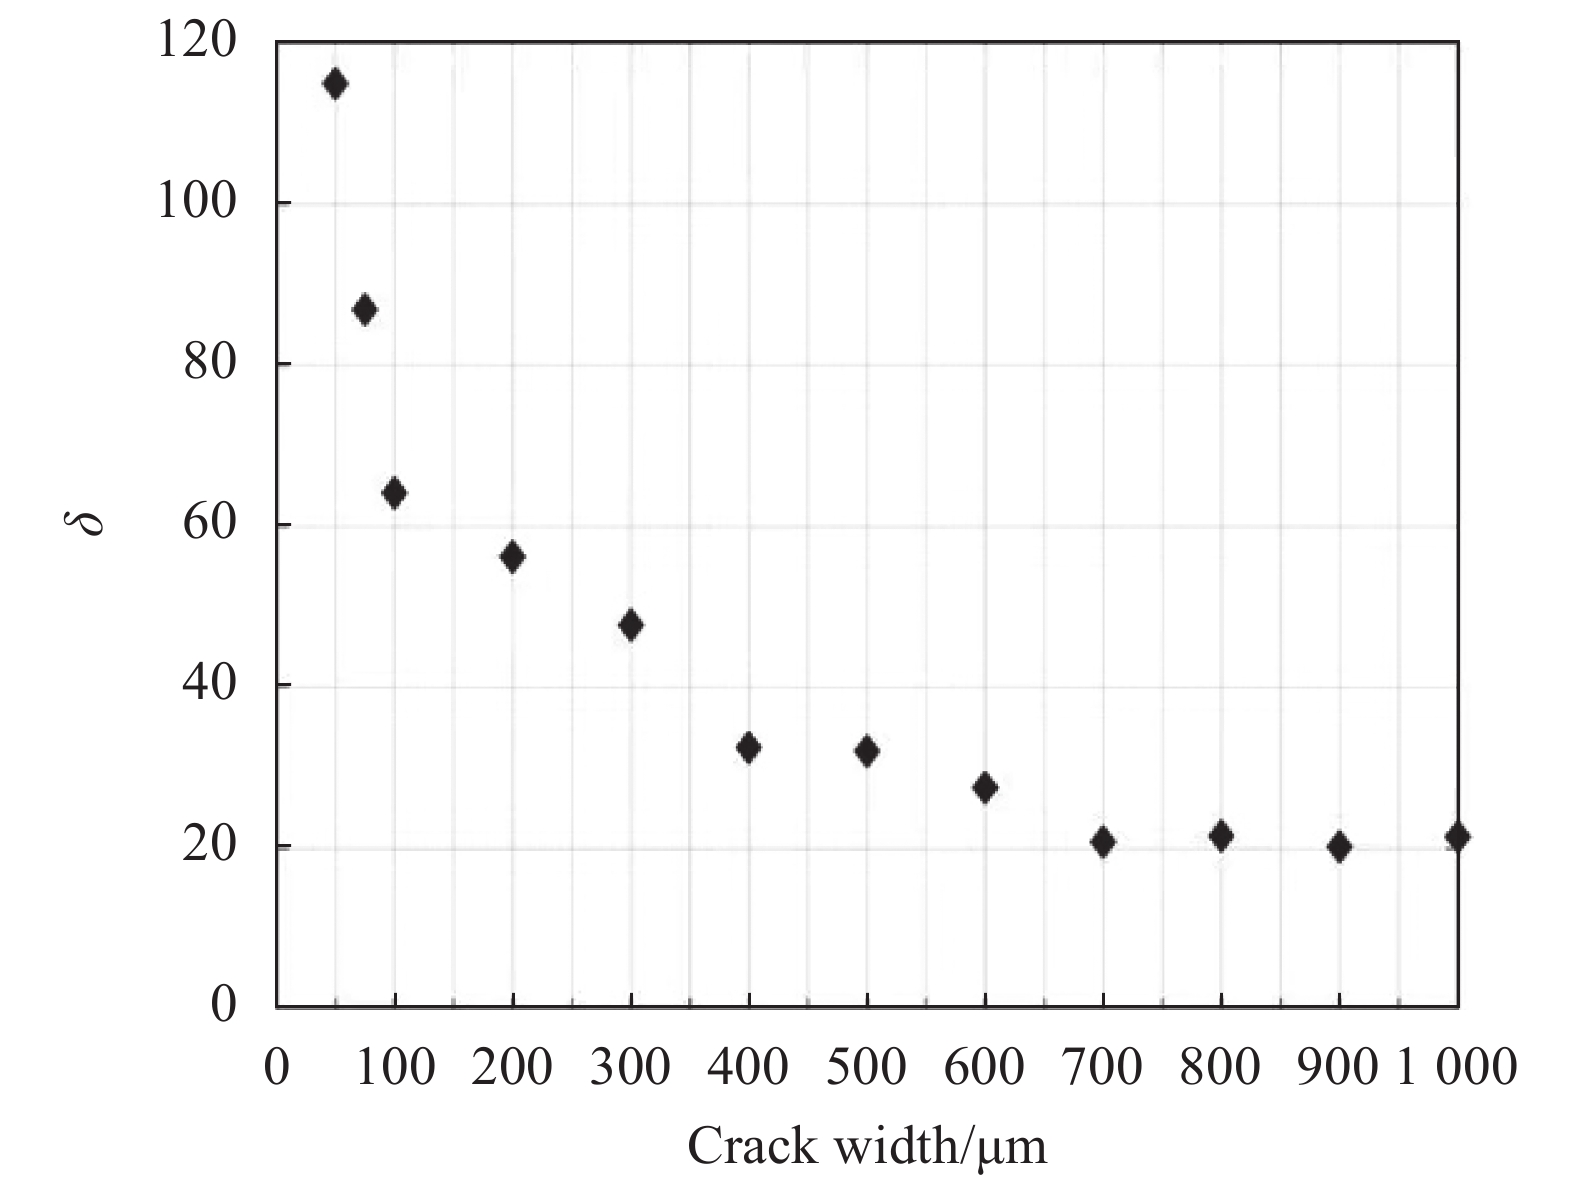
从图中还可以看出,各温升曲线均存在较大的噪声,为此,采用$ \left| {\Delta T} \right| $代替长脉冲激励时间为0~4 s内的最大温度,并计算其归一化欧式范数$ \delta $:
$$ \delta = \left(\frac{1}{{\left| {\Delta T} \right|}}\sum\limits_{i = 1}^{240} {{{({T_{c,i}}(t))}^2}}\right) $$ (13) 式中:Tc,i(t)为试件的第i个裂纹宽度裂纹长脉冲的温度曲线,$ \delta $与裂纹宽度的关系如图14所示。
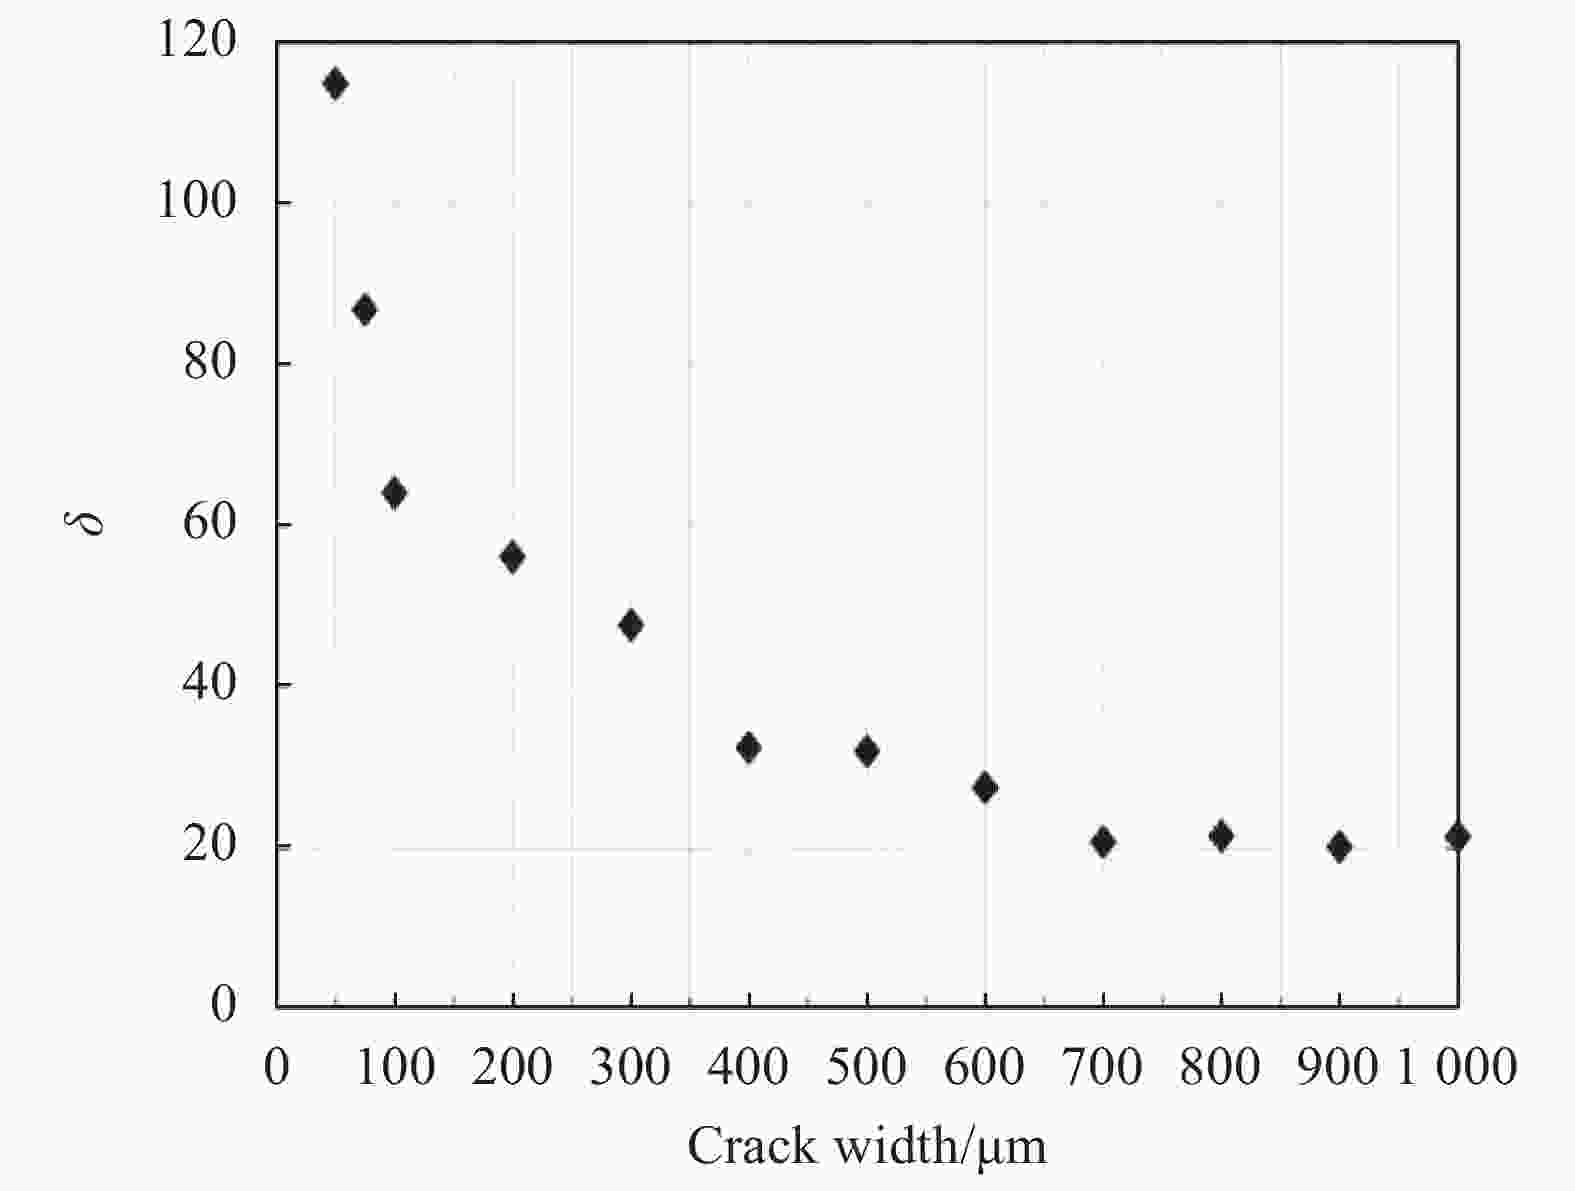
图 14 $ \delta $随裂纹宽度的变化
Figure 14. Variation of $ \delta $ with crack width
从图14可以看出,归一化温升的欧式范数与裂纹宽度呈负相关关系。当裂纹在宽度700 μm以下时,欧式范数的单调性较好;而裂纹宽度大于600 μm时,$ \delta $趋于饱和,与参量$ \gamma $一样,呈现出一定的病态性,而无法表征裂纹宽度。
-
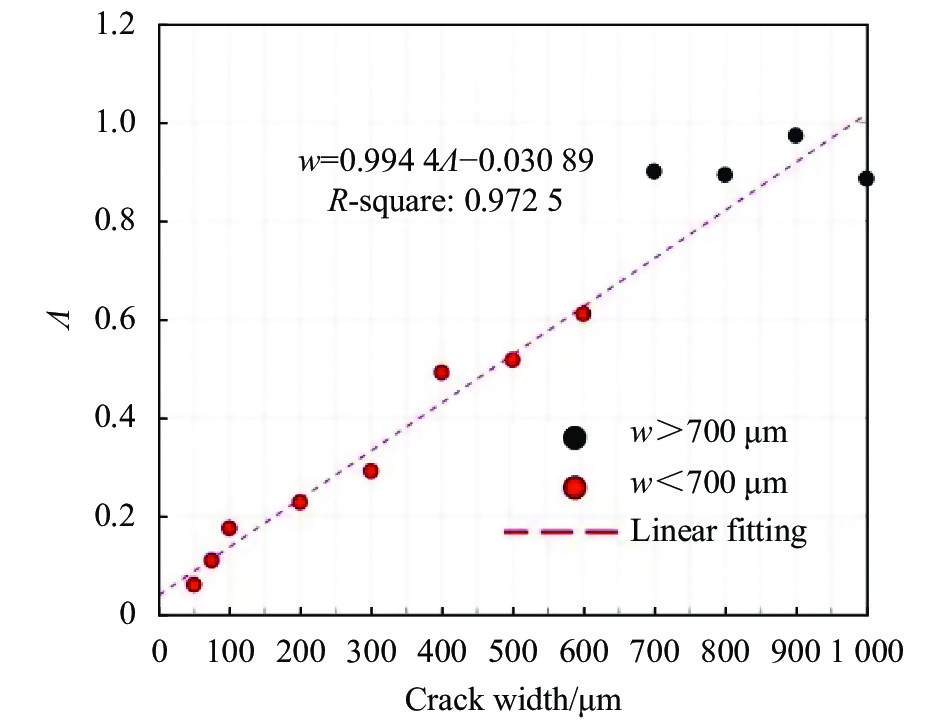
从3.2节可以看出,所构建的基于温升分布特征参量$ \gamma $,以及基于温升变化特征参量$ \delta $,对裂纹的宽度都有较好的表征能力,但两者均对激光功率有一定的依赖性,采用比值定义法可以消除这一依赖性。考虑到$ \gamma $参量的范围分布在[0,1]区间内,而$ \delta $参量为归一化的欧式范数,其数值范围大但衰减更为明显;此外,从上一节分析可以看出,两个参量均随裂纹宽度的增大而变化,速率快速减小。因此,可以采用两个参量组合的办法构造稳定的综合量化指标,以增加裂纹宽度量化的可信度与实用性。构建$\varLambda$如下:
$$ \varLambda = \varepsilon \frac{\gamma }{\delta } $$ (14) 式中:$ \varepsilon $为比例系数,反应两个指标的权重。当$ \varepsilon $=25时,$\varLambda$与裂纹宽度的关系如图15所示。可以看出,当裂纹宽度小于700 μm时,随着裂纹宽度的增加,综合指标$\varLambda$稳定地增加且与裂纹宽度具有较好的对应关系,能够实现裂纹宽度的定量表征;当裂纹宽度大于700 μm时,$\varLambda$无法表征裂纹宽度,但能够定性地区分裂纹宽度。因此,通过准稳态温度场两个空域特征参量的组合可以有效降低病态性的影响。

图 15 $ \varepsilon $=25时指标$\varLambda$随裂纹宽度的变化规律
Figure 15. Variation law of index $\varLambda$ with crack width ($ \varepsilon $=25)
-
为了更好地定量随机裂纹宽度,以验证其准确性,首先从中选取随机裂纹宽度1、2的两个热图并获得其裂纹处的温升变化特征,如图16所示。然后对于已知宽度为900 μm的裂纹热图进行手动分割,得到裂纹中断距离在图像对应的像素点数为8,则标定系数为112.5。文中试验均是按同一个成像距离进行裂纹检测,因此只要获取热图中裂纹所占像素点数,再乘以标定系数即可确定裂纹的宽度值。图16(c)根据图14可以得到随机裂纹宽度1小于随机裂纹宽度2。通过手动分割获得随机裂纹宽度1为1.07 pixel,则宽度为120.375 μm。与实际裂纹宽度125 μm之比为96.3%,随机裂纹宽度2为2.16 pixel,则宽度为243 μm,与实际裂纹宽度250 μm之比为97.2%。其宽度定量计算均在误差允许的范围之内。
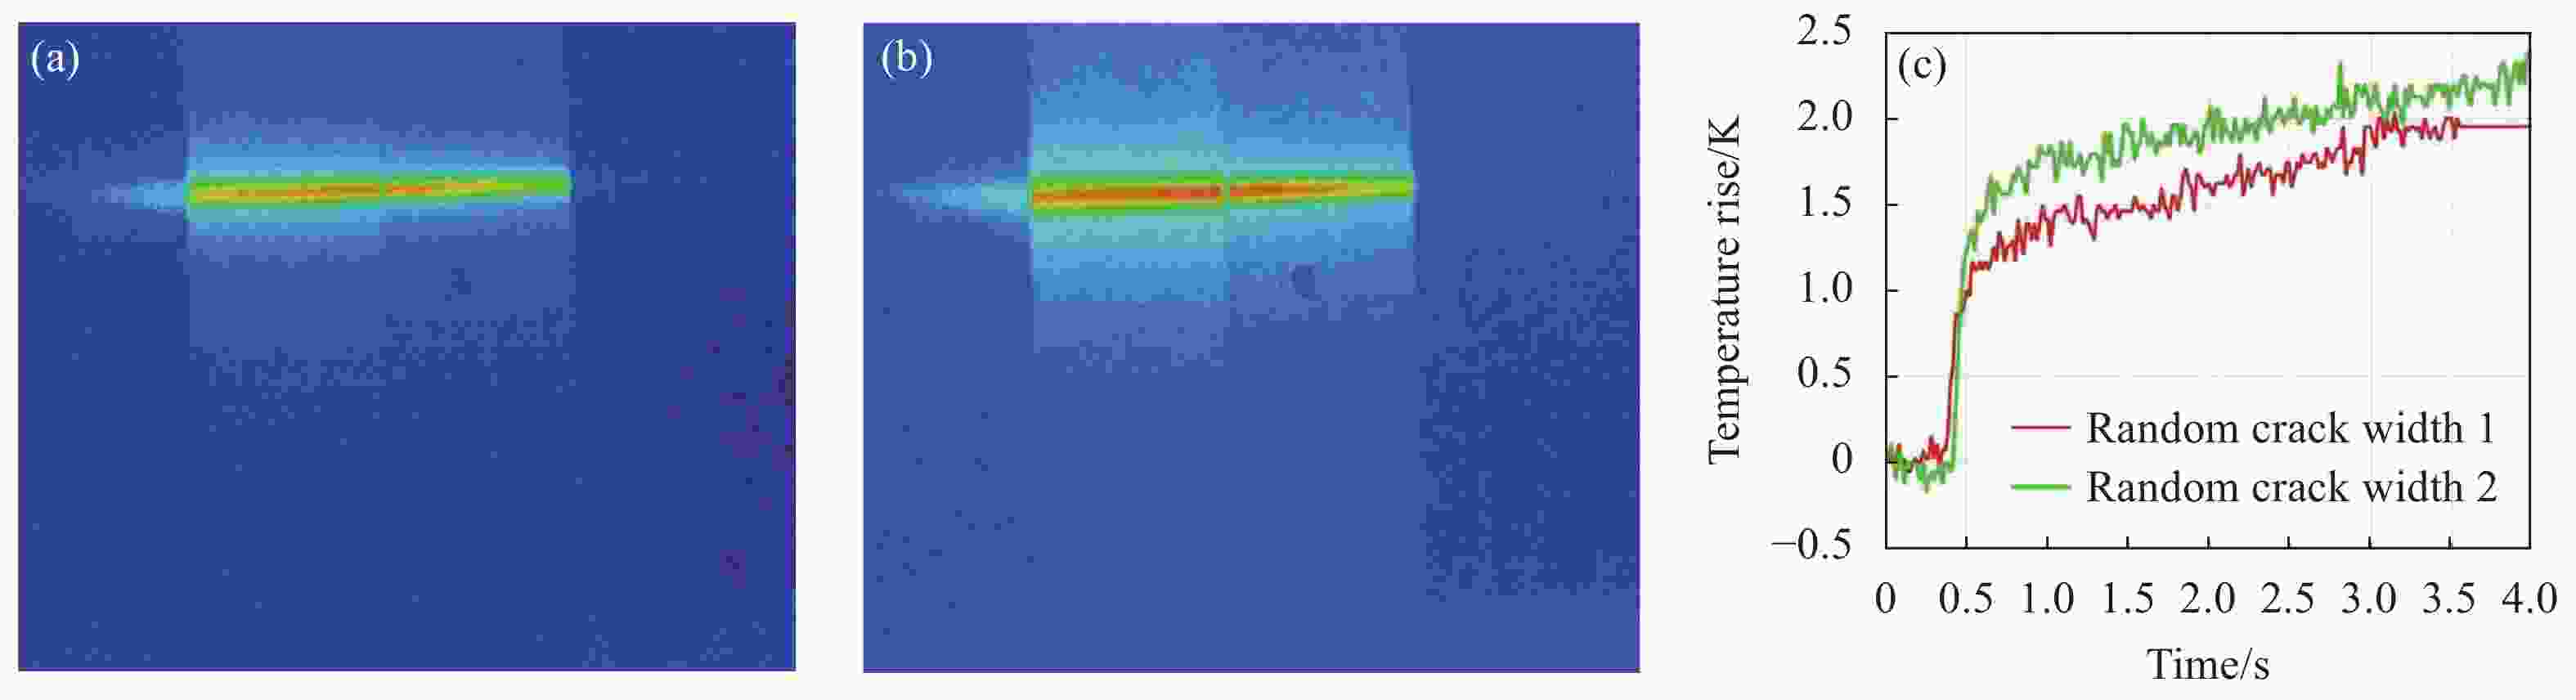
图 16 (a)随机裂纹宽度1热图; (b)随机裂纹宽度2热图;(c)随机裂纹宽度1、2裂纹处温升曲线
Figure 16. (a) Thermal diagram of random crack width 1; (b) Thermal diagram of random crack width 2; (c) Temperature rise curve at random crack width 1 and 2
在热像仪观测距离上,热像仪单个像素表征距离约为256 μm。由图15可知,当裂纹宽度小于300 μm时,实际上热像仪的温度是包括裂纹边缘即试件一部分的“混合温度”,因此拟合关系受到热像仪空间分辨率的影响。但文中方法具有普遍性,随着热像仪空间分辨率的提高,该方法可以适用于量化更窄的裂纹。
-
文中基于表面裂纹处热传导规律进行分析,结合激光线长脉冲热成像检测试验,研究了准稳态温度分布时铝合金表面不同宽度裂纹的温升分布与温升变化特征,分析了温升分布特征参量$ \gamma $以及温升变化特征参量$ \delta $与裂纹宽度之间的关系。$ \gamma $和$ \delta $均随裂纹宽度的增加而呈现先快后慢的变化趋势,且在裂纹宽度超过600 μm都存在病态性。基于两个空域特征参量$ \gamma $和$ \delta $,采用比值定义法构建了不依赖激光功率的裂纹宽度综合指标$\varLambda$,能够实现50~700 μm宽度裂纹的精确定量表征。
Quantitative detection of surface crack width of aluminum alloy based on laser thermography
-
摘要: 针对激光热成像技术定量检测铝合金表面微小裂纹宽度精度不足的问题,通过系统分析表面裂纹处热传导规律,并构建长脉冲激光激励条件下铝合金表面裂纹位置处准稳态温度场的温度分布模型,发现沿激光线方向的温度分布能够定量表征裂纹宽度。搭建了激光红外热成像试验平台并进行试验,获得了准稳态温度场下的温升分布规律,分析了不同宽度裂纹的温升分布特征和温升变化特征,基于温升分布特征参量和温升变化特征参量,采用比值定义法构建了不依赖激光功率的裂纹宽度综合指标。结果表明,所构建的空域特征参量综合指标显著提高了裂纹宽度检测的可靠性和准确性,能够实现50~700 μm宽度裂纹的定量检测,该结果能够为实现激光红外热成像技术在航空航天裂纹量化检测的应用奠定坚实基础。Abstract:
Objective Laser long pulse thermography technology has distinct advantage in quantitative detection of the width of surface microscopic cracks, which is of great importance to the service safety of aluminum alloy structure. However, the heat source excited by long pulse laser decays rapidly in the vicinity of the crack when it expands, which limits the accuracy of the crack width. Besides, crack width detection based on temperature magnitude would be affected obviously even if with slight measurement error. While temperature rise distribution of the crack along the direction of the long pulse laser under the quasi-steady-state temperature field could reflect the width of the surface crack precisely. Therefore, it is necessary to establish the temperature rise characteristics for width detection of microscopic surface crack of aluminum alloy structure. For this purpose, the heat conduction law of surface crack of aluminum alloy under the quasi-steady-state temperature field excited by long pulse laser is proposed, and a systematic experiment is designed in this study. Methods It is found that the temperature rise is minimum at the center of the crack, and the amplitude of temperature rise reduces with the increase of the crack width based on systematical analysis of the quasi-steady-state temperature field distribution excited by long pulse laser at the surface crack. After that, a laser thermal imaging test platform is built, and temperature rise distribution of cracks with different width is collected. The contour distribution of the highest temperature rise at the center of the laser line is extracted (Fig.8), and the weight vector of the crack surface temperature rise distribution is calculated by using the principal component analysis method (Fig. 10-11). The normalized Euclidean norm of the temperature rise curve is extracted based on the temperature rise change at the crack within 4 s after the long pulse laser excitation (Fig.13). Results and Discussions Both parameters decrease rapidly with the increase of the crack width, γ is constructed based on the contour distribution of the quasi-steady-state distribution of temperature (Fig.12), δ is defined based on the Euclidean norm of the temperature rise phase excited by long pulse laser (Fig.14). After that, composite parameter Λ, combined γ with δ, is constructed to eliminate the influence of laser power. The results show that, when the crack width is smaller than 700 μm, parameter Λ shows good linearity to the crack width, and the width pathology effect could be reduced effectively. The detection of crack width would be affected by the resolution of the thermal imaging camera. In this study, a single pixel of the thermal imaging camera is about 256 μm. So when the crack width is smaller than 300 μm, the temperature of the crack collected by the camera is not only from the crack, but also from the edge of the crack, which would affect the accuracy of the width calculation. And the accuracy would be improved by the improvement of the thermal imaging camera resolution. Conclusion In this study, the thermal response of the crack width on the surface of aluminium alloy excited by long pulse laser is analysed based on the heat conduction law. Temperature rise distribution and temperature rise variation of cracks with different width under long pulse laser excitation are investigated. According to the characteristic parameters of temperature rise distribution and temperature rise variation of crack of different widths, a composite index of crack width independent of laser power was established by using ratio definition method. The results show that the composite index of spatial characteristic parameters can greatly improve the reliability and accuracy of crack width detection, and can achieve quantitative detection of cracks of 50-700 μm, which can lay a solid foundation for the application of laser infrared thermography in aerospace crack quantitative detection. -
图 1 激光线长脉冲激励下裂纹附近热传导示意图
Figure 1. Schematic diagram of heat transfer near cracks under laser line of long pulse
图 2 热量在裂纹空气隙中的传递示意图
Figure 2. Schematic diagram of heat conduction in cracked air gaps
图 3 裂纹宽度模拟试件设计。(a) 构造示意图;(b) 塞尺;(c) 铝合金滑块;(d) 组合试件
Figure 3. Analog specimen design of crack width. (a) Schematic diagram of the structure; (b) Plug gauges; (c) Aluminum alloy slider; (d) Com-bined specimen
图 4 激光长脉冲热成像试验平台。 (a) 示意图;(b) 试验装置
Figure 4. Test platform for laser long pulse thermography. (a) Schematic diagram; (b) Test setup
图 6 不同裂纹宽度下激光热斑附近的温升分布
Figure 6. Temperature rise distribution near the laser hot spot with different crack widths
图 7 试件表面温升变化。(a)温升随时间变化;(b)温升幅度比随时间变化
Figure 7. Variation in temperature rise of specimen surface. (a) Temperature rise over time; (b) Temperature rise amplitude ratio over time
图 8 试样表面温升分布。(a)采样线;(b)采样线上的温升分布
Figure 8. Distribution of specimen surface temperature rise. (a) Sampling line; (b) Distribution of temperature rise along the sampling line
图 9 温升分布曲线中心化处理
Figure 9. Centralized processing of the temperature rise distribution curve
图 10 中心化轮廓分布的前3个主成分分量绝对值
Figure 10. Absolute value of the first 3 principal components of centralized contour distribution
图 11 权值向量$ {\boldsymbol{\nu }}$的位置分布
Figure 11. Location distribution of the weight vector ${\boldsymbol{ \nu}} $
图 13 试样裂纹位置处的温升曲线
Figure 13. Temperature rise curves at the location of the crack in the specimen
图 15 $ \varepsilon $=25时指标$\varLambda$随裂纹宽度的变化规律
Figure 15. Variation law of index $\varLambda$ with crack width ($ \varepsilon $=25)
-
[1] Zheng W J, Dong Z B, Wei Y H, et al. Phase field investigation of dendrite growth in the welding pool of aluminum alloy 2A14 under transient conditions [J]. Computational Materials Science, 2014, 82: 525-530. doi: https://doi.org/10.1016/j.commatsci.2013.08.022 [2] Wu H B. Numerical simulation and experimental study of milling deformation of aeronautical frame type monolithic structural parts[D]. Hangzhou: Zhejiang University, 2008. (in Chinese) [3] Maldague X. Introduction to NDT by active infrared thermography [J]. Materials Evaluation, 2002, 60(9): 1060-1073. [4] 朱鑫浩, 侯德鑫, 叶树亮, 等. 圆柱面任意方向裂纹的双线阵激光热像检测[J]. 红外与激光工程, 2020, 49(09): 316-324. doi: 10.3788/IRLA20200097 Zhu Xinhao, Hou Dexin, Ye Shuliang, et al. Dual linear array laser thermography detection of arbitrary direction cracks on cylindrical surface [J]. Infrared and Laser Engineering, 2020, 49(9): 20200097. (in Chinese) doi: 10.3788/IRLA20200097 [5] 王晓娜, 张亦舒, 侯德鑫, 等. 基于线激光正交扫描的电感微裂纹热成像检测[J]. 红外与激光工程, 2020, 49(07): 152-159. doi: 10.3788/IRLA20190522 Wang Xiaona, Zhang Yishu, Hou Dexin, et al. Detection of microcrack in inductor based on orthogonal scanning line laser thermography [J]. Infrared and Laser Engineering, 2020, 49(7): 20190522. (in Chinese) doi: 10.3788/IRLA20190522 [6] 柳祎, 史浩东, 姜会林, 等. 粗糙目标表面红外偏振特性研究[J]. 中国光学, 2020, 13(03): 459-471. Liu Yi, Shi Haodong, Jiang Huilin, et al. Infrared polarization properties of targets with rough surface [J]. Chinese Optics, 2020, 13(3): 459-471. (in Chinese) [7] 杨建国, 罗琳, 金伟其, 等. “十”字型四孔径视场部分重叠仿生热成像[J]. 光学精密工程, 2022, 30(09): 1019-1028. Yang Jianguo, Luo Lin, Jin Weiqi, et al. Bionic thermal imaging with cross-shaped four-aperture partially overlapped field of view [J]. Optics and Precision Engineering, 2022, 30(9): 1019-1028. (in Chinese) [8] 邹永宁, 张智斌, 李琦等. 基于Hessian矩阵和支持向量机的CT图像裂纹分割[J]. 光学精密工程, 2021, 29(10): 2517-2527. doi: 10.37188/OPE.2021.0349 Zou Yongning, Zhang Zhibin, Li Qi, et al. Crack detection and segmentation in CT images using Hessian matrix and support vector machine [J]. Optics and Precision Engineering, 2021, 29(10): 2517-2527. (in Chinese) doi: 10.37188/OPE.2021.0349 [9] 赵家旺, 张运海, 王发民等. 线扫描虚拟结构调制共聚焦显微成像[J]. 中国光学, 2021, 14(02): 431-445. doi: 10.37188/CO.2020-0120 Zhao Jiawang, Zhang Yunhai, Wang Famin, et al. Line-scanning confocal microscopic imaging based on virtual structured modulation [J]. Chinese Optics, 2021, 14(2): 431-445. (in Chinese) doi: 10.37188/CO.2020-0120 [10] Puthiyaveettil N, Rajagopal P, Balasubramaniam K, et al. Influence of absorptivity of the material surface in crack detection using Laser spot thermography [J]. NDT & E International, 2021, 120: 102438. doi: 10.1016/j.ndteint.2021.102438 [11] Khodayar F, Sojasi S, Maldague X. Infrared thermography and NDT: 2050 horizon [J]. Quantitative InfraRed Thermography Journal, 2016, 13(2): 210-231. doi: 10.1080/17686733.2016.1200265 [12] Qiu J, Pei C, Liu H, et al. Detection of surface cracks by laser spot thermography at elevated temperature [J]. International Journal of Applied Electromagnetics and Mechanics, 2019, 59(4): 1553-1559. doi: 10.3233/JAE-171195 [13] Rashed A, Almond D P, Rees D A S, et al. Crack detection by laser spot imaging thermography[C]//AIP Conference Proceed-ings, 2007, 894(1): 500-506. [14] Pech-May N W, Oleaga A, Mendioroz A, et al. Fast characterization of the width of vertical cracks using pulsed laser spot infrared thermography [J]. Journal of Nondestructive Evaluation, 2016, 35(2): 1-10. doi: https://doi.org/10.1007/s10921-016-0344-x [15] González J, Mendioroz A, Sommier A, et al. Fast sizing of the width of infinite vertical cracks using constant velocity Flying-Spot thermography [J]. NDT & E International, 2019, 103: 166-172. [16] Pech-May N W, Oleaga A, Mendioroz A, et al. Vertical cracks characterization using lock-in thermography: II nfinite cracks [J]. Measurement Science and Technology, 2014, 25(11): 115602. doi: 10.1088/0957-0233/25/11/115602 [17] Jinyeol Y, Jaemook C, Soonkyu H, et al. A reference-free micro defect visualization using pulse laser scanning thermography and image processing [J]. Measurement Science and Technology, 2016, 27(8): 085601. doi: 10.1088/0957-0233/27/8/085601 [18] Colom M, Rodriguez A J, Mendioroz A, et al. Imaging real cracks: evaluation of the depth and width of narrow fatigue cracks in Al-alloys using laser-spot lock-in thermography[C]//Thermosense: Thermal Infrared Applications XLIII, 2021, 11743: 117430F. [19] Yang J, Dong L H, Wang H D, et al. The curve cluster analyses for the characterizations of material defects by long-pulsed laser thermography [J]. Infrared Physics & Technology, 2022, 120: 103956. doi: https://doi.org/10.1016/j.infrared.2021.103956 [20] Yang J, Dong L H, Wang H D, et al. The wavelet-based self-similarity analysis for the detection of fatigue microcrack by the joint scanning laser thermography [J]. International Journal of Thermophysics, 2022, 43(2): 1-22. -

 点击查看大图

计量
- 文章访问数: 66
- HTML全文浏览量: 15
- PDF下载量: 20
- 被引次数: 0

