


-
星敏感器是一种以恒星为参考基准的定姿设备,具有良好的测量隐蔽性、抗电磁干扰性和极高的定姿精度,是飞机、飞艇和舰船等平台姿轨控系统不可缺少的姿态测量设备之一[1]。然而受限于强天空背景辐射影响,星敏感器白昼测星较为困难,一直限制其在大气层内的推广应用,这也是当前全天时星敏感器的关键技术瓶颈所在[2]。相较于可见光波段,近红外波段天空背景辐射强度大幅减小、且存在明显的大气窗口。因此,基于近红外波段的全天时星敏感器一直是国内外研究热点[3–4]。
天文学上根据大气窗口将近红外波段划分为R、I、J、H、K等波段,不同波段间存在明显的大气吸收带[5]。受限于早期红外传感器量子效率低、噪声大,光学镜头红外波段透过率低等因素影响,全天时星敏感器研究多集中于大气影响较弱的高空平台,采用宽光学响应波段增加透光量以缩短曝光时间,进而降低传感器固有噪声,以提升测星效果[6]。近年来,星敏感器相关硬件技术迅猛发展,如美国Sensors Unlimited公司生产的5 μm像元的新型InGaAs传感器,暗电流$ < 0.26\;\text{nA}/{\text{cm}}^{2}@0\;℃ $,读出噪声$<50\;{e}^-$,量子效率高达80%;Navitar 生产的OptiStar SWIR 119180红外镜头透过率可达95%等[7]。得益于此,近地空间大气层内全天时星敏感器的白昼观星能力明显提升,部分星敏感器已可实现白昼6等以上恒星观测[8]。与此同时,近地空间大气透过率变化复杂且存在明显吸收带,传统宽波段设计带来的整体测星信噪比较低和星点成像色差等问题,逐步成为制约全天时星敏感器星点高精度提取的瓶颈因素[9]。因此,根据近红外波段大气窗口特性,对全天时星敏感器光学响应波段进行优化设计,对于进一步提高全天时星敏感器测星能力和定姿精度具有的重要意义。
目前,虽然围绕全天时星敏感器的研究较多,但主要集中于探测器硬件设计、星表建立、星点提取等方面,对星敏感器敏感波段选择研究关注较少,星敏感器实际采用波段也不尽相同。如Marie Rex等在BLAST高空气球实验中,依据天空背景辐射亮度因素,选择600~850 nm波段作为星敏感器光学响应波段[10];张凯胜等在进行大相对孔径全天时星敏感器光学设计时,参考各波段夜间测星信噪比,提出采用1100~1400 nm 波段作为星敏感器光学响应波段[1];张海龙等在全天时星敏感器整体设计时,根据恒星辐流量特点分析认为H波段为星敏感器探测性能最优的波段[11] ;王文杰在观星实验中,根据同一颗恒星信噪比,认为1300 nm截至光学响应波段性能优于1500 nm截至波段等[12]。然而,由于大气透过率、天空背景辐射、0星等辐流量定义、恒星分布密度等影响因素并非独立或线性相关,这些单一角度的分析方法并不严谨,所得结论也并不统一。
为此,文中从各光学响应波段0星等辐流量定义出发,顾及不同波段大气背景辐射及透过率等多种因素影响,推导出同等硬件条件下不同响应波段恒星信噪比关系;在此基础上,利用modtran软件仿真计算出相关波段大气参数值,并结合对应波段恒星分布密度,量化对比了采用不同光学响应波段的全天时星敏感器实际恒星探测能力;最后搭建了白昼观星平台对相关波段实际测星效果进行了验证。
-
天文学上用星等来衡量恒星的明暗程度,不同星等对应不同辐流量大小,通常采用普森公式定量计算相邻星等之间的辐流量差异[13]。设两颗恒星辐流量分别为$ {F_1} $、${F_2}$,相应的星等为${m_1}$、${m_2}$,则有如下关系:
$$ {m_1} - {m_2} = - 2.512\lg \frac{{{F_1}}}{{{F_2}}} $$ (1) 由此可以看出,星等是表征恒星相对辐流量大小的量,只有定义各波段0星等辐流量才能计算出各恒星在该波段的对应星等。最初天文学家pogson在建立普森公式时,提出将织女星(Vega)作为全波段0星等标准,并称为Vega magnitude[14]。但随着天文观测技术提高,发现Vega可能是一颗造父变星,不能满足0星等绝对定标精度要求[15]。因此,不同天文星表通常基于项目观测仪器、滤光片带宽、观测位置等因素建立符合项目实际的测光系统[16-17],如Johson的11色测光系统、SDSS项目的ugriz测光系统、2 MASS项目的JHK测光系统等。但它们大都是Vega magnitude的延续,0星等定标辐流量与Vega相应波段辐流量相差不大[18–21]。表1为USNO及2 MASS星表测光系统参数。
Starlist Filter ${\lambda _{eff} }/{\text{μm}}$ Bandwidth $\Delta \lambda $$/{\text{μm}}$ $ {F_\lambda } $$/ W \cdot { {\rm{cm} }^{ - 2} } \cdot {\text{μ} {\rm{m} }^{ - 1} }$ In-band$/{\rm{W} } \cdot { {\rm{cm} }^{ - 2} }$ USNO R 0.620 0.125 2.42E-12 3.03E-13 I 0.767 0.148 1.26E-12 1.86E-13 2 MASS J 1.235 0.162 3.129E-13 5.082E-14 H 1.662 0.251 1.133E-13 2.843E-14 K 2.159 0.262 4.283E-14 1.122E-14 表1中,$ {\lambda _{eff}} $为各波段有效波长,数值与带宽中心波长相近,文中不做区分;$\Delta \lambda $为半波带宽,$ {F_\lambda } $为有效波长处对应0星等辐流量值,带宽内0星等流量近似为$ {F_\lambda } $乘半波带宽$\Delta \lambda $,具体相关定义及关系可参照文献[22]。
-
白昼天空背景辐射和大气透过率是影响全天时星敏感器恒星探测能力的重要因素。其中白昼天空背景辐射短波波段,主要为大气散射太阳光产生的大气背景辐射。由于全方位测量大气背景辐射及透过率成本高、效率低,目前国内外多采用美国空军开发的modtran大气计算软件进行仿真计算,具有很好的精度和可靠性。因此文中对大气背景辐射和大气透过率分析采用modtran软件进行。
影响大气背景辐射及大气透过率的因素有很多,但主要因素为大气中的低空气溶胶、水汽、${{\rm{CO}}_2}$,前两者主要集中在2 km以下的低层大气中,${{\rm{CO}}_2}$在50 km以下几乎不随高度变化[23]。因此对于星敏感器无云雨,远离城市气溶胶的工作环境,气溶胶、水汽、${{\rm{CO}}_2}$等气象因素变化影响可以忽略。利用modtran软件,设置仿真参数为无云雨、高度6 km、美国1976标准大气模型,观测天顶角45°,观测方向为正南方向,仿真得到正午大气背景辐射亮度并作为全天背景亮度的典型值,如图1所示。

图 1 大气背景辐射典型值
Figure 1. Typical values of atmospheric background radiation
在同样参数条件下,利用modtran仿真得到30°、60°、80°观测天顶角的大气透过率,作为星敏感器不同敏感方向大气透过率典型值,如图2所示。

图 2 不同观测天顶角大气透过率
Figure 2. Atmospheric transmittivity at different zenith angles
通过图1、2可知,波长越长,大气背景辐流量越小,且在不同波段存在明显的大气窗口。但对于全天时星敏感器而言,当光学响应波长超过2 μm时,仪器自身辐射会对恒星探测产生干扰。因此,综合红外传感器响应特性、大气背景辐射、大气透过率等因素,全天时星敏感器的光学响应波段一般选择在600~1700 nm之间,即R、I、J、H波段[24–26]。为规避各波段大气窗口带宽不同影响,系统分析全天时星敏感器实际恒星探测力与响应波段之间关系,在R、I、J、H波段大气窗口内取100 nm带宽波段大气背景辐射强度及大气透过率积分均值见表2,其中大气透过率取三个观测天顶角的均值,作为全天空大气透过率典型值。
表 2 不同波段大气参数均值
Table 2. Mean values of atmospheric parameters in different bands
Band R I J H Bandwidth/μm 0.6-0.7 0.75-0.85 1.2-1.3 1.6-1.7 Transmissivity 0.82 0.90 0.96 0.97 Radiance/${\rm{W} } \cdot { {\rm{cm} }^{ - 2} } \cdot{ {\rm{sr} }^{ - 1} } \cdot \text{μ}{\rm{m} } {^{ - 1} }$ 8.68E-04 3.34E-04 3.69E-05 8.01E-06 -
对于星敏感器而言,恒星可以视为点光源,星敏感器接受恒星能量信号与光学系统的通光口径、传感器量子效率、曝光时间有关。对于响应波段为$ [{\lambda _1},{\lambda _2}] $的星敏感器,成像器件产生的信号光子数可表示为:
$$ {{{S}}_m} = \int_{{\lambda _1}}^{{\lambda _2}} {F(\lambda )} \cdot {\tau _0}(\lambda )\frac{{\pi {D^2}}}{4}{\tau _{opt}}\left( \lambda \right)\Delta t\frac{{{Q_{qua}}}}{{Wph}}{\rm{d}}\lambda $$ (2) 式中:$ F(\lambda ) $表示星等为$m$的恒星光谱辐流量;$ {\tau _0}(\lambda ) $为大气透过率;$D$为光学系统通光口径;$ {\tau _{opt}}\left( \lambda \right) $为光学系统透过率;$ \Delta t $为积分时间;$ {Q_{qua}} $为探测器的量子效率;$ Wph = {{hc} \mathord{\left/ {\vphantom {{hc} \lambda }} \right. } \lambda } $表示单个光子的能量;积分限$ [{\lambda _1},{\lambda _2}] $表示星敏感器光学系统的光谱响应范围。
大气作为辐射体,单像元接收到的能量为传感器像元对应的球面度与大气辐射强度的乘积,因此单像元大气背景辐射光子数可表示为:
$$ {{{S}}_b} = \int_{{\lambda _1}}^{{\lambda _2}} {{I_b}} (\lambda )\frac{{\pi {D^2}}}{4}{\tau _{opt}}(\lambda )\Delta t\frac{{{Q_{qut}}}}{{Wph}}\varOmega {\rm{d}}\lambda $$ (3) 式中:${I_b}(\lambda )$为大气背景辐射亮度;$ \varOmega = {{{d^2}} \mathord{\left/ {\vphantom {{{d^2}} {{f_{}}^2}}} \right. } {{f_{}}^2}} $为单像元对应辐射球面度;$d$为单个像元直径;$f$为光学系统焦距。
-
红外传感器噪声主要包括暗电流噪声、读出噪声、散粒噪声、量化噪声等,对于新一代红外传感器而言,暗电流噪声、量化噪声小到可以忽略,读出噪声通过相关技术也可以有效抑制,但散粒噪声是由光子入射及光电转化过程随机性造成,没有有效方法抑制[27]。表3为两款典型红外传感器参数。
表 3 典型红外传感器参数
Table 3. Typical IR sensor parameters
Name Model Total
pixelsDepth Full well Dark current Readout
noiseQHY990 CMOS 1392×1052 12 bit A/D 120 ke ≤227 e−/pixel ≤150 e− ZephIR™ CCD 640×512 14 bit A/D 110 ke ≤125 e−/pixel ≤75 e− 由表3可知,对于白昼强天空背景而言,暗电流噪声、量化噪声、读出噪声相对于光子散粒噪声可以忽略不计,强天空背景造成的光子散粒噪声是星敏感器主要噪声源[27],其受传感器信号光子数影响,服从泊松分布,方差为:
$$ {\delta _p} = \sqrt {{S_{signal}}} $$ (4) 在短波区间传感器的量子效率$ {Q_{qua}} $,单个光子的能量$ Wph $、光学系统的透过率$ {\tau _{opt}}\left( \lambda \right) $,以及大气透过率$ {\tau _0}(\lambda ) $均可视为常值,综合公式(2)~(4)可推导出星敏感器探测信噪比$ SNR $公式如下:
$$ \begin{split} S N R = \frac{{\rho {S_m}}}{{\sqrt {\rho {S_m} + {S_b} + {I_d}\Delta {\text{t}} + \sigma _{read}^2} }} \approx \frac{{\rho {S_m}}}{{\sqrt {\rho {S_m} + {S_b}} }} =\\ \sqrt {\dfrac{{\pi {D^2}}}{4}\dfrac{{{Q_{qua}}}}{{hc}}{\tau _{opt}}\left( \lambda \right)\Delta t} \frac{{\rho {\tau _0}(\lambda )\displaystyle\int_{{\lambda _1}}^{{\lambda _2}} {F(\lambda )} \sqrt \lambda {\rm{d}}\lambda }}{{\sqrt {\displaystyle\int_{{\lambda _1}}^{{\lambda _2}} {\rho F(\lambda )} {\tau _0}(\lambda ){\rm{d}}\lambda + \displaystyle\int_{{\lambda _1}}^{{\lambda _2}} {{I_b}} (\lambda )\varOmega {\rm{d}}\lambda } }} \\ \end{split} $$ (5) 式中:${I_d}\Delta {{t}}$为探测器暗电流噪声;$ \sigma _{read}^2 $为探测器读出噪声。综合公式(2)、(3)可推导出恒星与背景对比度$CR$公式如下:
$$ \begin{split} CR = \dfrac{{\rho {S_m}}}{{{S_b}}} =& \dfrac{{\rho \displaystyle\int_{{\lambda _1}}^{{\lambda _2}} {F(\lambda )} \cdot {\tau _0}(\lambda )\dfrac{{\pi {D^2}}}{4}{\tau _{opt}}\left( \lambda \right)\Delta t\dfrac{{{Q_{qua}}}}{{Wph}}{\rm{d}}\lambda }}{{\displaystyle\int_{{\lambda _1}}^{{\lambda _2}} {{I_b}} (\lambda )\dfrac{{\pi {D^2}}}{4}{\tau _{opt}}(\lambda )\Delta t\dfrac{{{Q_{qut}}}}{{Wph}}\varOmega {\rm{d}}\lambda }} = \\ & \dfrac{{\rho {\tau _0}(\lambda )\displaystyle\int_{{\lambda _1}}^{{\lambda _2}} {F(\lambda )} {\rm{d}}\lambda }}{{\displaystyle\int_{{\lambda _1}}^{{\lambda _2}} {{I_b}} (\lambda )\varOmega {\rm{d}}\lambda }} \\[-10pt] \end{split} $$ (6) 式中:$\;\rho $为散焦后单个像元信号光子占星点总能量的比值。取典型星敏感器工作条件如表4所示。
表 4 典型星敏感器工作条件
Table 4. Typical star sensor operating conditions
Pixel size/μm Focal length/mm $ \;\rho $ Band $ {\tau _0}(\lambda ) $ $ {I_b} $$/{\rm{W} } \cdot { {\rm{cm} }^{ - 2} }\cdot { {\rm{sr} }^{ - 1} }\cdot \text{μ} {\rm{m} } {^{ - 1} }$ $ F(\lambda ) $ $/ W \cdot { {\rm{cm} }^{ - 2} }\cdot \text{μ} { {\rm{m} }^{ - 1} }$ 5 100 0.25 R 0.81 8.68E-04 2.42E-12 0.25 I 0.89 3.34E-04 1.26E-12 0.25 J 0.85 3.69E-05 3.129E-13 0.25 H 0.95 8.01E-06 1.133E-13 根据公式(6),计算出在R、I、J、H等波段,0等星星点与大气背景的对比度$CR$分别为0.23、0.34、0.72、1.34。代入公式(6)则:
$$ S N R = \frac{{\rho {S_m}}}{{\sqrt {\rho {S_m} + {S_b}} }} = \frac{{CR}}{{\sqrt {1 + CR} }} \approx \frac{{\rho {S_m}}}{{\sqrt {{S_b}} }} $$ (7) 产生的近似误差分别为0.02、0.05、0.17、0.47,且随着星等增加成指数级减小,对于1等星产生近似误差为0.003、0.008、0.04、0.10。因此对实现1等星以上探测需求的星敏感器而言,公式(5)可简化为:
$$ \begin{split} S N R \approx & \dfrac{{\rho {S_m}}}{{\sqrt {{S_b}} }} = \sqrt {\dfrac{{\pi {D^2}}}{4}\dfrac{{{Q_{qua}}}}{{hc}}{\tau _{opt}}\left( \lambda \right)\Delta t} \dfrac{{\rho \displaystyle\int_{{\lambda _1}}^{{\lambda _2}} {F(\lambda )} \cdot {\tau _0}(\lambda )\sqrt \lambda {\rm{d}}\lambda }}{{\sqrt {\displaystyle\int_{{\lambda _1}}^{{\lambda _2}} {{I_b}} (\lambda )\varOmega {\rm{d}}\lambda } }} = \\ & {C_{sensor}} \cdot \dfrac{{{\tau _0}(\lambda )\sqrt {\Delta t} \displaystyle\int_{{\lambda _1}}^{{\lambda _2}} {F(\lambda )\sqrt \lambda } {\rm{d}}\lambda }}{{\sqrt {\displaystyle\int_{{\lambda _1}}^{{\lambda _2}} {{I_b}} (\lambda ){\rm{d}}\lambda } }} \\ \end{split} $$ (8) $$ {C_{sensor}} = \rho \sqrt {\frac{{\pi {D^2}}}{{4\varOmega }}\frac{{{Q_{qua}}}}{{hc}}{\tau _{opt}}\left( \lambda \right)} $$ (9) 式中:$ {C_{sensor}} $为与传感器硬件相关的信噪比系数,主要与光学系统口径$ D $、光学系统透过率$ {\tau _{opt}}\left( \lambda \right) $、探测器量子效率 $ {Q_{qua}} $、单像元对应辐射球面度$ \varOmega $等因素相关。
恒星连续光谱主要受恒星温度影响,实际应用中通常采用黑体辐射光谱来表征恒星辐射光谱。由普朗克黑体辐射相关知识可知,温度为$ T $的恒星辐射光谱通量密度可表示为[28]:
$$ {F_B}(\lambda ) = \pi B(\lambda ) = \frac{{2\pi h{c^2}}}{{{\lambda ^5}({{\rm{e}}^{hc/\lambda kT}} - 1)}} $$ (10) 式中:$ B(\lambda ) $为恒星黑体辐射光谱辐流量;$h$为普朗克常量,值为$6.626\;068\;76 \times {10^{ - 34}}\;{\rm{J}} \cdot {\rm{s}}$;$c$为光速,值为$ 2.997\;93 \times {10^8}\;{\rm{m}} \cdot {{\rm{s}}^{ - 1}} $;$\lambda $为波长;$T$为恒星色温度;$k$为玻耳兹曼常量,值为$1.380\;658 x{10^{ - 23}}\;{\rm{J}} \cdot {{\rm{K}}^{ - 1}}$。
根据公式(10)可知,设$ {\lambda _n} $为波段$ [{\lambda _1},{\lambda _2}] $的中心波长,$ {\lambda _\Delta } $为波段带宽,恒星光谱连续积分$ \displaystyle\int_{{\lambda _1}}^{{\lambda _2}} {F(\lambda )\sqrt \lambda } {\rm{d}}\lambda $与$ F({\lambda _n})\sqrt {{\lambda _n}} {\lambda _\Delta } $误差为:
$$ {Re} = 1 - \frac{{F({\lambda _n})\sqrt {{\lambda _n}} {\lambda _\Delta }}}{{\displaystyle\int_{{\lambda _1}}^{{\lambda _2}} {F(\lambda )} \sqrt \lambda {\rm{d}}\lambda }} $$ (11) 通过仿真计算可知,在$ {\lambda _n} $处于600~1700 nm范围,带宽200 nm以内,恒星温度为15000 K以下, Re值不超过0.05,因此用$ F({\lambda _n})\sqrt {{\lambda _n}} {\lambda _\Delta } $替换$ \int_{{\lambda _1}}^{{\lambda _2}} {F(\lambda )\sqrt \lambda } {\rm{d}}\lambda $并不影响信噪比推算精度,公式(8)可进一步简化为:
$$ \begin{split} S N R =& {C_{sensor}} \cdot \frac{{{\tau _0}(\lambda )\sqrt {\Delta t} \displaystyle\int_{{\lambda _1}}^{{\lambda _2}} {F(\lambda )} \sqrt {{\lambda _{}}} {\rm{d}}\lambda }}{{\sqrt {\displaystyle\int_{{\lambda _1}}^{{\lambda _2}} {{I_b}} (\lambda ){\rm{d}}\lambda } }} \approx \\ & {C_{sensor}} \cdot \frac{{{\tau _0}(\lambda )\sqrt {\Delta t} F({\lambda _n})\sqrt {{\lambda _n}} ({\lambda _2} - {\lambda _1})}}{{\sqrt {\displaystyle\int_{{\lambda _1}}^{{\lambda _2}} {{I_b}} (\lambda ){\rm{d}}\lambda } }} \\ \end{split} $$ (12) 由公式(12)可知,探测器信噪比不仅与探测自身硬件$ {C_{sensor}} $有关,还与光学响应波段区间$ [{\lambda _1},{\lambda _2}] $、大气透过率$ {\tau _0}(\lambda ) $、恒星在光学响应波段中心波长处辐流量$ F({\lambda _n}) $、大气背景辐流量$ {I_b}({\lambda _{}}) $有很大关系。因此在探测器硬件条件一定的前提下,光学响应波段的选择也会明显影响星敏感器探测信噪比。
-
结合表1、2中R、I、J、H波段0星等辐流量大小及大气透过率典型值,利用公式(13)可计算出100 nm响应带宽条件下,全天时星敏感器采用不同光学响应波段0等星探测信噪比为:
$$ \begin{gathered} S N {R_{R100}} = \frac{{{C_{sensor}}{\tau _0}(\lambda )\sqrt {\Delta t} F({\lambda _{Rn}})\sqrt {{\lambda _{Rn}}} ({\lambda _{R2}} - {\lambda _{R1}})}}{{\sqrt {\displaystyle\int_{{\lambda _{R1}}}^{{\lambda _{R2}}} {{I_b}} (\lambda ){\rm{d}}\lambda } }} \\ S N {R_{I100}} = 0.62\sqrt {\frac{{\displaystyle\int_{{\lambda _{R1}}}^{{\lambda _{R2}}} {{I_b}} ({\lambda _{Rn}}){\rm{d}}\lambda }}{{\displaystyle\int_{{\lambda _{I1}}}^{{\lambda _{I2}}} {{I_b}} ({\lambda _{In}}){\rm{d}}\lambda }}} \cdot S N {R_{R100}} \\ S N {R_{J100}} = 0.24\sqrt {\frac{{\displaystyle\int_{{\lambda _{R1}}}^{{\lambda _{R2}}} {{I_b}} ({\lambda _{Rn}}){\rm{d}}\lambda }}{{\displaystyle\int_{{\lambda _{J1}}}^{{\lambda _{J2}}} {{I_b}} ({\lambda _{Jn}}){\rm{d}}\lambda }}} \cdot S N {R_{R100}} \\ S N {R_{H100}} = 0.10\sqrt {\frac{{\displaystyle\int_{{\lambda _{R1}}}^{{\lambda _{R2}}} {{I_b}} ({\lambda _{Rn}}){\rm{d}}\lambda }}{{\displaystyle\int_{{\lambda _{J1}}}^{{\lambda _{J2}}} {{I_b}} ({\lambda _{Hn}}){\rm{d}}\lambda }}} \cdot S N {R_{R100}} \\ \end{gathered} $$ (13) 式中:$ SN{R_{R100}} $、$ SN{R_{I100}} $、$ SN{R_{J100}} $、$ SN{R_{H100}} $为对应光学响应波段0等星的探测信噪比;$ {\lambda _{Rn}} $为R波段中心波长;${\lambda _{R2}} -{\lambda _{R1}}$为R波段波段区间,其他波段变量命名类同。利用公式(13),对应表4中各波段大气背景辐射强度典型值,求出各波段0等星信噪比比例见表5。
表 5 各波段0等星信噪比比例(SNRR100)
Table 5. SNR ratio of 0 magnitude stars in each band (SNRR100)
Band R I J H Width$/{\text{μm} }$ 0.6-0.7 0.75-0.85 1.2-1.3 1.6-1.7 Ratio 1 1.01 1.16 1.04 由表5可知,在白昼条件下,J波段0等星信探测噪比最强,其次为H波段,分别为R波段0等星信噪比的1.16、1.04倍。
由1.1节可知,恒星星等实际表征对应波段辐流量大小,对于采用不同光学响应波段的星敏感器,对应0等星信噪比越高,星敏感器实际探测的极限星等也越高。设两个波段0等星探测信噪比分别为$ SN{R_1} $、$ SN{R_2} $,则实际星敏感器对应波段探测星等${m_1}$、${m_2}$关系为:
$$ \dfrac{{S N {R_1}}}{{S N {R_2}}} \approx \dfrac{{{{\rho {S_{m1}}}}/{{\sqrt {{S_b}} }}}}{{{{\rho {S_{m2}}}}/{{\sqrt {{S_b}} }}}} = \dfrac{{{S_{m1}}}}{{{S_{m2}}}} = {2.512^{{m_1} - {m_2}}} $$ (14) 通过公式(14)可将不同波段0星等信噪比关系转换为同等硬件条件下可探测星等关系,可表示为:
$$ {m_1} - {m_2} = {\lg _{2.512}}\frac{{S N {R_1}}}{{S N {R_2}}} $$ (15) 由公式(15)计算可知,当全天时星敏感器在R波段可探测极限星等为0等星时,则在I、J、H波段可分别探测到对应波段极限星等分别为0.011、0.161、0.043等星。
由于各波段同星等恒星分布密度并不相同,只有具体结合各星等恒星统计数量,才能准确分析全天时星敏感器采用不同光学响应波段的实际测星能力。依据USNO星表和2 MASS星表,分别对R、I、J、H波段各星等恒星数量进行统计,如表6所示。
表 6 R、I、J、H波段恒星统计
Table 6. Star statistics in R, I, J, and H bands
Magnitude 0 1 2 3 4 5 6 R band 12 26 98 280 870 2618 8385 I band 18 36 126 439 1422 4472 14730 J band 66 177 688 2182 6273 17894 57975 H band 171 569 1825 5527 19594 45210 130851 工程应用中,信噪比大于6即可准确提取出目标。以全天时星敏感器对R波段0等星探测信噪比为变量,结合不同波段恒星统计数量,分析可得全天时星敏感器采用不同光学响应波段的实际可探测对应波段恒星数量如图3所示。由此可知,同等硬件条件下全天时星敏感器采用H波段恒星探测数量明显多于J波段,说明仅依据不同波段0星等信噪比大小并不能判断星敏感器实际恒星探测能力,结合对应波段恒星的分布密度,才能准确分析出星敏感器实际探测恒星的能力。

图 3 采用不同光学响应波段探测恒星数量
Figure 3. Detecting number of stars with different optical responding bands
为定量分析全天时星敏感器在同等硬件条件下,采用不同光学响应波段对星敏感器探测恒星数量的具体影响,以星敏感器对R波段0等星探测信噪比SNR为参考,分别统计采用不同光学响应波段星敏感器实际探测恒星数量,统计数据如表7所示。
表 7 不同光学响应波段探测恒星数量统计
Table 7. Statistics of the number of detected stars in different optical response bands
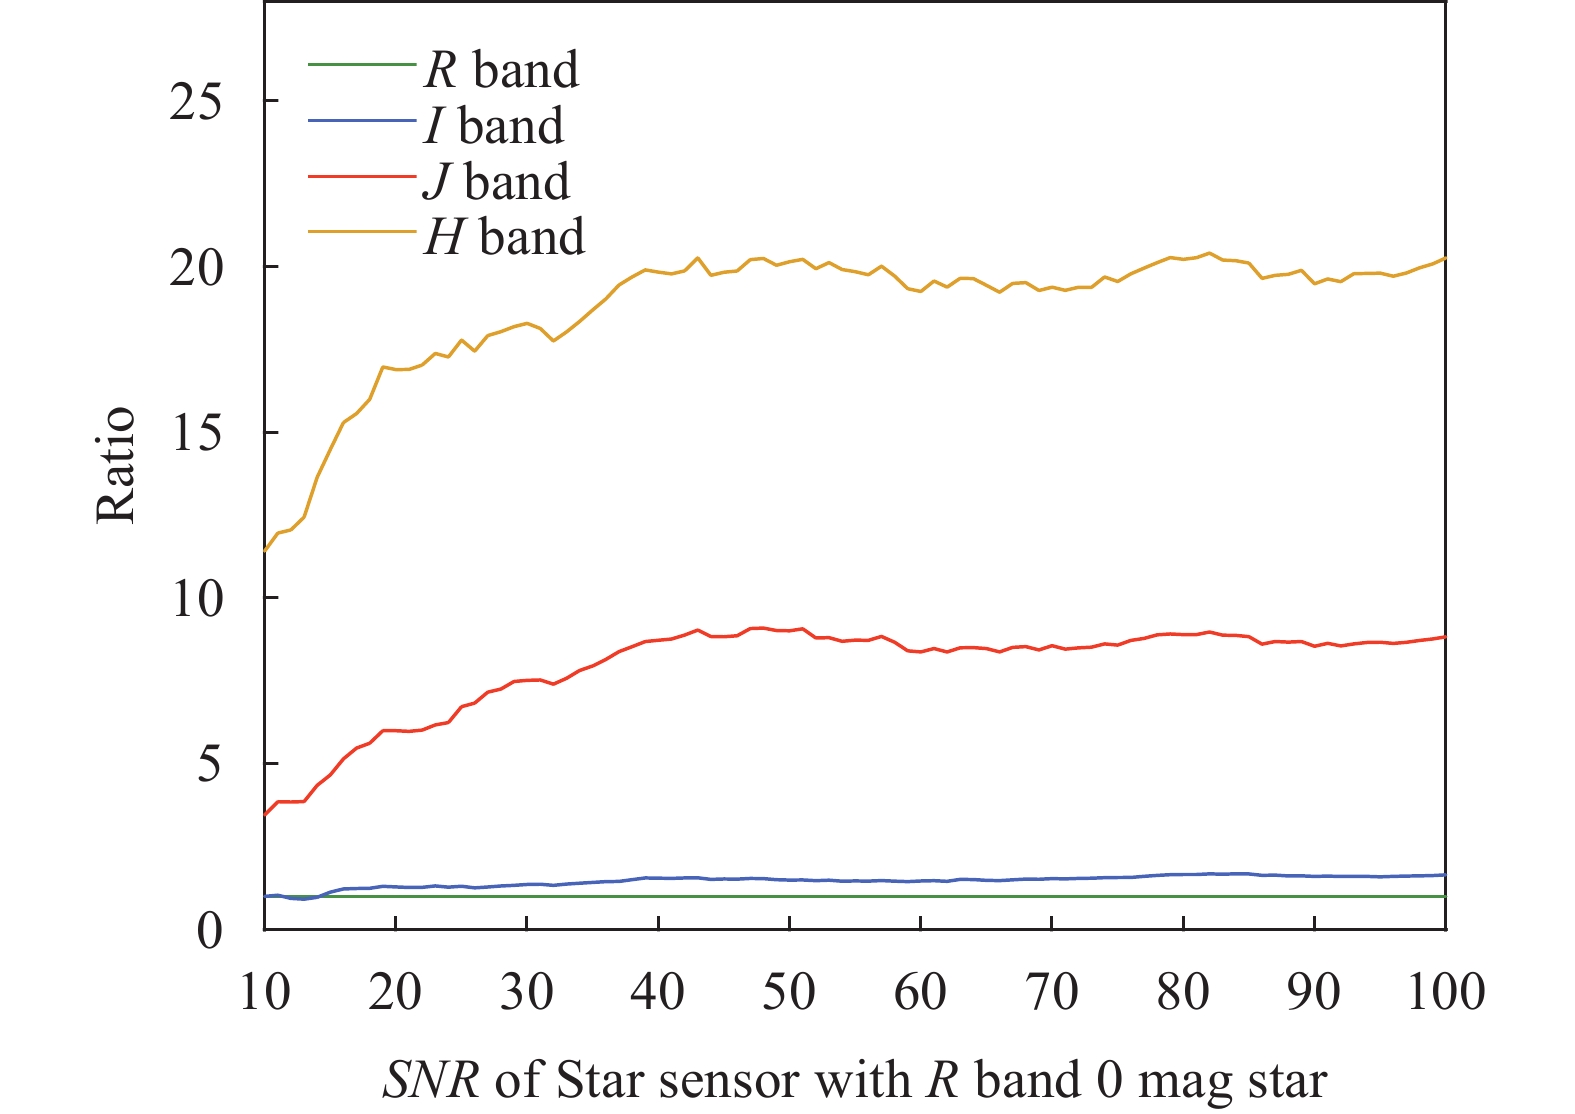
SNR 10 20 30 40 50 60 70 80 90 100 Band R 26 49 75 100 130 172 205 230 275 300 I 27 63 102 155 194 252 315 382 441 495 J 90 294 564 873 1172 1441 1756 2047 2351 2650 H 297 828 1372 1984 2620 3312 3974 4652 5359 6080 由表7可知,当全天时星敏感器对R波段0等星探测信噪比达到100时,R波段可探测恒星数为300颗,采用I、J、H波段可分别多探测195、2350、5780颗恒星,提升比为65%、782%、1926%,充分说明全天时星敏感器光学响应波段选择对星敏感器实际恒星探测能力影响十分显著。以星敏感器对R波段0等星探测信噪比为参考基准,分别计算采用不同光学响应波段探测恒星数量相对比例,如图4所示。
整体来看,采用H波段时全天时星敏感器实际恒星探测能力最佳,同等硬件条件下,探测恒星数量约为采用R、I、J波段探测恒星数量的17、10、2倍。随着探测信噪比提升,H波段优势愈加明显,最高可达同等条件下R、I、J波段的20、12.2、2.2倍。

图 4 采用不同光学响应波段探测恒星数量比例
Figure 4. Proportion of detected stars in different optical responding bands
取星敏感器对R波段0等星探测信噪比为10、50、100时,绘制不同光学响应波段探测的恒星天球分布情况,见图5。由此可知,在同等硬件条件下,采用H波段为全天时星敏感器光学响应波段,全天球各区域可探测的恒星密度明显高于R、I、J波段。

图 5 采用不同光学响应波段探测恒星分布图
Figure 5. Distribution map of stars detected using different optical response bands
对于星敏感器而言,视场内至少需同时探测到3颗以上恒星才能实现定姿。取星敏感器视场为5°×5°,随机进行3000次蒙特卡洛仿真实验,计算采用不同光学响应波段视场内可探测3颗以上恒星概率如表8所示。
表 8 采用不同光学响应波段星敏感器探测3颗以上恒星概率
Table 8. Probability of detecting three or more stars using star sensors with different optical response bands
Band SNR of star sensor with R band 0 magnitude star 10 20 30 40 50 60 70 80 90 100 R 0.00% 0.05% 2.00% 2.85% 3.40% 4.80% 5.09% 5.49% 5.94% 6.09% I 0.00% 0.50% 4.90% 9.84% 15.28% 22.68% 28.07% 35.81% 42.16% 48.30% J 0.93% 4.10% 12.94% 23.08% 33.32% 44.93% 56.57% 64.81% 71.71% 77.28% H 4.04% 20.68% 40.36% 60.44% 76.65% 87.09% 92.93% 96.63% 98.17% 99.23% 由表8可知,采用H波段全天时星敏感器定姿成功率明显优于R、I、J波段,当星敏感器对R波段0等星探测信噪比达到100时,采用H波段即可实现99.23%视场内探测到3颗以上恒星,而同等条件下R、I、J波段分别只有6.09%、48.30%、77.28%。
-
为验证采用不同光学响应波段全天时星敏感器恒星探测能力,采用sky-watcher 150 mm口径光学镜筒,搭配QHY990短波红外InGaAs相机(相机参数见表3)进行白昼恒星观测。系统采用滤镜轮进行滤光片切换,使用电动云台进行寻星。该白昼观星系统具有大口径观星效果好、滤光片切换迅速、自动寻跟恒星等特点,对开展全天时星敏感器各参量设计分析十分有利,具体系统搭建如图6所示。

图 6 白昼红外观星系统
Figure 6. Daytime infrared star observation system
由于同星等不同波段恒星统计数量为固定值,而不同星等星图信噪比可利用相应波段0等星信噪比进行推算。因此通过计算不同波段0等星信噪比关系即可验证采用不同光学响应波段全天时星敏感器实际恒星探测能力。为此,实验通过观测一颗恒星不同波段星图,依据恒星在不同波段的星等计算对应波段0等星探测信噪比。
-
2022年12月12日,地点郑州某楼顶,分别采用中心波长为760、1240、1650 nm,带宽为100 nm滤光片,拍摄北极星(Polaris)、天津一(Sadr)红外星图。13时拍摄Polaris星图,曝光时间统一为30 ms,如图7所示,其中图(a)~(c)分别为I、J、H波段星图。16时拍摄Sadr星图,曝光时间统一为90 ms,如图8所示,其中图(a)~(c)分别为I、J、H波段星图。

图 7 白昼北极星红外星图
Figure 7. Daytime infrared image of Polaris

图 8 白昼天津一红外星图
Figure 8. Daytime infrared image of Sadr
由图7、8可见,白昼观星系统测星效果好,信噪比高,对验证光学波段信噪比模型十分有利。信噪比公式为:
$$ SNR = \frac{{{\mu _{star}} - {\mu _{back}}}}{\delta } $$ (16) 式中:$ SNR $为星图信噪比;$ {\;\mu _{star}} $为恒星灰度均值;$ {\mu _{back}} $为天空背景灰度均值;$ \delta $为星图灰度值标准差。计算得到各波段星图信噪比,见表9。
表 9 各光学波段测星信噪比
Table 9. Star SNR in different optical response bands
Name Item I J H Polaris Magnitude 1.22 0.795 0.46 SNR 4.2 6.7 8.5 Sadr Magnitude 1.4 1.11 0.83 SNR 12.1 19.3 22.4 利用表9中Polaris、Sadr数据,分别推算出I、J、H波段0等星信噪比为1∶1.08∶1.01和1∶1.22∶1.09,与3节理论推导的1.01∶1.16∶1.04总体较为接近,验证了各波段0等星探测信噪比模型的有效性。分析0等星信噪比模型存在误差原因为:1) 白昼恒星对比度低,相机调焦对准困难导致星点成像大小不一;2) 不同波段统一曝光时间易造成部分像元过饱和;3) 模型中天空背景亮度、大气透过率仿真值与与地面实际值并不完全吻合。
在Polaris、Sadr推算的I、J、H波段0等星信噪比基础上,结合不同波段恒星分布情况,分别计算全天时星敏感器采用不同光学响应波段测星能力相对比例关系,如图9所示。图9中蓝色长虚线自上而下表示基于北极星星图推算的H、J、I波段全天时星敏感器恒星探测能力相对比例关系;红色短虚线自上而下表示基于天津一星图推算的H、J、I波段全天时星敏感器恒星探测能力相对比例关系,绿色实线自上而下表示理论推算的H、J、I波段全天时星敏感器恒星探测能力相对比例关系。

图 9 不同光学波段实际恒星探测能力对比
Figure 9. Comparison of actual star detection ability in different optical wavebands
由图9可知,虽然北极星星图推算的H波段恒星探测能力优于理论推导值,而天津一星图推算的H波段恒星探测能力弱于理论推导值,但综合来看采用H波段全天时星敏感器测星能力明显优于其他波段,约是同等条件下R、I、J波段的17、10、2倍,进一步验证了理论的正确性。
-
为了减小全天时星敏感器成像色差,提升全天时星敏感器白昼测星信噪比,对全天时星敏感器各光学响应波段测星能力进行了对比分析。通过对比分析得出,采用不同光学响应波段对全天时星敏感器实际测星能力影响显著;在同等硬件条件下,全天时星敏感器采用H波段恒星探测能力最为突出,探测恒星数目约为R、I、J波段的17、10、2倍,定姿成功率也有明显优势。搭建了白昼观星平台,实验计算了采用不同光学波段平台实际测星能力,实验结果显示,采用H波段全天时星敏感器测星能力明显强于其他光学波段,是全天时星敏感器最优光学响应波段。
合理设计全天时星敏感器光学响应波段,可有效提升星敏感器白昼测星效果,而曝光时间、响应带宽也同样影响着红外星图的整体成像质量。因此,在解决全天时星敏感器波段选择的基础上,还需围绕全天时星敏感器光学响应带宽与曝光时间设计优化进行综合研究。
Optimal design and experimental verification of optical response band of all-time star sensor
-
摘要: 随着红外传感器技术的飞速发展,全天时星敏感器白昼观星效果明显提升,传统宽光学响应带宽设计引起的成像色差、信噪比下降,逐步成为限制其精度进一步提升的瓶颈之一。根据近红外波段大气窗口特性,选择合适波段作为全天时星敏感器光学响应波段可有效缓解此类问题。为此,首先建立了全天时星敏感器不同光学响应波段0等星信噪比模型,在此基础上,利用modtran软件仿真计算相关波段大气参数,结合不同波段恒星分布密度,分析了全天时星敏感器采用不同光学响应波段探测恒星数量、分布密度及定姿成功率,并利用白昼测星平台开展了验证试验。结果表明:同等硬件条件下H波段为全天时星敏感器最优光学响应波段,整体恒星探测能力约为R、I、J波段的17倍、10倍和2倍,定姿成功率也有明显优势。Abstract:
Objective For all-time star sensors, traditional wide optical response bandwidth design can easily cause imaging chromatic aberration, which is not conducive to star detection and extraction; Some bands have low atmospheric transmittance, and excessively wide response bandwidth can easily reduce the signal-to-noise ratio of star detection. With the rapid development of infrared sensor technology, these issues have gradually become important bottlenecks that limit the further improvement of the accuracy of all-time star sensors. Due to the significant spectral correlation between atmospheric background radiation and transmittance, there are significant differences in the number of observable stars in different bands, resulting in significant differences in the actual star measurement capabilities of all-time star sensors using different optical sensitive bands. Therefore, according to the characteristics of the near-infrared band atmospheric window, it is of great significance to select an appropriate optical response band to improve the star detection capability of the all-time star sensor. Methods Based on the definition of 0 magnitude star radiation flux in different optical response bands, and taking into account factors such as atmospheric background radiation and transmittance in different bands, the signal-to-noise ratio relationship of 0 magnitude star corresponding to different optical response bands under the same hardware conditions is derived (Tab.5); Using Modtran software to simulate and calculate atmospheric parameters in relevant bands, and combining with the statistical number of stars in different bands, the quantitative analysis adopts the relationship between the number of star detections in different optical response bands (Fig.3, Tab.7). A daytime star observation platform is built and the model of the relationship between the number of star detections is verified by taking pictures of Polaris and Sadr. On this basis, based on the distribution of stars in different bands of the same magnitude (Fig.5), combined with the attitude determination conditions of the star sensor, Monte Carlo simulation was used to calculate the actual success rate of the star sensor's attitude determination using different optical response bands. Results and Discussions Under the same hardware conditions, the star detection ability of the all-time star sensor using the H-band as the optical response band is about 17 times, 10 times, and 2 times that of the R, I, and J bands (Fig.4). The correctness of this conclusion was verified through actual observations of one or two stars in North Star and Sadr (Fig.9). The field of view of the star sensor is taken as 5°×5°, when the signal-to-noise ratio of the star sensor to R-band 0 magnitude stars reaches 100. Using the H-band can achieve the detection of more than 3 stars in a field of view of 99.23%, while under the same conditions, the R-band, I-band, and J-band are only 6.09%, 48.30%, and 77.28%, respectively (Tab.8). Conclusions In order to reduce the chromatic aberration of the all-time star sensor imaging and improve the daytime star measurement signal-to-noise ratio of the all-time star sensor, a comparative analysis was conducted on the star measurement capabilities of the all-time star sensor in various optical response bands. Through comparative analysis, it is found that the use of different optical response bands has a significant impact on the actual star measurement ability of all-time star sensors; Under the same hardware conditions, the all-time star sensor has the most outstanding ability to detect stars in the H-band, with a detection number of stars about 17 times, 10 times, and 2 times that of the R, I, and J bands. The success rate of attitude determination also has a significant advantage. A daytime star observation platform was built, and the actual star measurement capabilities using different optical band platforms were experimentally calculated. The experimental results showed that the H-band all-time star sensor has significantly stronger star measurement capabilities than other optical bands, making it the optimal optical response band for all-time star sensors. -
Key words:
- sar sensor /
- background radiation /
- atmospheric transmissivity /
- magnitude /
- responding band
-
图 3 采用不同光学响应波段探测恒星数量
Figure 3. Detecting number of stars with different optical responding bands
图 4 采用不同光学响应波段探测恒星数量比例
Figure 4. Proportion of detected stars in different optical responding bands
图 5 采用不同光学响应波段探测恒星分布图
Figure 5. Distribution map of stars detected using different optical response bands
图 9 不同光学波段实际恒星探测能力对比
Figure 9. Comparison of actual star detection ability in different optical wavebands
Starlist Filter ${\lambda _{eff} }/{\text{μm}}$ Bandwidth $\Delta \lambda $$/{\text{μm}}$ $ {F_\lambda } $$/ W \cdot { {\rm{cm} }^{ - 2} } \cdot {\text{μ} {\rm{m} }^{ - 1} }$ In-band$/{\rm{W} } \cdot { {\rm{cm} }^{ - 2} }$ USNO R 0.620 0.125 2.42E-12 3.03E-13 I 0.767 0.148 1.26E-12 1.86E-13 2 MASS J 1.235 0.162 3.129E-13 5.082E-14 H 1.662 0.251 1.133E-13 2.843E-14 K 2.159 0.262 4.283E-14 1.122E-14  下载: 导出CSV
表 2 不同波段大气参数均值
Table 2. Mean values of atmospheric parameters in different bands
Band R I J H Bandwidth/μm 0.6-0.7 0.75-0.85 1.2-1.3 1.6-1.7 Transmissivity 0.82 0.90 0.96 0.97 Radiance/${\rm{W} } \cdot { {\rm{cm} }^{ - 2} } \cdot{ {\rm{sr} }^{ - 1} } \cdot \text{μ}{\rm{m} } {^{ - 1} }$ 8.68E-04 3.34E-04 3.69E-05 8.01E-06
下载: 导出CSV
表 3 典型红外传感器参数
Table 3. Typical IR sensor parameters
Name Model Total
pixelsDepth Full well Dark current Readout
noiseQHY990 CMOS 1392×1052 12 bit A/D 120 ke ≤227 e−/pixel ≤150 e− ZephIR™ CCD 640×512 14 bit A/D 110 ke ≤125 e−/pixel ≤75 e−
下载: 导出CSV
表 4 典型星敏感器工作条件
Table 4. Typical star sensor operating conditions
Pixel size/μm Focal length/mm $ \;\rho $ Band $ {\tau _0}(\lambda ) $ $ {I_b} $$/{\rm{W} } \cdot { {\rm{cm} }^{ - 2} }\cdot { {\rm{sr} }^{ - 1} }\cdot \text{μ} {\rm{m} } {^{ - 1} }$ $ F(\lambda ) $ $/ W \cdot { {\rm{cm} }^{ - 2} }\cdot \text{μ} { {\rm{m} }^{ - 1} }$ 5 100 0.25 R 0.81 8.68E-04 2.42E-12 0.25 I 0.89 3.34E-04 1.26E-12 0.25 J 0.85 3.69E-05 3.129E-13 0.25 H 0.95 8.01E-06 1.133E-13
下载: 导出CSV
表 5 各波段0等星信噪比比例(SNRR100)
Table 5. SNR ratio of 0 magnitude stars in each band (SNRR100)
Band R I J H Width$/{\text{μm} }$ 0.6-0.7 0.75-0.85 1.2-1.3 1.6-1.7 Ratio 1 1.01 1.16 1.04
下载: 导出CSV
表 6 R、I、J、H波段恒星统计
Table 6. Star statistics in R, I, J, and H bands
Magnitude 0 1 2 3 4 5 6 R band 12 26 98 280 870 2618 8385 I band 18 36 126 439 1422 4472 14730 J band 66 177 688 2182 6273 17894 57975 H band 171 569 1825 5527 19594 45210 130851
下载: 导出CSV
表 7 不同光学响应波段探测恒星数量统计
Table 7. Statistics of the number of detected stars in different optical response bands
SNR 10 20 30 40 50 60 70 80 90 100 Band R 26 49 75 100 130 172 205 230 275 300 I 27 63 102 155 194 252 315 382 441 495 J 90 294 564 873 1172 1441 1756 2047 2351 2650 H 297 828 1372 1984 2620 3312 3974 4652 5359 6080
下载: 导出CSV
表 8 采用不同光学响应波段星敏感器探测3颗以上恒星概率
Table 8. Probability of detecting three or more stars using star sensors with different optical response bands
Band SNR of star sensor with R band 0 magnitude star 10 20 30 40 50 60 70 80 90 100 R 0.00% 0.05% 2.00% 2.85% 3.40% 4.80% 5.09% 5.49% 5.94% 6.09% I 0.00% 0.50% 4.90% 9.84% 15.28% 22.68% 28.07% 35.81% 42.16% 48.30% J 0.93% 4.10% 12.94% 23.08% 33.32% 44.93% 56.57% 64.81% 71.71% 77.28% H 4.04% 20.68% 40.36% 60.44% 76.65% 87.09% 92.93% 96.63% 98.17% 99.23%
下载: 导出CSV
表 9 各光学波段测星信噪比
Table 9. Star SNR in different optical response bands
Name Item I J H Polaris Magnitude 1.22 0.795 0.46 SNR 4.2 6.7 8.5 Sadr Magnitude 1.4 1.11 0.83 SNR 12.1 19.3 22.4
下载: 导出CSV
-
[1] Zhang Kaisheng, Su Xiuqin, Ye Zhilong. Large relative aperture optical system design for all day star sensor [J]. Acta Photonica Sinica, 2022, 51(11): 1111003. (in Chinese) [2] 王文杰, 张广军, 魏新国. 全天时星敏感器的建模分析与实验验证[J]. 红外与激光工程, 2019, 48(11): 142–148 Wang Wenjie, Zhang Guangjun, Wei Xinguo. Modeling analysis and experimental verification of all- time star sensor [J]. Infrared and Laser Engineering, 2019, 48(11): 1113001. (in Chinese) [3] 张辉, 周向东, 汪新梅, 等. 近地空间全天时星敏感器技术现状及发展综述[J]. 航空学报, 2020, 41(08): 19–31 Zhang Hui, Zhou Xiangdong, Wang Xinmei, et al. Current status and development of all-sky time-star sensor in near-earth space [J]. Acta Aeronautica et Astronautica Sinica, 2020, 41(8): 19-31. (in Chinese) [4] 张前程, 钟胜, 吕劲松, 等. 大视场全天时星敏感器光学系统设计[J]. 红外与激光工程, 2023, 52(3): 234–242 Zhang Qiancheng, Zhong Sheng, Lv Jinsong, et al. Design of optical system for large-field all-sky time star sensor [J]. Infrared and Laser Engineering, 2023, 52(3): 20220583. (in Chinese) [5] González-fernández C, Hodgkin S T, Irwin M J, et al. The VISTA ZYJHKs photometric system: Calibration from 2 MASS [J]. Monthly Notices of the Royal Astronomical Society, 2018, 474(4): 5459-5478. doi: 10.1093/mnras/stx3073 [6] 胡伟达, 李庆, 陈效双, 等. 具有变革性特征的红外光电探测器[J]. 物理学报, 2019, 68(12): 7–41 doi: 10.7498/aps.68.20190281 Hu Weida, Li Qing, Chen Xiaoshuang, et al. Recent progress on advanced infrared photodetectors [J]. Acta Physica Sinica, 2019, 68(12): 20190281. (in Chinese) doi: 10.7498/aps.68.20190281 [7] 李雪, 龚海梅, 邵秀梅, 等. 短波红外InGaAs焦平面研究进展[J]. 红外与毫米波学报, 2022, 41(01): 129–138 doi: 10.11972/j.issn.1001-9014.2022.01.009 Li Xue, Gong Haimei, Shao Xiumei, et al. Recent advances in short wavelength infrared InGaAs focal plane arrays [J]. Journal of Infrared and Millimeter Waves, 2022, 41(1): 129-138. (in Chinese) doi: 10.11972/j.issn.1001-9014.2022.01.009 [8] Belenkii M. Daytime stellar imager: USA, 7349804[P]. 2008-03-25. [9] 于春蕾, 龚海梅, 李雪, 等. 2560×2048元短波红外InGaAs焦平面探测器(特邀)[J]. 红外与激光工程, 2022, 51(03): 11–20 Yu Chunlei, Gong Haimei, Li Xue, et al. 2 560×2 048 yuan short-wave infrared InGaAs focal plane detector (invited) [J]. Infrared and Laser Engineering, 2022, 51(3): 20210941. (in Chinese) [10] Rex M, Chapin E, Devlin M J, et al. BLAST autonomous daytime star cameras [C]//Ground-based and Airborne Instrumentation for Astronomy, SPIE, 2006, 6269: 1093–1100. [11] Zhu Hailong, Bin Liang, Tao Zhang, et al. Designing considerations for airborne star tracker during daytime [C]//The 27th Chinese Control and Decision Conference (2015 CCDC). Qingdao, China, IEEE, 2015: 4279–4283. [12] Wang Wenjie. Optical parameters optimization for all-time star sensor [J]. Sensors, 2019, 19(13): 2960. doi: 10.1117/1.1501566 [13] Hughes D W. The introduction of absolute magnitude (1902-1922) [J]. Journal of Astronomical History and Heritage, 2006, 9: 173-179. doi: 10.3724/SP.J.1440-2807.2006.02.06 [14] Schulman E, Caroline V C. Misconceptions about astronomical magnitudes [J]. American Journal of Physics, 1997, 65(10): 1003-1007. doi: 10.1119/1.18714 [15] Cochran A L. Spectrophotometry with a self-scanned silicon photodiode array-II-secondary standard stars [J]. The Astrophysical Journal Supplement Series, 1981, 45: 83-96. doi: 10.1086/190708 [16] Bessell M S. Photometric systems [J]. International Astronomical Union Colloquium, 1993, 136: 22-39. doi: 10.1017/S025292110000734X [17] Casagrande L, VandenBerg D A. Synthetic stellar photometry – II testing the bolometric flux scale and tables of bolometric corrections for the Hipparcos/Tycho, Pan-STARRS1, SkyMapper, and JWST systems [J]. Monthly Notices of the Royal Astronomical Society, 2018, 475(4): 5023-5040. doi: 10.1093/mnras/sty149 [18] Andrew W, Kaspar von Braun. Revised filter profiles and zero points for broadband photometry [J]. Publications of the Astronomical Society of the Pacific, 2015, 127(948): 102-125. doi: 10.1086/680012 [19] Bessell M S. The Hipparcos and Tycho photometric system passbands [J]. Publications of the Astronomical Society of the Pacific, IOP Publishing, 2000, 112(773): 961. doi: 10.1086/316598 [20] Bilir S, Ak S, Karaali S, et al. Transformations between 2 MASS, SDSS and BVRI photometric systems: Bridging the near-infrared and optical [J]. Monthly Notices of the Royal Astronomical Society, 2008, 384(3): 1178-1188. doi: 10.1111/j.1365-2966.2007.12783.x [21] Maíz Apellániz J. A uniform set of optical/NIR photometric zero points to be used with CHORIZOS[C]//The Future of Photometric, Spectrophotometric and Polarimetric Standardization, 2007, 364: 227. [22] Bessell M, Murphy S. Spectrophotometric libraries, revised photonic passbands, and zero points for UBVRI, hipparcos, and tycho photometry [J]. Publications of the Astronomical Society of the Pacific, 2012, 124(912): 140-157. doi: 10.1086/664083 [23] Wang Ruwen, Xie Pinhua, Xu Jin, et al. Retrieve of water vapor column density in atmosphere based on near infrared differential optical absorption spectroscopy [J]. Acta Optica Sinica, 2019, 39(2): 0201001. (in Chinese) doi: 10.3788/AOS201939.0201001 [24] Rogalski A. Next decade in infrared detectors[C]//Electro-Optical and Infrared Systems: Technology and Applications XIV, SPIE, 2017, 10433: 128-152. [25] Wenjie Wang, Xinguo Wei, Jian Li, et al. Noise suppression algorithm of short-wave infrared star image for daytime star sensor [J]. Infrared Physics & Technology, 2017, 85: 382-394. [26] Zheng Xunjiang, Huang Yongqin, Mao Xiaonan, et al. Research status and key technologies of all-day star sensor [J]. Journal of Physics: Conference Series, 2020, 1510(1): 012027. doi: 10.1088/1742-6596/1510/1/012027 [27] Nicholas A, Truesdale, Dinkel K J, et al. DayStar: Modeling and test results of a balloon-borne daytime star tracker [C]//2013 IEEE Aerospace Conference, IEEE, 2013: 1–12. [28] Tola Engin. Black-body SNR formulation of astronomical camera systems [J]. IEEE Sensors Journal, 2015, 15(9): 4941-4949. doi: 10.1109/JSEN.2015.2427911 -

 点击查看大图

计量
- 文章访问数: 77
- HTML全文浏览量: 43
- PDF下载量: 32
- 被引次数: 0

