


-
以青藏高原为核心的“第三极”是除南极和北极以外冰雪储量最大的地区,被称为“亚洲水塔”,青藏高原冰川是我国重要的淡水储备资源[1-2]。在全球气候变暖的背景下,青藏高原冰川普遍处于退缩状态[3],不仅会影响水资源储备,还会导致冰川灾害事件的频繁发生,严重威胁人民生命财产安全和生活质量[4]。因此,对青藏高原冰川进行变化监测非常必要。
数字高程模型是开展冰川研究的重要基础数据。青藏高原地区现有的开源DEM主要包括30 m 格网的SRTM[5](Shuttle Radar Topography Mission)、30 m格网的ALOS (Advanced Land Observation Satellite) AW3D30[6](ALOS World 3D-30 m)、90 m格网的TanDEM-X DEM[7]以及8 m格网的HMA (High Mountain Asia) DEM[8]。国内外学者基于不同源DEM利用多时相差分监测冰川高程变化,并取得了一些研究成果。其中,王祎婷等[9]利用1976年航片测绘1∶25万地形图DEM及2000年的SRTM数据差分得到该时间段内那木纳尼峰的高程变化,结合面积等信息计算得到该地区冰川体积减少了3.06 km3。黄心茹[10]结合SRTM、AW3D30、TanDEM以及KH-4 DEM差分得到嘎贡山1968—2013年间冰川表面高程变化为−26.89 m。万君竹[11]结合1970年航空摄影测量成图的地形图、SRTM、HMA数据得到1970—2016年祁连山区各冰川表面变化;姬鑫慧等[12]基于2000年SRTM与2014年TerraSAR/TanDEM-X雷达数据,采用差分干涉测量方法,研究岗日嘎布山区东南段冰面高程变化及冰储量变化特征,得出研究区2000—2014年冰面高程年均变化为(−0.86±0.13) m·a−1。Berthier等[13]和Kääb[14]分别用 SPOT-5立体像对和ASTER立体像对生成冰川表面 DEM数据以研究其高程变化。Zong等[15]利用SRTM及ICESat/GLAS计算2000—2009年纳木那尼冰面高程的变化平均减薄速率为(0.63±0.32) m·a−1。但是,面向青藏高原地区的复杂地形,几十米格网的开源DEM数据集对冰川细节的描述存在不足,不能很好的反映冰川特征,不适合山地冰川及小冰帽的高程变化监测。8 m格网的HMA DEM产品覆盖率较低且存在较多空洞,在青藏高原地区应用受限。
近年来,国内相关学者基于高分辨率立体影像在山地及冰川区域提取DEM进行了相关探讨。鄂栋臣等[16]利用亚米级分辨率的IKONOS影像自带的RPC (Rational Polynomial Coefficients)模型对南极菲尔德斯半岛DEM进行提取,其高程精度为22 m,为提高其精度引入中国第23次南极考察队采集的控制点对RPC模型进行修正,高程精度提升至5 m。张鑫等[17]针对KH-9数据,以普若岗日冰川区和雅弄冰川区为例,经过影像畸变校正、拼接、对比度增强、DEM提取得到KH-9 DEM,结果表明在普若岗日冰川区域精度为9.23 m,雅弄冰川区域精度为13.86 m。高分辨率的卫星遥感立体影像在山地冰川区域DEM的建立过程中,常存在控制数据获取困难,人员难以到达的问题,急需一种来源稳定、可靠性高的参考数据。
随着国产立体测图卫星的迅猛发展,资源三号、高分七号相继发射,分别实现了1∶5万和1∶1万比例尺高精度立体测图,特别是2019年成功发射的高分七号搭载了亚米级分辨率的双线阵立体相机和高精度激光测高仪,在DEM产品格网大小和精度方面具有独特优势[18-19]。针对开源DEM产品格网精细程度不够高、不同源DEM产品精度一致性不够好、微波雷达对冰川表面积雪存在一定穿透误差等问题,基于国产立体测图卫星自主可控地生产青藏高原冰川区更高精度、更精细格网的DEM成为值得探讨和应用的方向。
笔者所在团队的张帅台[20]利用高精度数字正射影像及高分七号激光点,对国产高分七号卫星立体影像分别进行平面及高程控制,经优化后的高分七号DEM在山地区域高程精度初步验证优于1 m,为开展冰川区域高精度三维制图和高程变化监测提供了一种新思路,但相关方法和精度还需要深入分析。
-
资源三号卫星是面向1∶5万立体测图的民用高分辨率立体测绘卫星,搭载了4台线阵推扫式相机,包括一台地面分辨率2.1 m的正视全色TDI CCD相机、两台地面分辨率为3.5 m的前后视全色TDI CCD相机、一台地面分辨率5.8 m的正视多光谱相机,可用于生产1∶5万测绘产品[21-22]。目前,资源三号共有三颗卫星在轨运行,其中01星、02星和03星分别于2012年、2016年和2020年发射,02星和03星上的前后视相机分辨率从3.5 m提高到2.7 m,并装备了激光测高仪。三颗卫星组网运行可实现青藏高原地区2 m立体影像每年至少1次全覆盖、局部区域半年甚至季度覆盖。
我国首颗民用亚米级光学传输型立体测绘卫星高分七号于2019年11月3日在太原卫星发射中心成功发射,运行于太阳同步轨道,搭载的两线阵立体相机可有效获取20 km宽、优于0.8 m分辨率的全色立体影像和3.2 m分辨率的多光谱影像以及高精度激光测高数据,实现1∶1万比例尺卫星立体测图[23]。国产高分七号卫星亚米级立体影像在青藏高原地区可实现三年全覆盖、局部区域年度覆盖。
-
30 m SRTM是美国航空航天局(NASA)和国防部国家地理信息局(NGA)联合开展的航天飞机雷达地形测绘任务,包括全球北纬60°至南纬56°之间的区域[24]。AW3D30于2015年公开发布,是日本在2006年发射的一颗地球观测卫星ALOS上搭载的全色遥感立体测绘仪PRISM而生产的全球数字表面模型数据集[25],高程精度优于5 m[26]。TanDEM 由2010年6月发射的TanDEM-X与TerraSAR-X卫星编队飞行,通过构建双站SAR干涉模式形成全球数字高程产品[7]。高亚洲地区8 m分辨率HMA DEM由美国国家冰雪数据中心发布,数据源自0.5 m分辨率的GeoEye-1、WorldView-1/2/3和QuickBird-2数字地球卫星图像[8]。上述各种DEM的基本情况如表1所示。
表 1 青藏高原地区开源数字高程模型产品基本参数
Table 1. Basic parameters of open-source digital elevation model products on the Qinghai-Tibet Plateau
Product name Release year Coverage of the
Qinghai-Tibet PlateauGrid
size/mHeight datum Elevation accuracy/m SRTM 2003 Void-free 30 EGM96 16 AW3D30 2016 Void-free 30 EGM96 5 TanDEM 2016 Void-free 90 WGS84 10 HMA 2017 Covering sparse 8 WGS84 5 -
ICESat-2/ATLAS采用多波束微脉冲光子技术,以10 kHz的高重频获得高精度三维信息,在地面上的激光足印直径约为17 m,激光光斑沿轨距离仅有0.7 m。 ATLAS数据共分为4级21类产品,文中选择与立体影像采集时间相近的陆地冰表面高度产品ATL06作为冰川区验证参考数据,同时选择陆地高程产品ATL08作为非冰川区的高程参考数据[27-28]。地形平坦时,ATL06在陆地冰川区域的测量精度优于0.09 m[29],ATL08在裸地区域的高程精度优于0.12 m[30],其高程精度较高可以作为该研究验证数据。
-
文中共选取了两个试验区,其中第一个试验区是位于唐古拉山脉的岗钦冰川,地理位置介于90°36′~ 90°48′E,33°53′~33°59′N之间,东西长约17 km,南北宽约11 km,面积约70 km2,属于可可西里盆地和长江流域,平均海拔在5000 m以上,发育有多种类型的冰川。岗钦冰川位于沱沱河西侧,是沱沱河的主要水源补给冰川之一,沱沱河作为长江源的西源对长江流域的水资源补给有着不可忽视的作用[31]。
第二个试验区是位于青藏高原腹地的普若岗日冰川,地处羌塘西北部的双湖特别区东北部90 km,属国家级羌塘保护区的核心区,地理位置介于89°20′~89°50′E,33°44′~34°04′N,最高海拔为6482 m,冰舌最低处海拔约为5350 m,落差高达1132 m。普若岗日冰川总面积约为422.58 km2,被确认为世界上除南极、北极以外最大的冰川,是青藏高原冰川研究的热点区域[32]。
-
立体影像生产DEM产品时,在传统方法中需要加外业控制点,由于研究区域处于高山冰川地带,人迹罕至,传统的外业控制点采集基本不可行。高分七号卫星激光测高数据产品的特点是高程精度高,经过在轨检校平坦地形处,高程精度可以达到0.1 m[33],与实地采集控制点的精度相当,可以作为高程控制点使用,提高立体影像生产DEM的精度。为了评价不同DEM的精度,需对高程基准进行统一,并建立相关的精度评价指标。
-
文中采用高分七号激光测高数据作为控制源,辅助立体影像区域网平差[34-35],优化立体影像定向参数,提升其立体测图精度,再经影像密集匹配提取高精度的DEM。
-
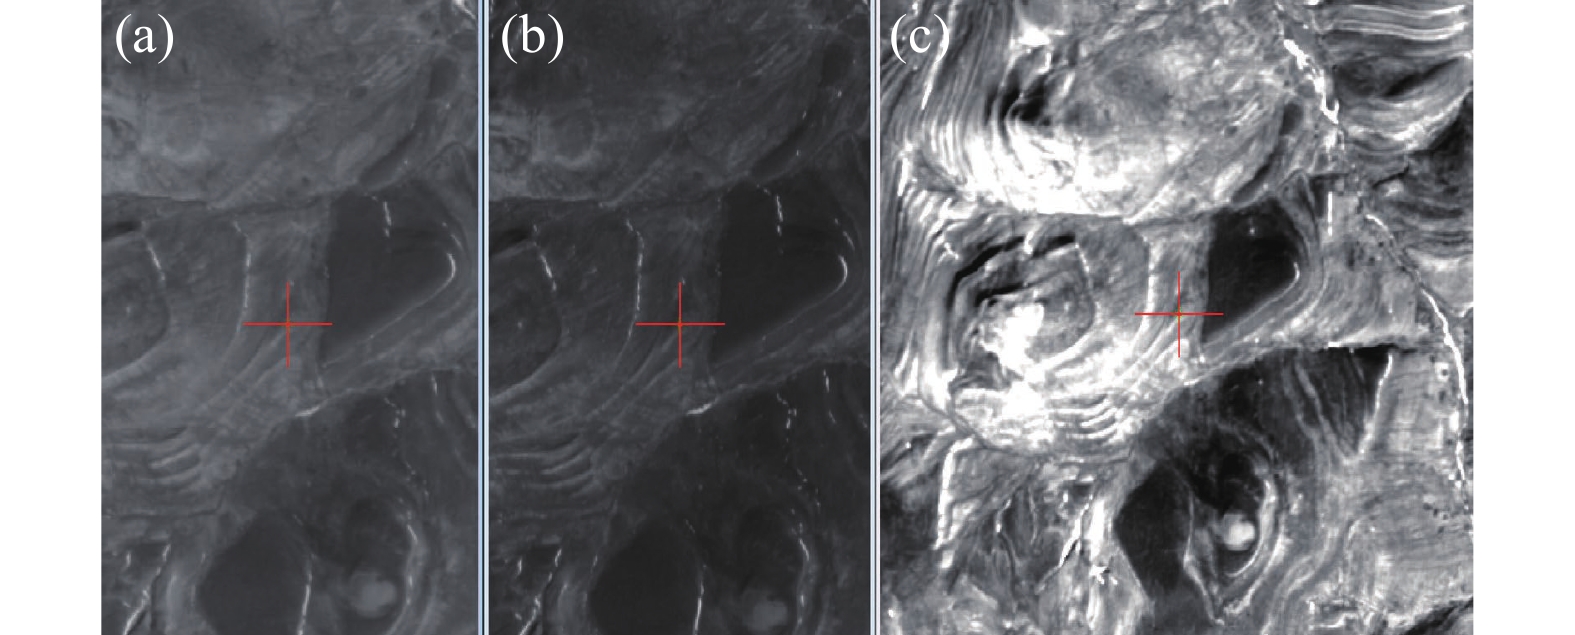
将高分七号激光测高标准产品SLA03 (Satellite Laser Altimetry standard products, SLA)数据作为立体影像的控制源,将高分七号激光测高产品中的足印影像与立体影像通过相位相关的匹配算法[36],确定出激光点在立体影像上的同名点。图1为激光足印影像及同区域立体影像。

图 1 同区域立体影像及激光足印影像。(a)、(b)立体影像;(c)激光足印影像
Figure 1. Stereoscopic images and laser footprint images of the same area. (a), (b) Stereoscopic images; (c) Laser footprint image
高分七号激光测高数据处理标准化产品时,引入了表示质量控制的字段ECP_Flag (Elevation control point flag)。综合考虑该研究区均位于山地冰川区,地形较为复杂,所以高分七号激光控制点的选取非常重要。首先,以高分七号卫星激光测高标准产品SLA03数据中的ECP_Flag字段标记为准,选择标记为1和2的激光点。考虑到冰川高程变化,如激光数据与立体影像采集时间不一致,则剔除冰川区域激光落点,保留非冰川区的激光点作为控制点。同时,在平差过程中以1.0 m为阈值剔除误差较大的激光点,以确保激光控制点的质量和可用性。
-
发挥激光测高数据高程精度高的优势,采用高分七号激光测高数据辅助立体影像区域网平差,改善立体影像几何成像模型[37-38]。有理函数模型采用数学关系式来建立影像上像点坐标与对应地面点物方坐标之间的关系[39]。可以不考虑成像过程中的各参数影响,也不需要考虑传感器的实际特性,其形式简单,替代精度高,已成为当前卫星影像通用几何成像模型,其一般表达式为[40]:
$$ \left\{ \begin{gathered} r = \frac{{{p_1}(X,Y,Z)}}{{{p_2}(X,Y,Z)}} \\ c = \frac{{{p_3}(X,Y,Z)}}{{{p_4}(X,Y,Z)}} \\ \end{gathered} \right. $$ (1) 式中:$(X,Y,Z)$为正则化的地面点坐标;$r、c$为正则化的影像坐标;$p$为一般多项式,一般取3阶形式,因此存在80个有理多项式系数。
通过激光点与立体影像匹配得到激光点在立体影像上的落点位置后,利用有理多项式建立影像像方与其对应物方之间的数学映射关系。根据以往学者的研究,像方补偿的方式消除系统性误差的能力更强[41]。因此,文中采用激光点与立体影像构建仿射变换模型,实现对立体影像的像方补偿,更新立体影像RPC信息。仿射变化模型为:
$$ \left\{ \begin{gathered} \Delta r = {e_0} + {e_1}r + {e_2}c \\ \Delta c = {f_0} + {f_1}r + {f_2}c \\ \end{gathered} \right. $$ (2) 式中:$\Delta r、\Delta c$为像点坐标$r、c$的像方改正数;$[ {e_0}\;{e_1}\;{e_2}\; {f_0}\;{f_1}\;{f_2}\; ]$为仿射变换模型参数。根据公式(2),可以对每个激光点列如下线性方程,根据最小二乘平差求解影像面的仿射变换参数,完成利用激光点提高RPC模型的精度。误差方程为:
$$ \begin{array}{l}{v}_{R}=\left[\dfrac{\partial R}{\partial {e}_{0}}\cdot\Delta {e}_{0}+\dfrac{\partial R}{\partial {e}_{1}}\cdot\Delta {e}_{1}+\dfrac{\partial R}{\partial {e}_{2}}\cdot\Delta {e}_{2}+\dfrac{\partial R}{\partial {f}_{0}}\cdot\Delta {f}_{0}+\dfrac{\partial R}{\partial {f}_{1}}\cdot\Delta {f}_{1}+\dfrac{\partial R}{\partial {f}_{2}}\cdot\Delta {f}_{2}\right]+{F}_{R0}\\ {v}_{C}=\left[\dfrac{\partial C}{\partial {e}_{0}}\cdot\Delta {e}_{0}+\dfrac{\partial C}{\partial {e}_{1}}\cdot\Delta {e}_{1}+\dfrac{\partial C}{\partial {e}_{2}}\cdot\Delta {e}_{2}+\dfrac{\partial C}{\partial {f}_{0}}\cdot\Delta {f}_{0}+\dfrac{\partial C}{\partial {f}_{1}}\cdot\Delta {f}_{1}+\dfrac{\partial C}{\partial {f}_{2}}\cdot\Delta {f}_{2}\right]+{F}_{C0}\end{array} $$ (3) 由公式(3)计算出仿射变换参数$({e_0}\;{e_1}\;{e_2}\;{f_0}\;{f_1}\;{f_2})$。可由RPC模型与仿射变换模型联立构建区域网平差模型。区域网平差模型为:
$$ \left\{ \begin{gathered} {F_{11}} = ({r_1} + {e_{01}} + {e_{11}} \cdot {c_1} + {e_{21}} \cdot {r_1}) \cdot {P_{11}}(X,Y,Z) - {P_{21}}(X,Y,Z) = 0 \\ {F_{12}} = ({c_1} + {f_{01}} + {f_{11}} \cdot {r_1} + {f_{21}} \cdot {c_1}) \cdot {P_{31}}(X,Y,Z) - {P_{41}}(X,Y,Z) = 0 \\ {F_{21}} = ({r_2} + {e_{02}} + {e_{12}} \cdot {c_2} + {e_{22}} \cdot {r_2}) \cdot {P_{21}}(X,Y,Z) - {P_{22}}(X,Y,Z) = 0 \\ {F_{22}} = ({c_2} + {f_{02}} + {f_{12}} \cdot {r_2} + {f_{22}} \cdot {c_2}) \cdot {P_{32}}(X,Y,Z) - {P_{42}}(X,Y,Z) = 0 \\ \end{gathered} \right. $$ (4) 式中:$ {e}_{01} $、$ {f}_{01} $、$ {e}_{11} $、$ {f}_{11} $、$ {e}_{21} $和$ {f}_{21} $为左影像像方仿射变换参数;$ {e}_{02} $、$ {f}_{02} $、$ {e}_{12} $、$ {f}_{12} $、$ {e}_{22} $和$ {f}_{22} $为右影像像方仿射变换参数。误差方程为:
$$ V = Bx - l $$ (5) 求解上述误差方程,更新立体影像成像几何模型,获取精度提升后的立体影像,经影像密集匹配提取DEM。其中,资源三号卫星立体影像生成5 m格网ZY-3 DEM,高分七号卫星立体影像生产2 m格网GF-7 DEM。
-
如前述表1所示,不同的DEM产品高程基准不一致,SRTM和AW3D30为EGM96高程基准面,TanDEM、立体影像DEM、ICESat-2数据的高程基准为WGS84大地高。为了统一高程基准,将SRTM、AW3D30两种DEM产品的高程基准由EGM96统一转换到WGS84椭球大地高。大地高可以通过添加大地水准面差距到正高来获得[42]:
$$ {H_{{\rm{WGS84}}}} = {H_{{\rm{EGM96}}}} + N $$ (6) 式中:$ {H_{{\rm{WGS84}}}} $为转换后的椭球高高程;${H_{{\rm{EGM96}}}}$为大地水准面相应的高程;N为两者之间的高程异常值。通过上述关系将SRTM、AW3D30 DEM产品的高程都统一成WGS84椭球大地高。
-
为了评价DEM产品的精度,选取平均误差(Mean)、均方根误差(RMSE) 两个指标,其计算方法如公式(7)~(8)所示:
$$ {\rm{M{{ean}}}} = \dfrac{{\displaystyle\sum\limits_{i = 1}^n {({H_{{\rm{DEM}}}} - {H_{{\rm{ICES}}{\text{at}}}})} }}{n} $$ (7) $$ {{\rm{RMSE}}} = \sqrt {\frac{{\displaystyle\sum\limits_{i = 1}^{{n}} {{{\left[ {\left( {{H_{{\rm{DEM}}}} - {H_{{\rm{ICES}}{\text{at}}}}} \right)} \right]}^2}} }}{n}} $$ (8) 式中:n为验证点的数量;${H_{{\rm{DEM}}}}$及${H_{{\rm{ICESat}}}}$分别为验证点对应的DEM和ICESat-2数据的高程值。
除上述两个指标外,由于冰川区为山地、高山地,地形起伏明显,坡度变化显著,该研究参考《全球地理信息资源数据产品规范》[43]中不同地形下DEM精度要求(见表2),统计各DEM产品在不同地形下的误差分布。规范中明确,沙漠、冰雪、森林、阴影等影像弱纹理区域;反射率较低等困难区域;高山地、陡崖、山谷等地形变化剧烈的区域,数字高程模型的高程中误差可放宽至表2中规定的1.5倍。
表 2 数字高程模型精度要求
Table 2. Precision requirements for digital elevation model
Terrain category Slope/
(°)RMSE/m 5 m grid 10 m grid Flatland S<2 5 6 Hilly terrain 2≤S<6 5 6 Mountainous region 6≤S<25 8 10 Alpine land S≥25 10 13 -
文中统一采用ATL08产品对SRTM、AW3D30、TanDEM、ZY-3 DEM、GF-7 DEM等五种DEM产品进行精度评价。由于ATL08数据中存在一些精度较差的点,为客观准确地描述各DEM产品的精度,文中采用了文献[44]中所述的筛选方法,对参与评价的ATL08数据进行筛选,进一步保留精度可靠点。为避免ATL08和DEM产品时相不一致引起的冰川高程变化,文中基于地表覆盖数据,选取非冰川覆盖区域ATL08激光点。在岗钦、普若岗日研究区经过筛选的ATL08数据分布如图2、图3所示,分别保留1178、4605个ATL08激光点,统计信息如表3所示。

图 2 岗钦区域用于验证的ICESat-2/ATL08数据点分布
Figure 2. Distribution of ICESat-2/ATL08 data points used for validation in Gangqin area

图 3 普若岗日区域用于验证的ICESat-2/ATL08数据点分布
Figure 3. Distribution of ICESat-2/ATL08 data points used for validation in the Purogangri area
表 3 实验区ATL08验证数据筛选情况
Table 3. Screening of ATL08 validation data in experimental area
Study area Longitude and latitude range Laser collection time Number of laser points after screening Gangqin 90.57°-90.88°E, 33.74°-34.18°N 2018.11.19-2022.3.22 1178 Puruogangri 88.78°-89.56°E, 33.62°-34.09°N 2018.12.26-2021.11.21 4605 1)基于中等空间分辨率参考地形的精度评估
基于筛选后的ATL08数据对比国产卫星ZY-3 DEM、GF-7 DEM和SRTM、AW3D30、TanDEM等五种DEM产品高程精度,结果如表4、表5所示,坡度信息以立体影像 DEM为准。
表 4 岗钦研究区五种DEM高程精度验证
Table 4. Verification of five DEM elevation accuracy in Gangqin research area
Different DEMs Resolution ratio/m Evaluation parameters Slope (Verify points) All points 0°-2° 2°-6° 6°-25° >25° 168 528 473 9 1178 SRTM 30 Mean/m 2.13 2.17 2.27 −0.81 2.18 RMSE/m 2.55 2.65 3.54 6.22 3.06 AW3D30 DEM 30 Mean/m 3.43 3.18 2.94 1.51 3.1 RMSE/m 3.96 3.52 3.42 6.19 3.57 TanDEM 90 Mean/m 0.03 0.1 0.14 −3.53 0.08 RMSE/m 0.65 0.94 2.36 6.34 1.72 GF-7 DEM 2 Mean/m −0.21 −0.33 −0.31 0.83 −0.30 RMSE/m 0.58 0.73 0.84 2.35 0.77 ZY-3 DEM 5 Mean/m 0.03 0.05 0.34 1.58 0.13 RMSE/m 1.14 1.15 1.39 2.87 1.24 表 5 普若岗日研究区五种DEM高程精度验证
Table 5. Verification of the accuracy of five DEM elevations in the Purogangri research area
Different DEMs Resolution ratio/m Evaluation parameters Slope (Verify points) All points 0°-2° 2°-6° 6°-25° >25° 2254 1348 992 11 4605 SRTM 30 Mean/m 3.06 3.02 3.06 7.27 3.04 RMSE/m 3.93 3.54 4.26 11.87 3.65 AW3D DEM 30 Mean/m 2.98 2.97 2.98 4.01 3.04 RMSE/m 3.3 3.22 3.38 5.76 3.33 TanDEM 90 Mean/m −0.48 −0.17 −0.83 −7.62 −0.35 RMSE/m 6.69 4.84 8.30 23.12 5.16 GF-7 DEM 2 Mean/m −0.27 −0.26 0.01 1.79 −0.19 RMSE/m 0.76 0.92 2.43 2.54 1.20 ZY-3 DEM 5 Mean/m −1.32 −1.28 −1.37 −0.84 −1.27 RMSE/m 2.43 2.27 2.59 5.46 2.25 从总体看,岗钦区域GF-7 DEM、ZY-3 DEM、SRTM、AW3D30、TanDEM等五种DEM在非冰区域的高程精度分别为0.77 m、1.24 m、3.06 m、3.57 m和1.72 m,普若岗日区域的五种DEM高程精度分别为1.2 m、2.25 m、3.65 m、3.33 m和5.16 m。在不同坡度不同地形时,各坡度区间上GF-7 DEM都表现出最优的精度水平。0°~2°平地区及2°~6°丘陵区属于地形坡度较为平缓的区域,GF-7 DEM精度均优于1 m,ZY-3 DEM精度优于2.5 m。随着坡度的递增,两研究区五种DEM的精度都有所下降,但GF-7 DEM还是相较于其他DEM精度更优一些,其次是ZY-3 DEM、AW3D、SRTM,TanDEM的精度最差,最大误差超过20 m。
按不同地形绘制5种DEM误差折线图,如图4所示。由此可以看出,两区域中GF-7DEM在各类地形中都表现出最优的精度水平;且GF-7DEM、ZY-3DEM精度非常稳定,不同地形间高程中误差浮动最小,而90 m格网的TanDEM稳定性不高,在两个区域表现出的精度水平相差较大,其他DEM相对都比较稳定在两区域的精度水平基本一致。综上所述,两区域基于国产高分七号、资源三号卫星生产的DEM相较于开源中等空间分辨率地形参考数据,都具有较高的精度及稳定性。
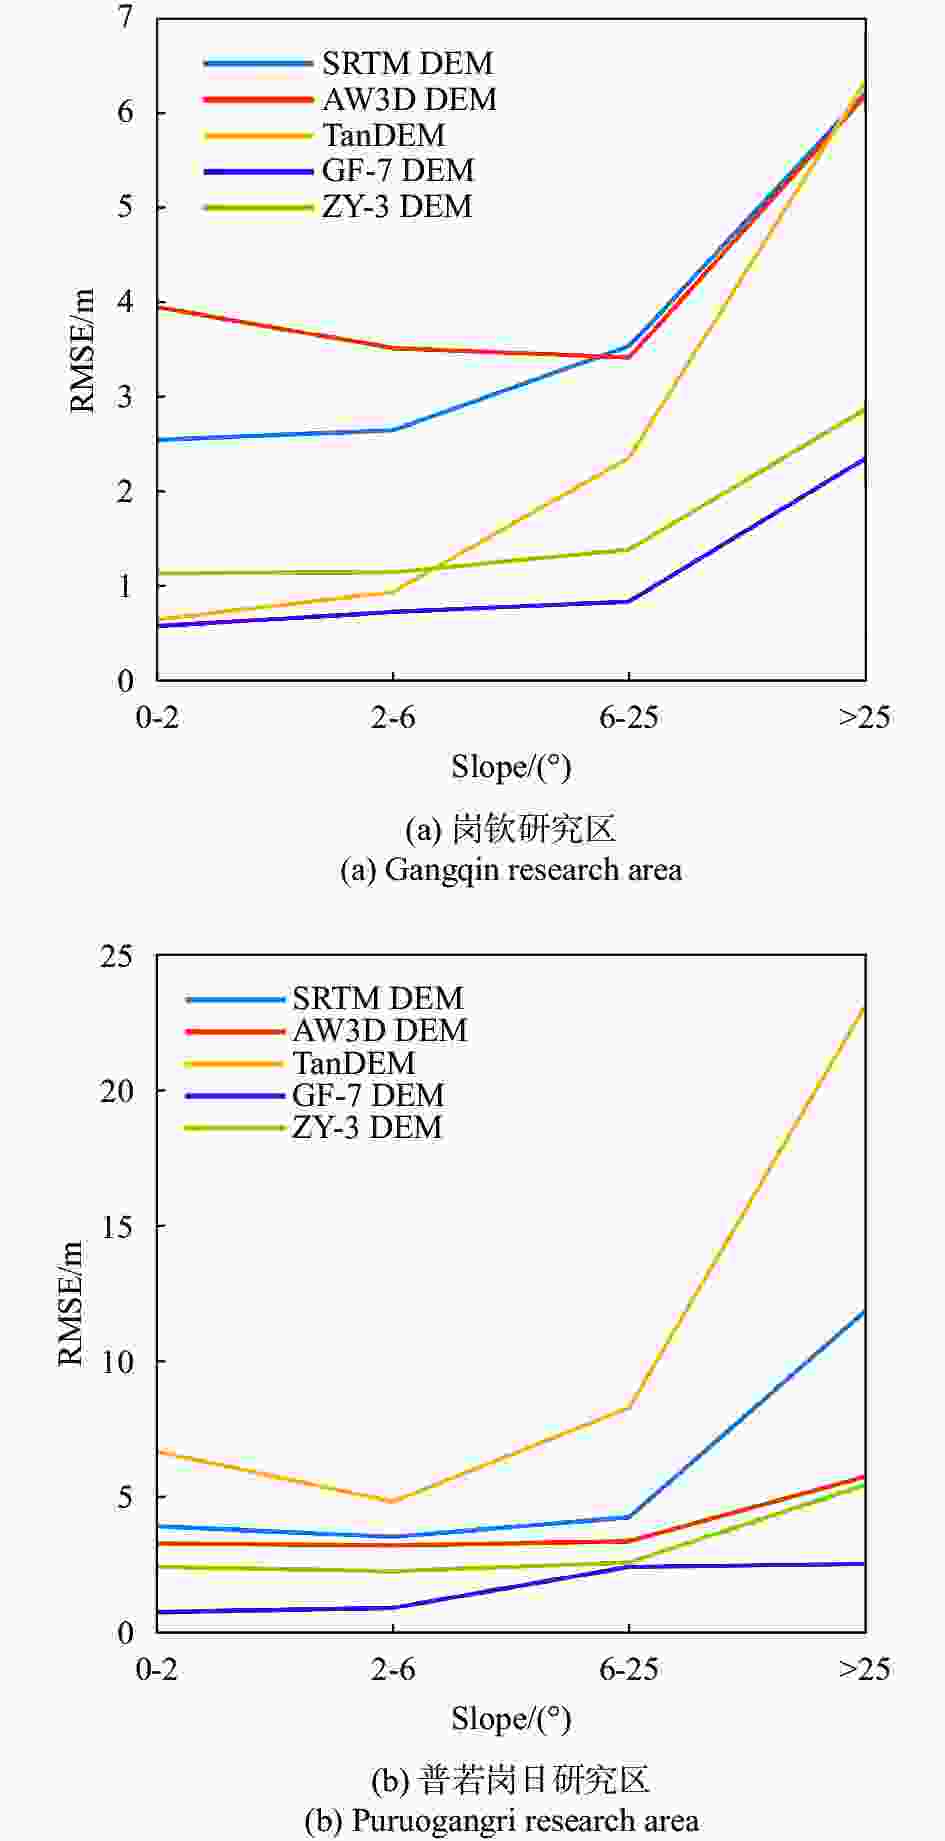
图 4 GF-7、ZY-3 DEM与其他源DEM均方根误差与地形的关系
Figure 4. Relationship between GF-7, ZY-3 DEM and other source DEM RMSE and terrain
2)基于高空间分辨率参考地形的精度评估
由于云、遮挡物、图像饱和等原因,国外发布的基于立体影像生产的HMA DEM数据集存在较多空洞,如图5、6所示,在岗钦及普若岗日研究区内仅有部分HMA DEM数据,其覆盖性能明显差于GF-7 DEM和ZY-3 DEM。采用ATL08数据对两DEM的重叠区域进行高程精度验证,结果如表6所示。
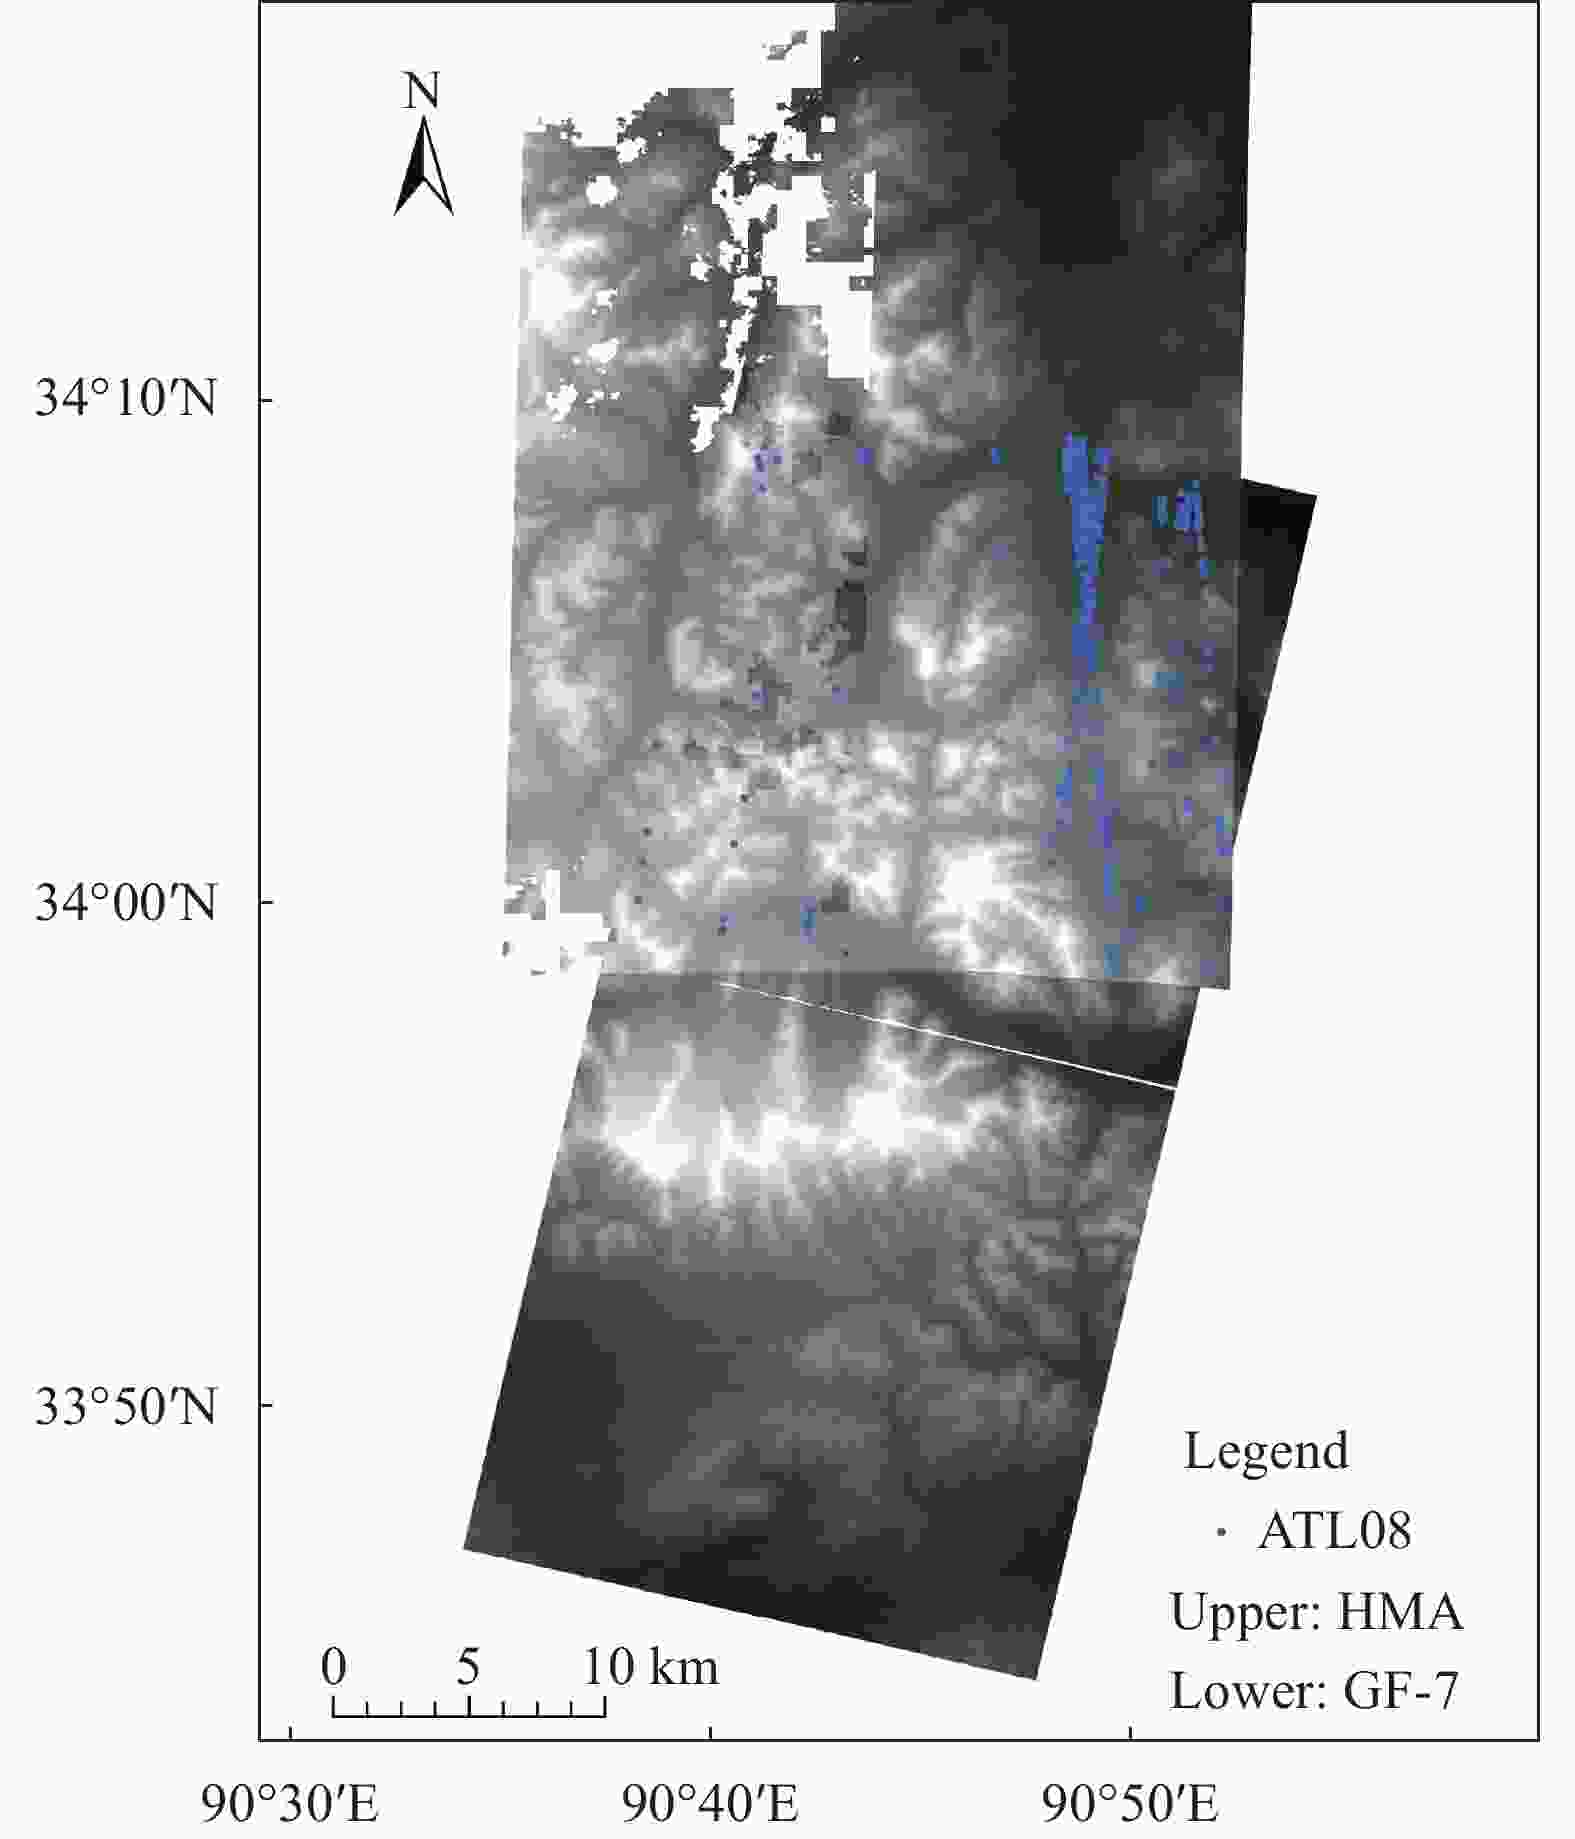
图 5 HMA DEM与GF-7 DEM交集部分验证点分布
Figure 5. Distribution of verification points at the intersection of HMA DEM and GF-7 DEM
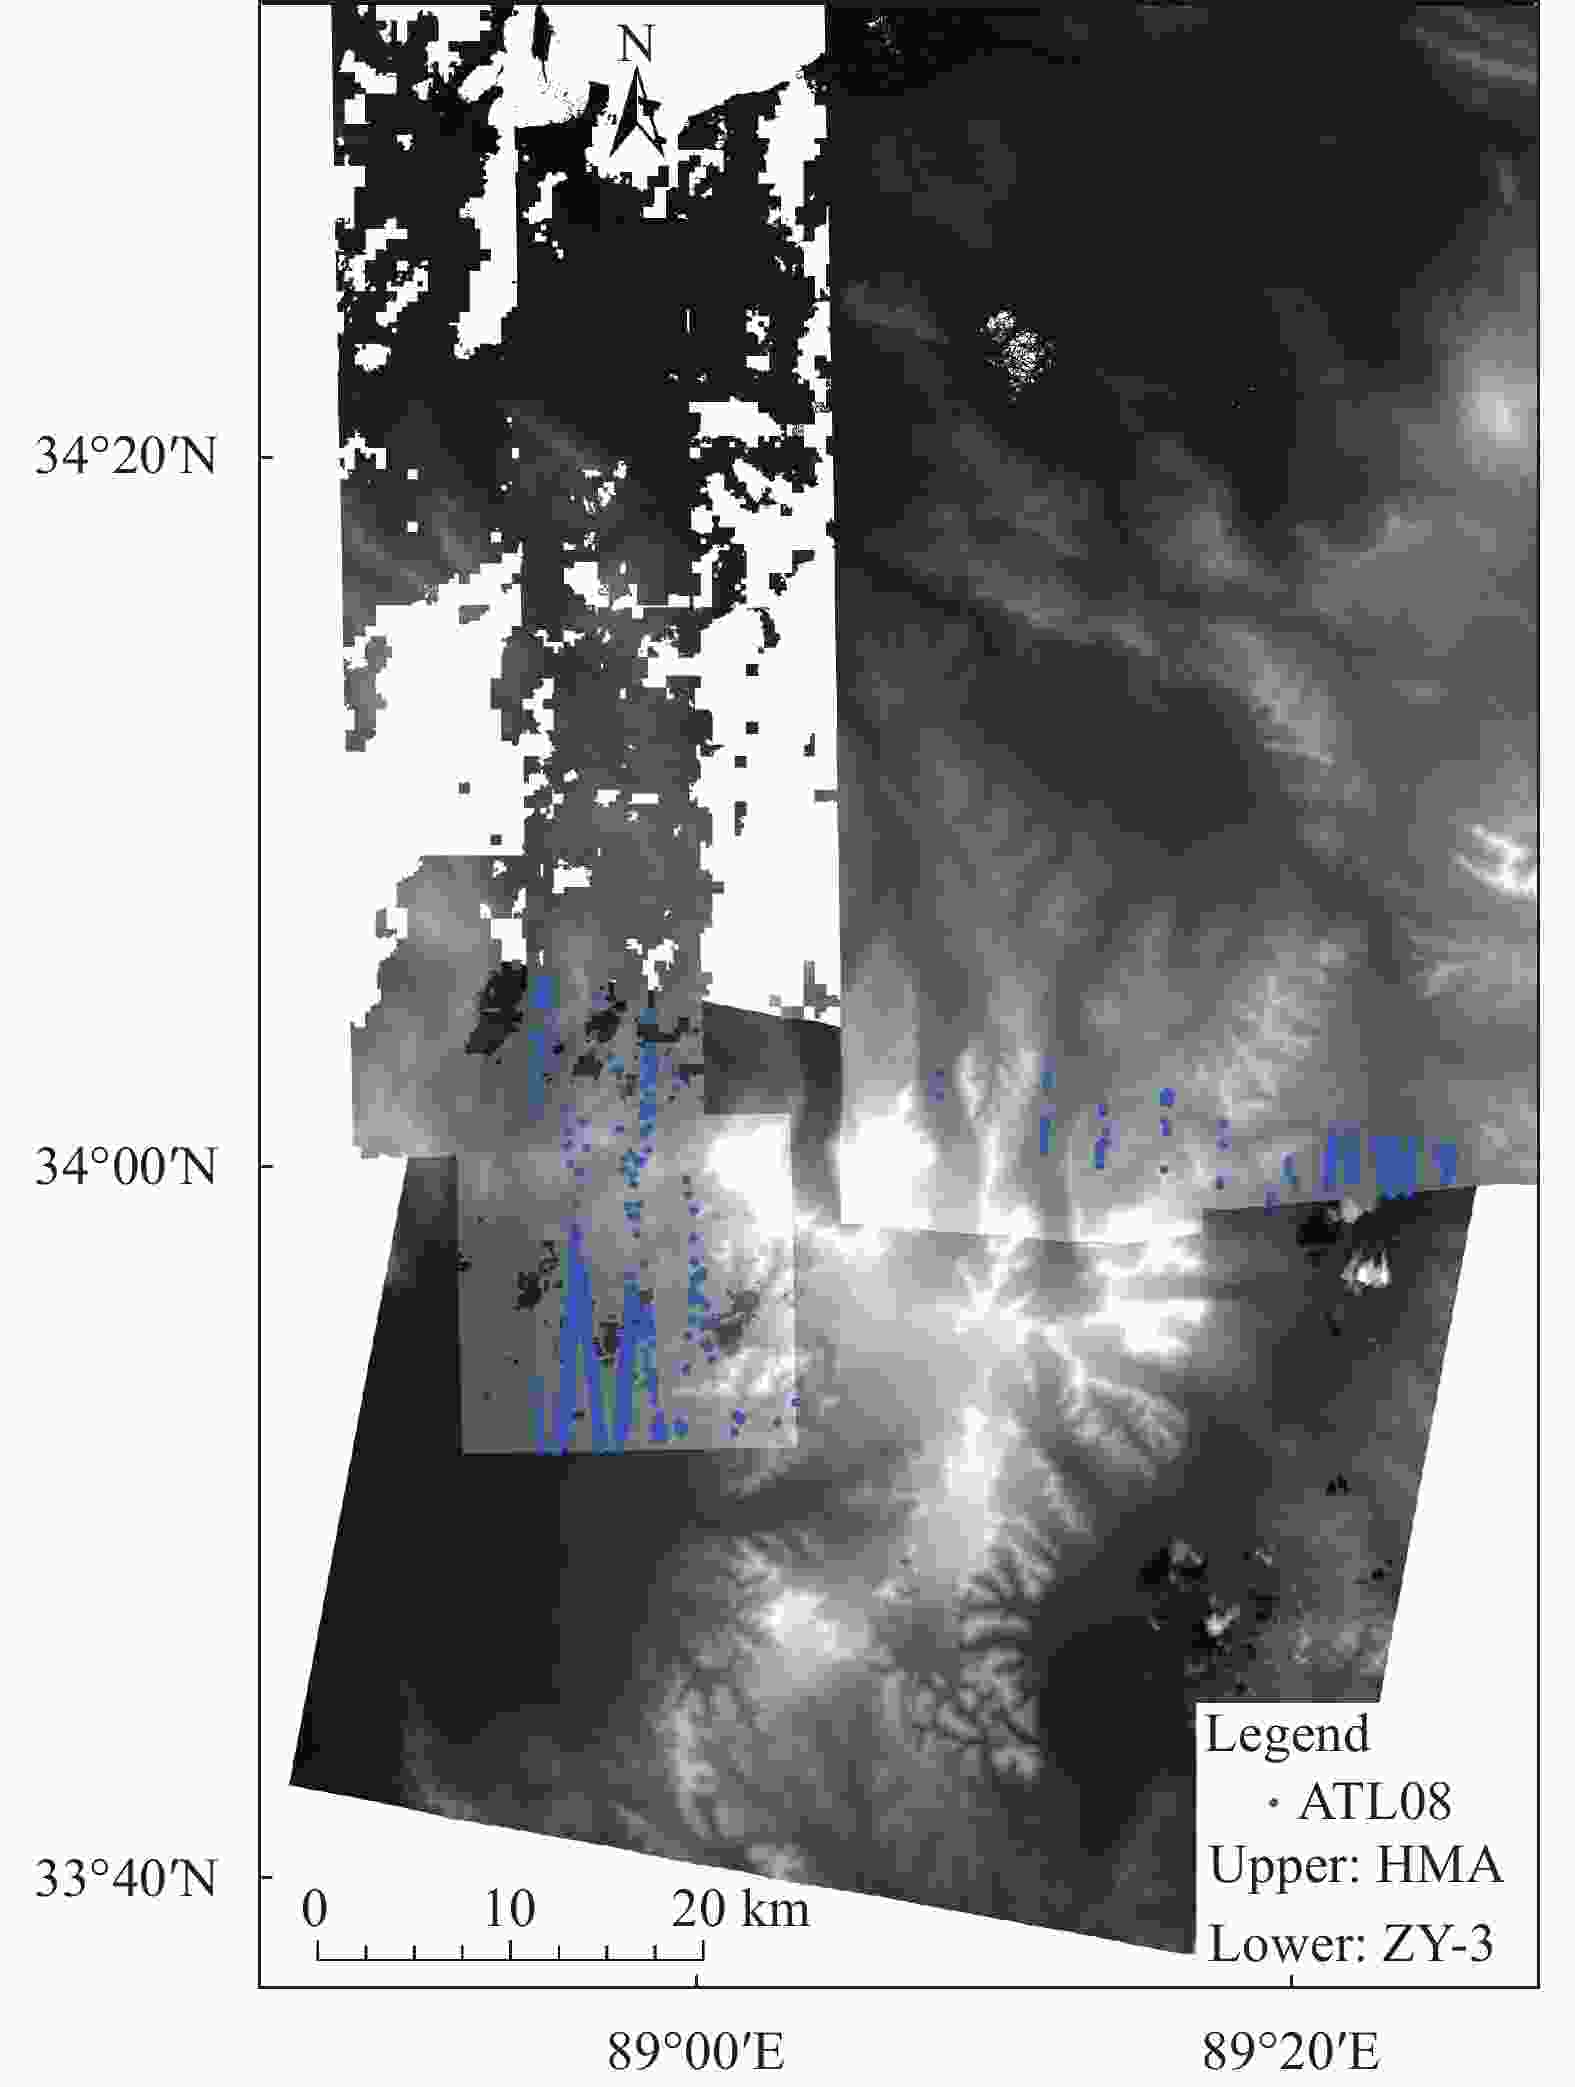
图 6 HMA DEM与ZY-3 DEM交集部分验证点分布
Figure 6. Distribution of verification points at the intersection of HMA DEM and ZY-3 DEM
从验证结果来看,GF-7 DEM的高程精度为0.94 m,要优于HMA DEM的1.78 m,HMA DEM的精度要高于ZY-3 DEM约1.4 m。主要原因是基础数据源分辨率的限制,HMA源自亚米级分辨率影像,因此在精度上较ZY-3 DEM更有优势。从DEM的覆盖来看,GF-7 DEM和ZY-3 DEM覆盖全面,HMA数据存在较多数据空洞,质量较差,尤其在冰川区域数据覆盖更少,这也是HMA DEM数据集发布后没能广泛应用于青藏高原冰川的重要原因。
表 6 HMA DEM与GF-7、ZY-3 DEM的验证结果
Table 6. Validation results of HMA DEM and GF-7, ZY-3 DEM
Area Verification points/piece Different DEMs DEM grid/m Elevation accuracy/m Gangqin 470 HMA 8 Mean 1.68 RMSE 1.78 GF-7 DEM 2 Mean −0.54 RMSE 0.94 Puruogangri 1298 HMA 8 Mean 1.16 RMSE 1.39 ZY-3 DEM 5 Mean −2.24 RMSE 2.79 -
图7、8分别为GF-7 DEM、ZY-3 DEM在两研究区与SRTM、TanDEM、AW3D及HMA的山体阴影图,代表了这六种DEM数据所反映出来的地形表面信息与真实的地貌特征。从整体来看,各DEM都能描述出山区地形起伏的基本状态。图9、10为冰川末端细节描述,ZY-3 DEM、GF-7 DEM及HMA由于分辨率极高对地形细节的描述较为清晰,能够清楚的描述出冰川末端的纹理细节,山脊线特征明显,非常接近真实地形表面,但是HMA数据存在较多空洞。SRTM及AW3D对地形表面的描述能力稍差一些,由于其水平分辨率为30 m,仅能描述出该地区地形起伏的大致特征,对冰川末端的局部细节特征描述不清晰。TanDEM分辨率为90 m,分辨率较低,地形纹理非常粗糙,不能描述局部细节特征,TanDEM只能用于对特大范围地形的基本描述。各DEM对地形特征的表现能力,主要受限于数据源的分辨率,分辨率较低的数据对真实地形的表现能力较差,GF-7 DEM、ZY-3 DEM、HMA分辨率较高对真实地形的表现能力更强,但从图中明显发现,两区域HMA数据存在较大部分缺失覆盖度有限,存在数据区域也有较多漏洞。综合来看两研究区国产立体影像DEM在对真实地形的描述能力及数据覆盖度上都具有较高的水平。
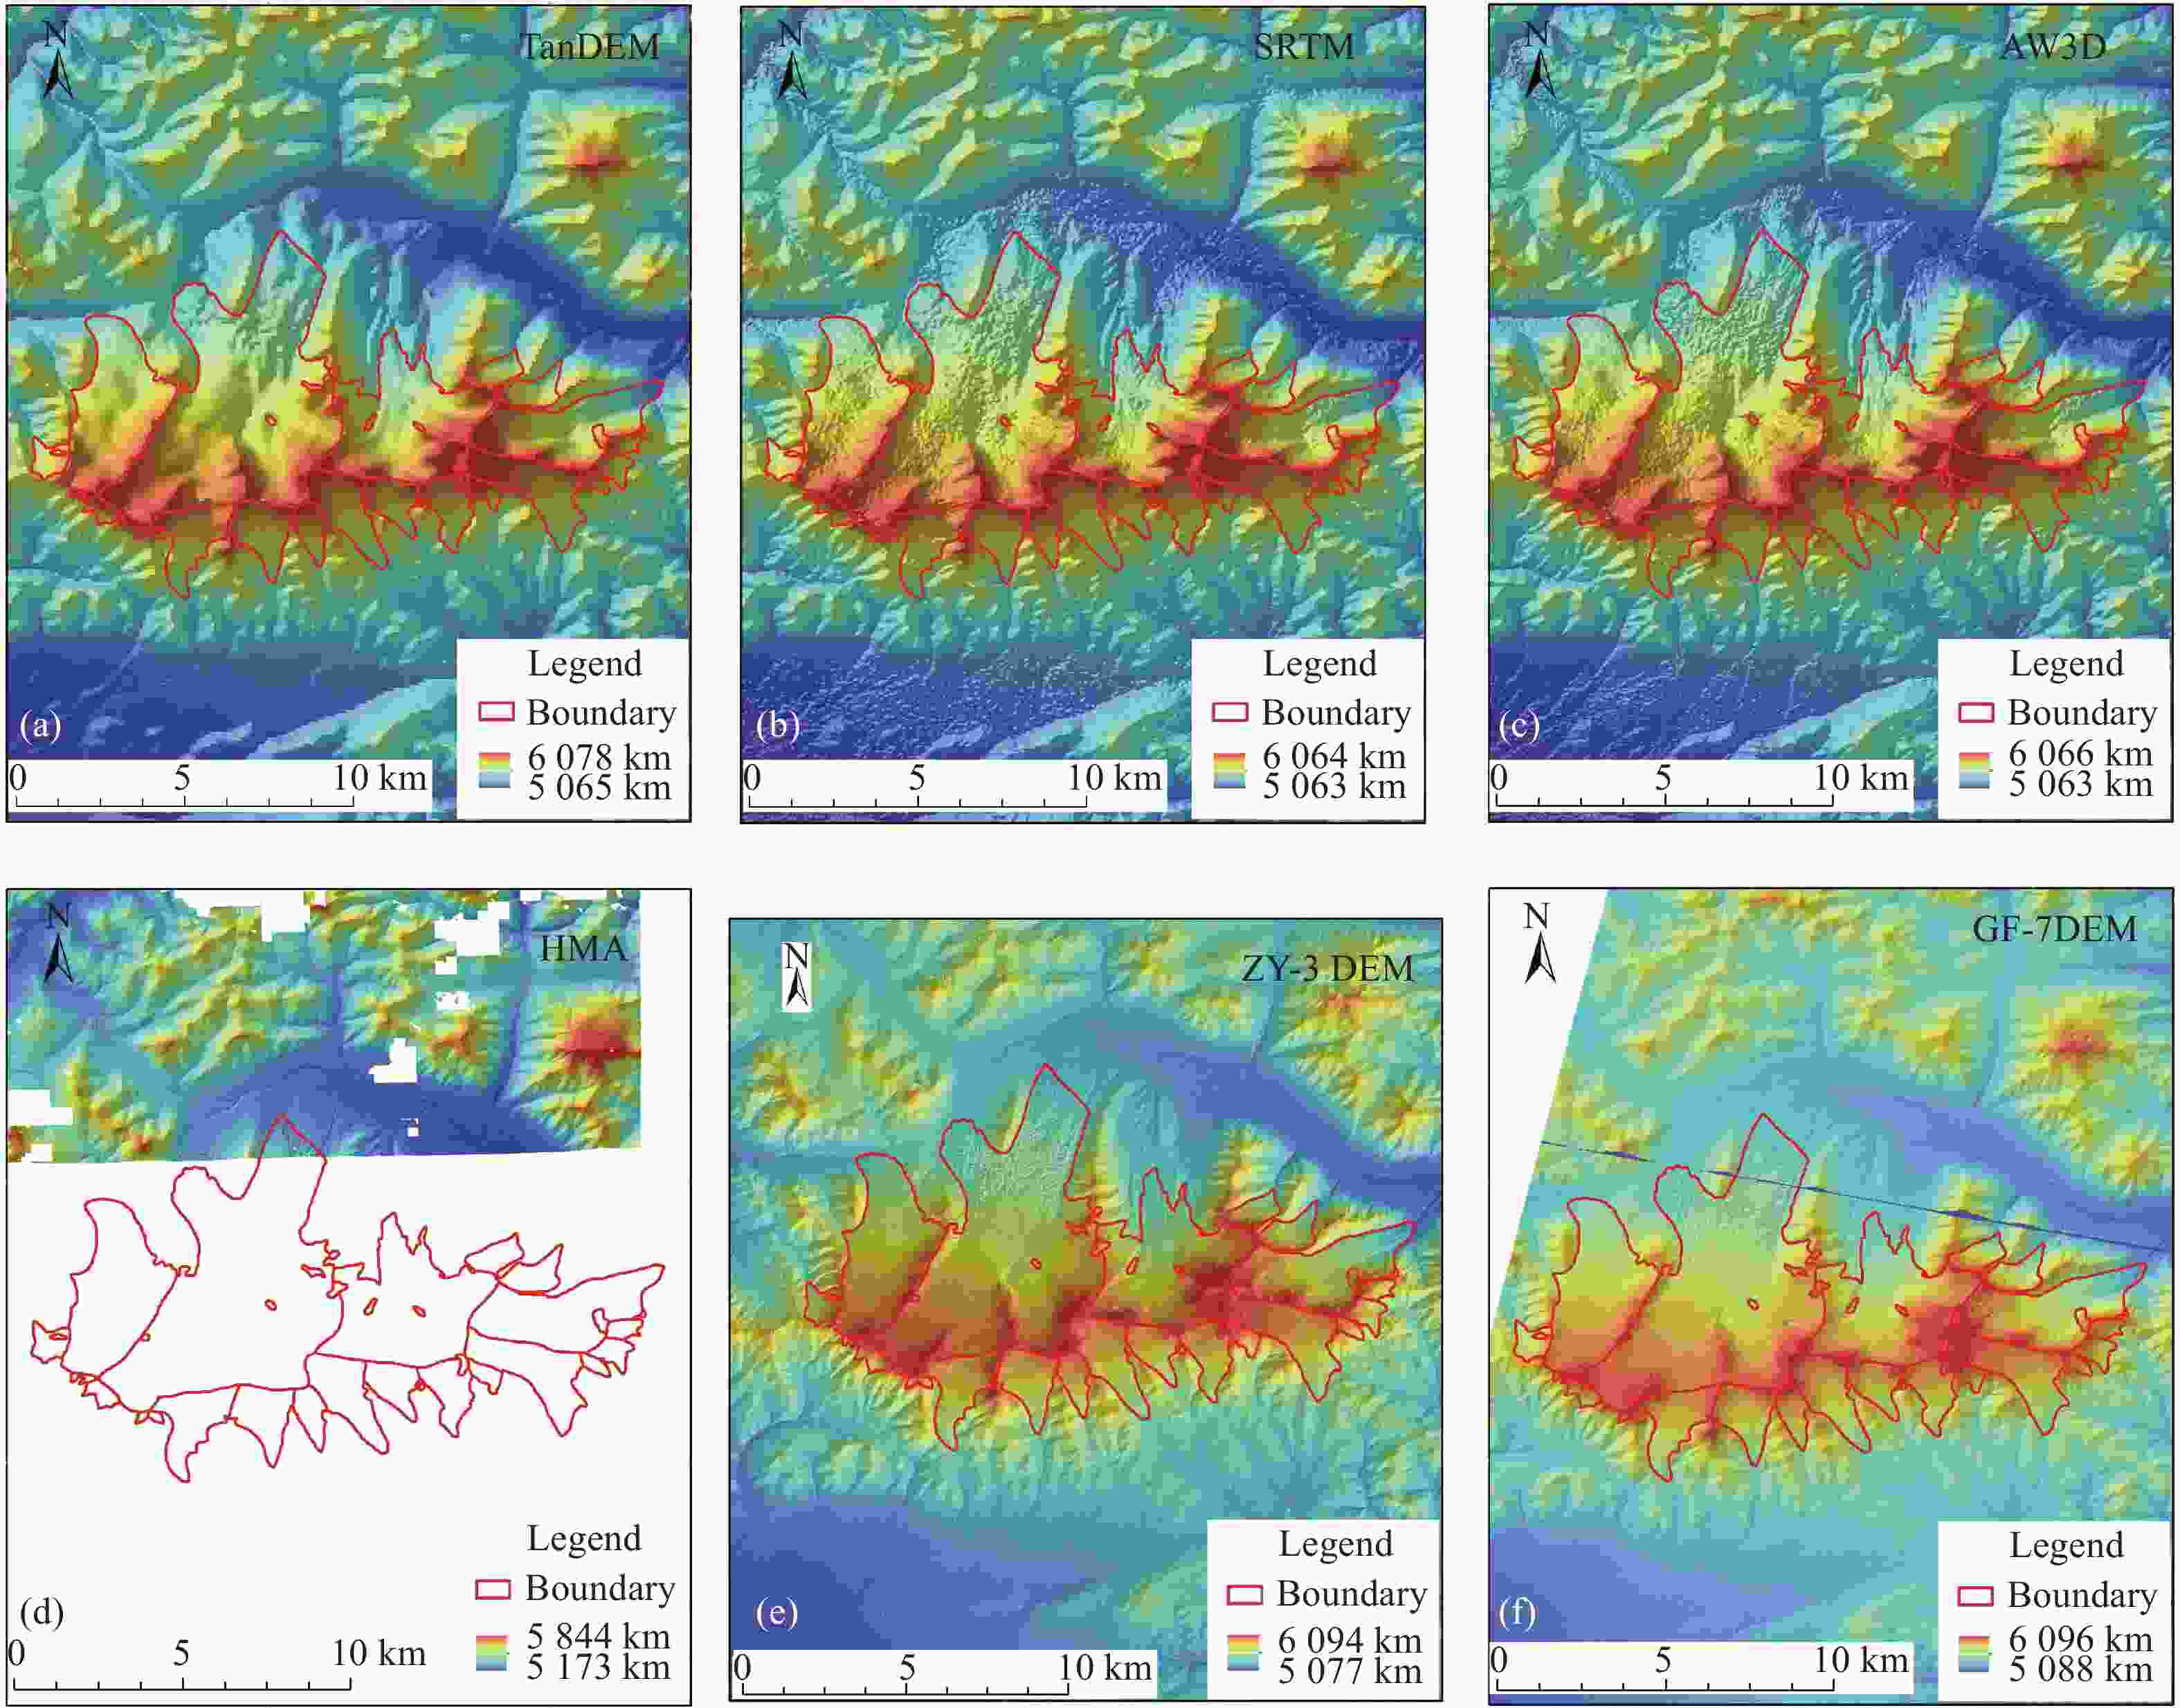
图 7 岗钦研究区六种DEM山体阴影图。(a)岗钦研究区TanDEM;(b)岗钦研究区SRTM;(c)岗钦研究区AW3D;(d)岗钦研究区HMA;(e)岗钦研究区ZY-3 DEM;(f)岗钦研究区GF-7 DEM
Figure 7. Shadow map of six DEM mountains in Gangqin research area. (a) TanDEM of Gangqin research area; (b) SRTM of Gangqin research area; (c) AW3D of Gangqin research area; (d) HMA of Gangqin research area; (e) ZY-3 DEM of Gangqin research area; (f) GF-7 DEM of Gangqin research area
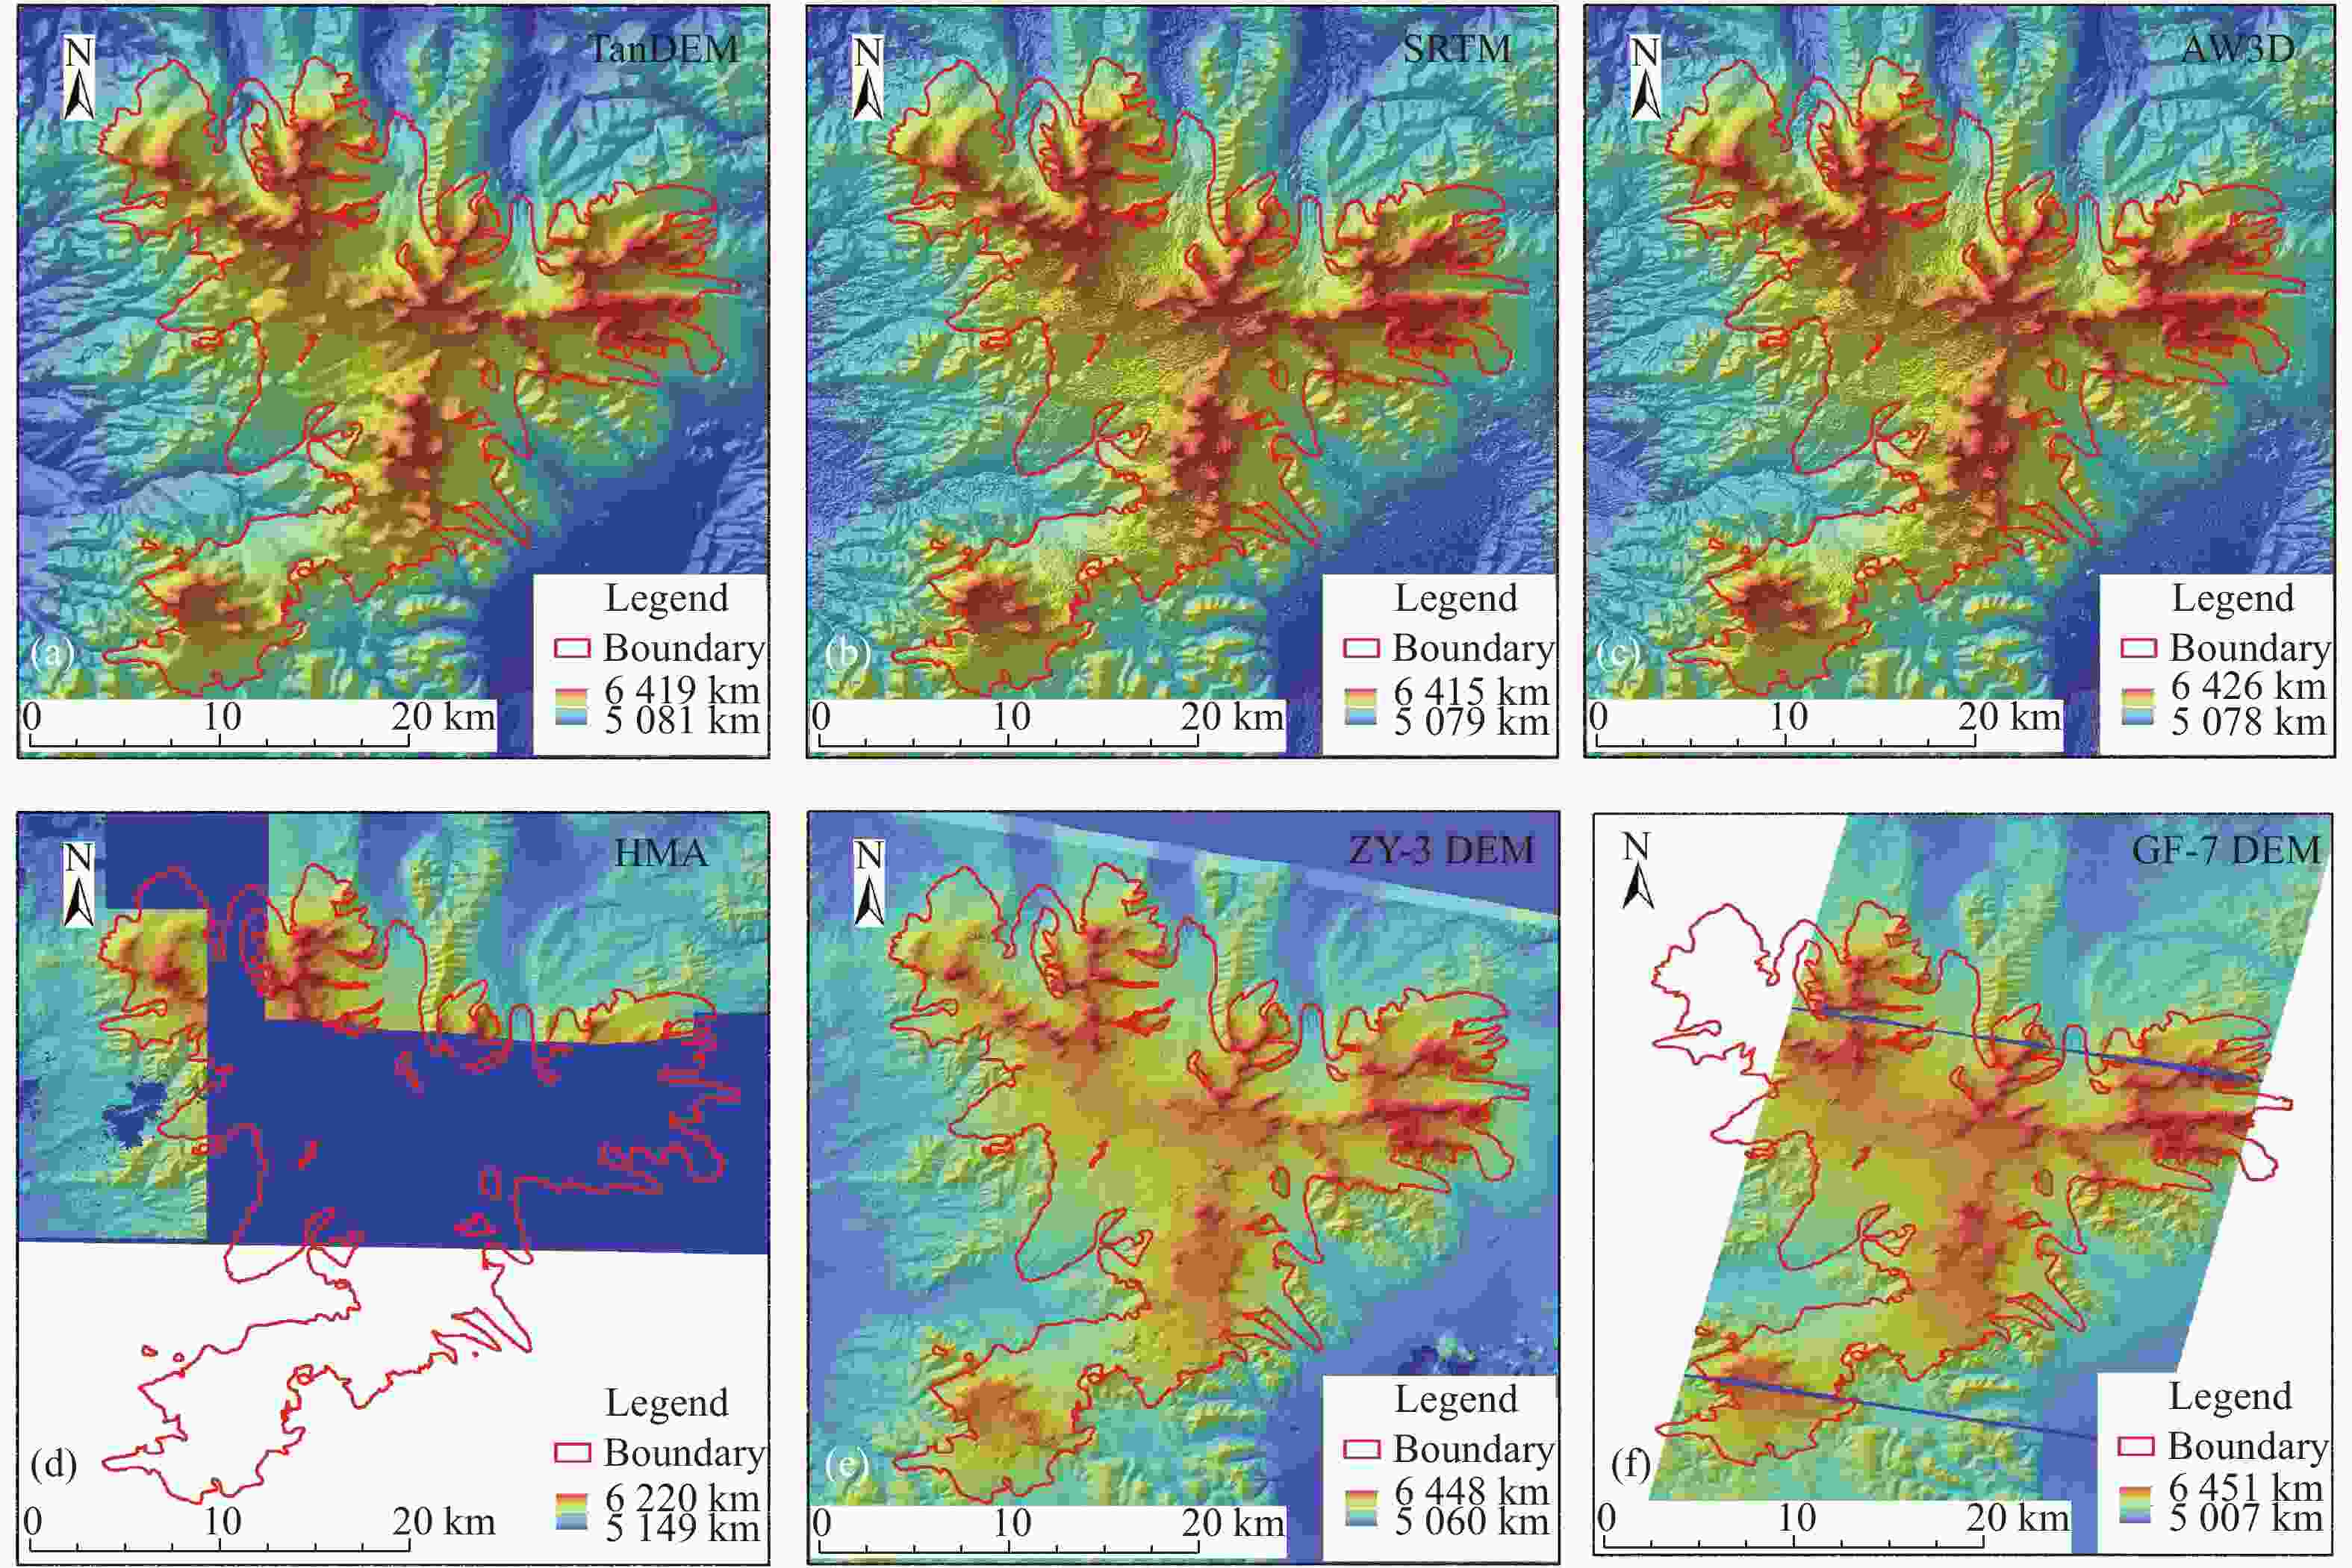
图 8 普若岗日研究区六种DEM山体阴影。(a)普若岗日研究区TanDEM;(b)普若岗日研究区SRTM;(c)普若岗日研究区AW3D;(d)普若岗日研究区HMA;(e)普若岗日研究区ZY-3 DEM;(f)普若岗日研究区GF-7 DEM
Figure 8. Six types of DEM mountain shadows in the Purogangri research area. (a) TanDEM of Purogangri research area; (b) SRTM of Purogangri research area; (c) AW3D of Purogangri research area; (d) HMA of Purogangri research area; (e) ZY-3 DEM of Purogangri research area; (f) GF-7 DEM of Purogangri research area

图 9 岗钦研究区六种DEM冰川末端地形特征。(a)岗钦研究区TanDEM冰川末端地形特征;(b)岗钦研究区SRTM冰川末端地形特征;(c)岗钦研究区AW3D冰川末端地形特征;(d)岗钦研究区HMA冰川末端地形特征;(e)岗钦研究区ZY-3 DEM冰川末端地形特征;(f)岗钦研究区GF-7 DEM冰川末端地形特征
Figure 9. Topographic characteristics of six DEM glacier ends in the Gangqin research area. (a) Topographic characteristics of TanDEM glacier ends in Gangqin research area; (b) Topographic characteristics of SRTM glacier ends in Gangqin research area; (c) Topographic characteristics of AW3D glacier ends in Gangqin research area; (d) Topographic characteristics of HMA glacier ends in Gangqin research area; (e) Topographic characteristics of ZY-3 DEM glacier ends in Gangqin research area; (f) Topographic characteristics of GF-7 DEM glacier ends in Gangqin research area
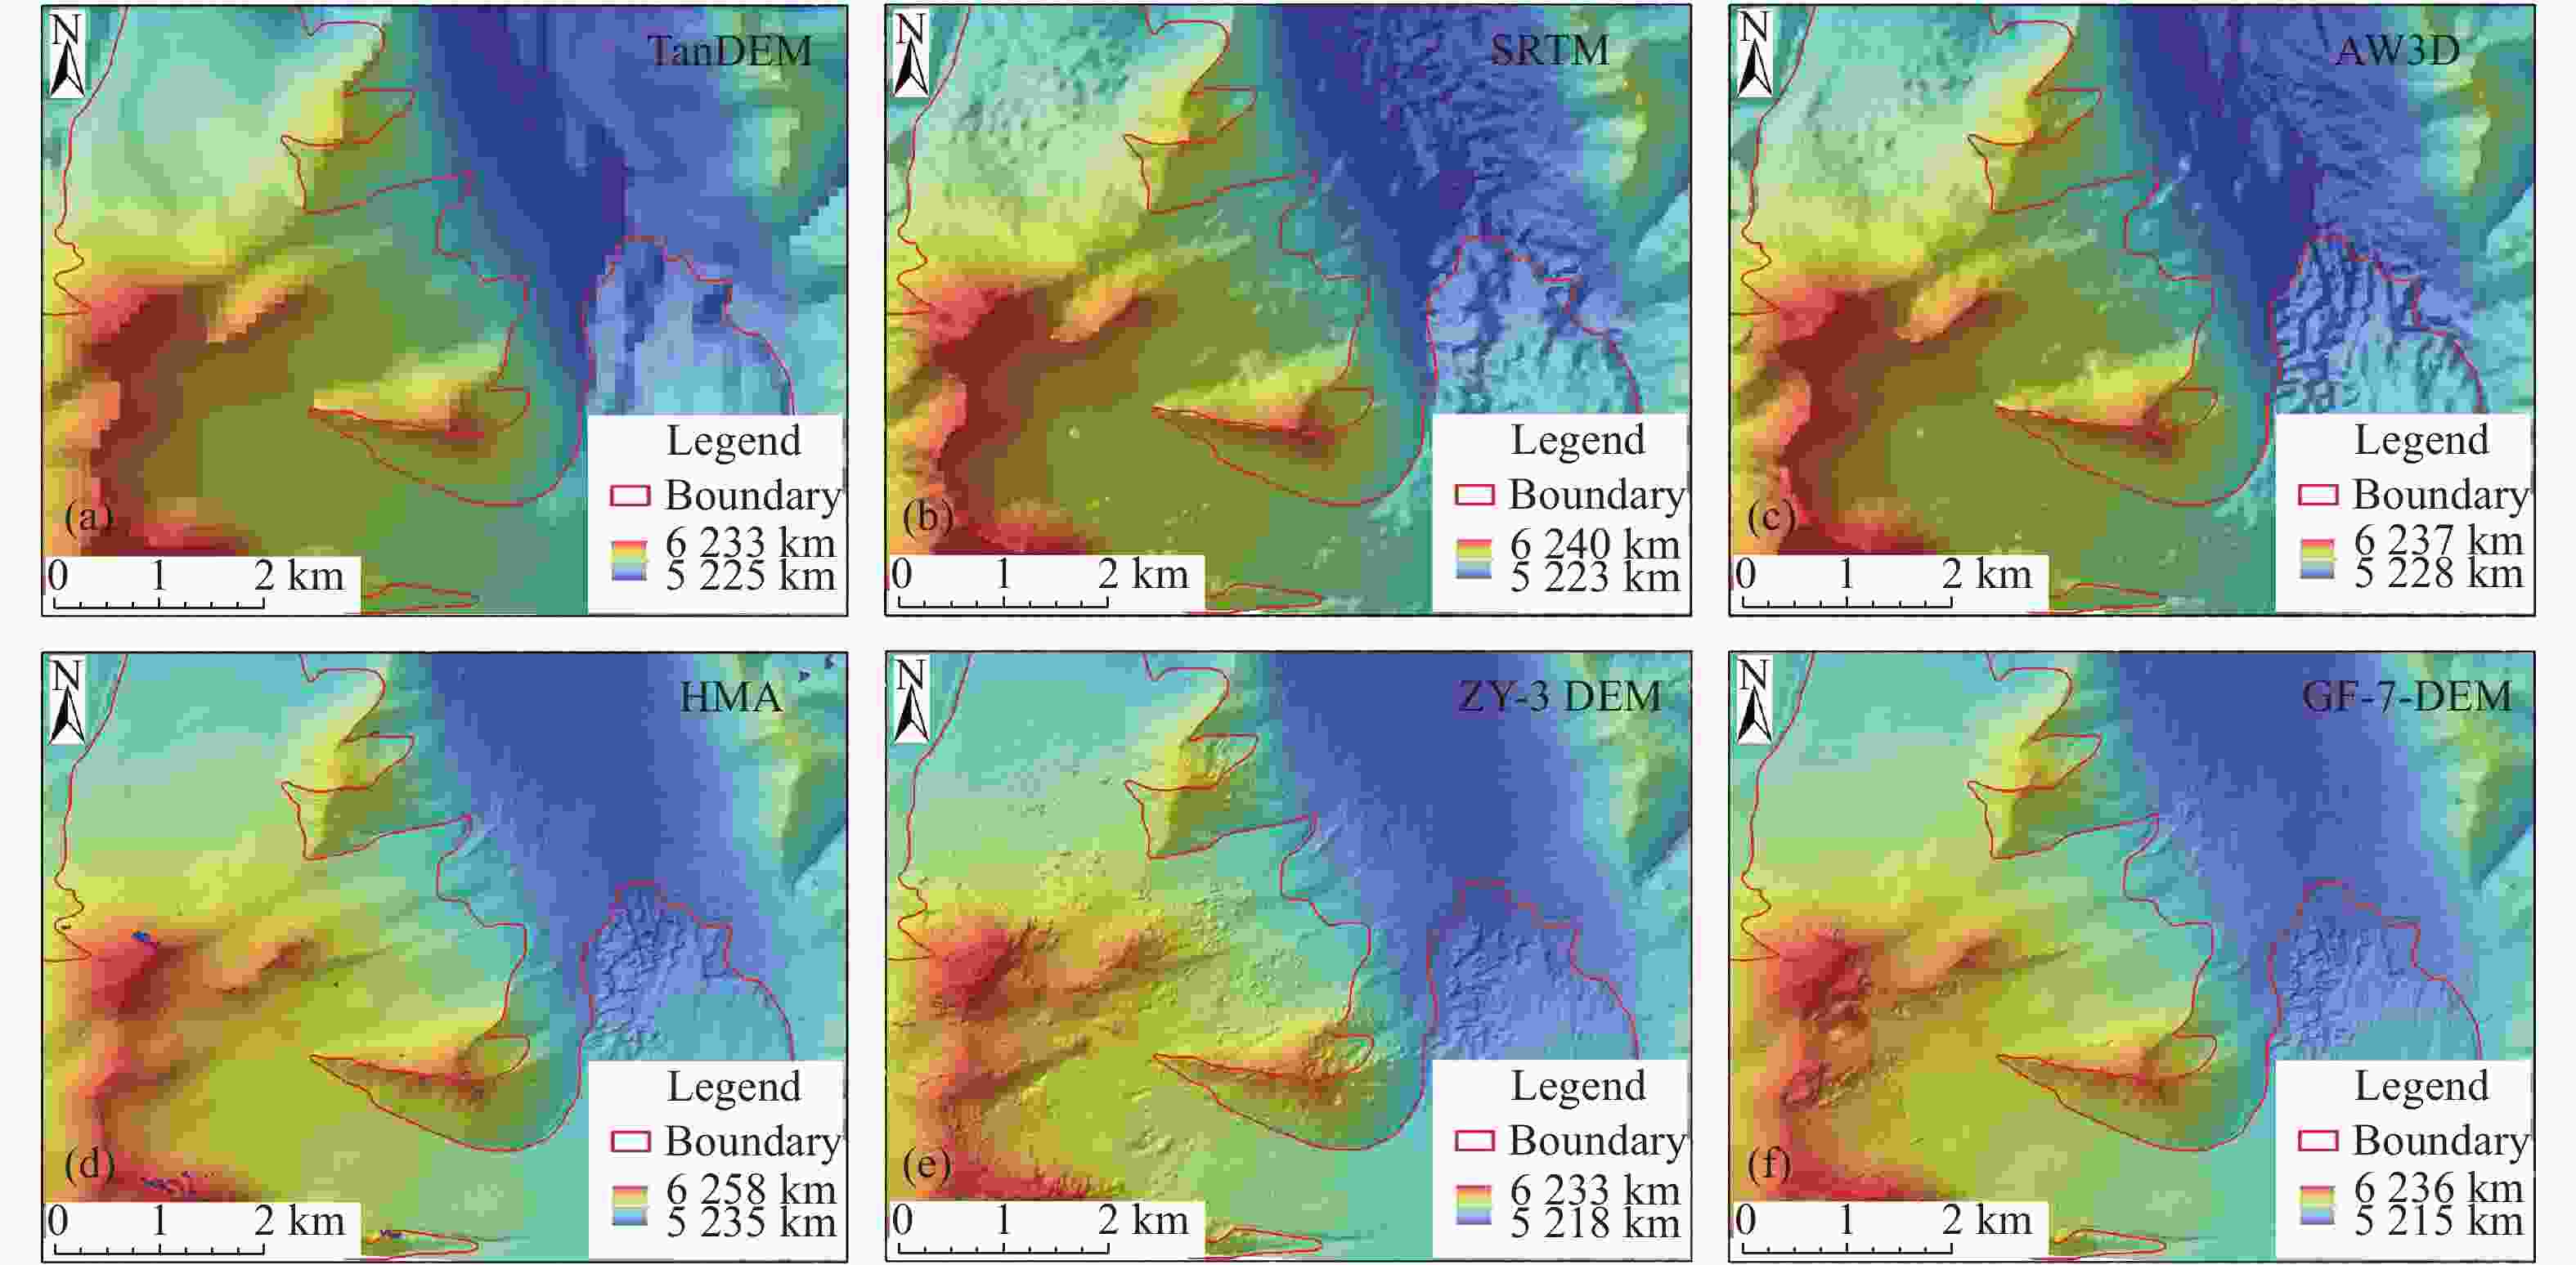
图 10 普若岗日研究区六种DEM冰川末端地形特征。(a)普若岗日研究区TanDEM冰川末端地形特征;(b)普若岗日研究区SRTM冰川末端地形特征;(c)普若岗日研究区AW3D冰川末端地形特征;(d)普若岗日研究区HMA冰川末端地形特征;(e)普若岗日研究区ZY-3 DEM冰川末端地形特征;(f) 普若岗日研究区GF-7 DEM冰川末端地形特征
Figure 10. Topographic characteristics of six DEM glacier ends in the Purogangri research area. (a) Topographic characteristics of TanDEM glacier ends in Purogangri research area; (b) Topographic characteristics of SRTM glacier ends in Purogangri research area; (c) Topographic characteristics of AW3D glacier ends in Purogangri research area; (d) Topographic characteristics of HMA glacier ends in Purogangri research area; (e) Topographic characteristics of ZY-3 DEM glacier ends in Purogangri research area; (f) Topographic characteristics of GF-7 DEM glacier ends in Purogangri research area
-
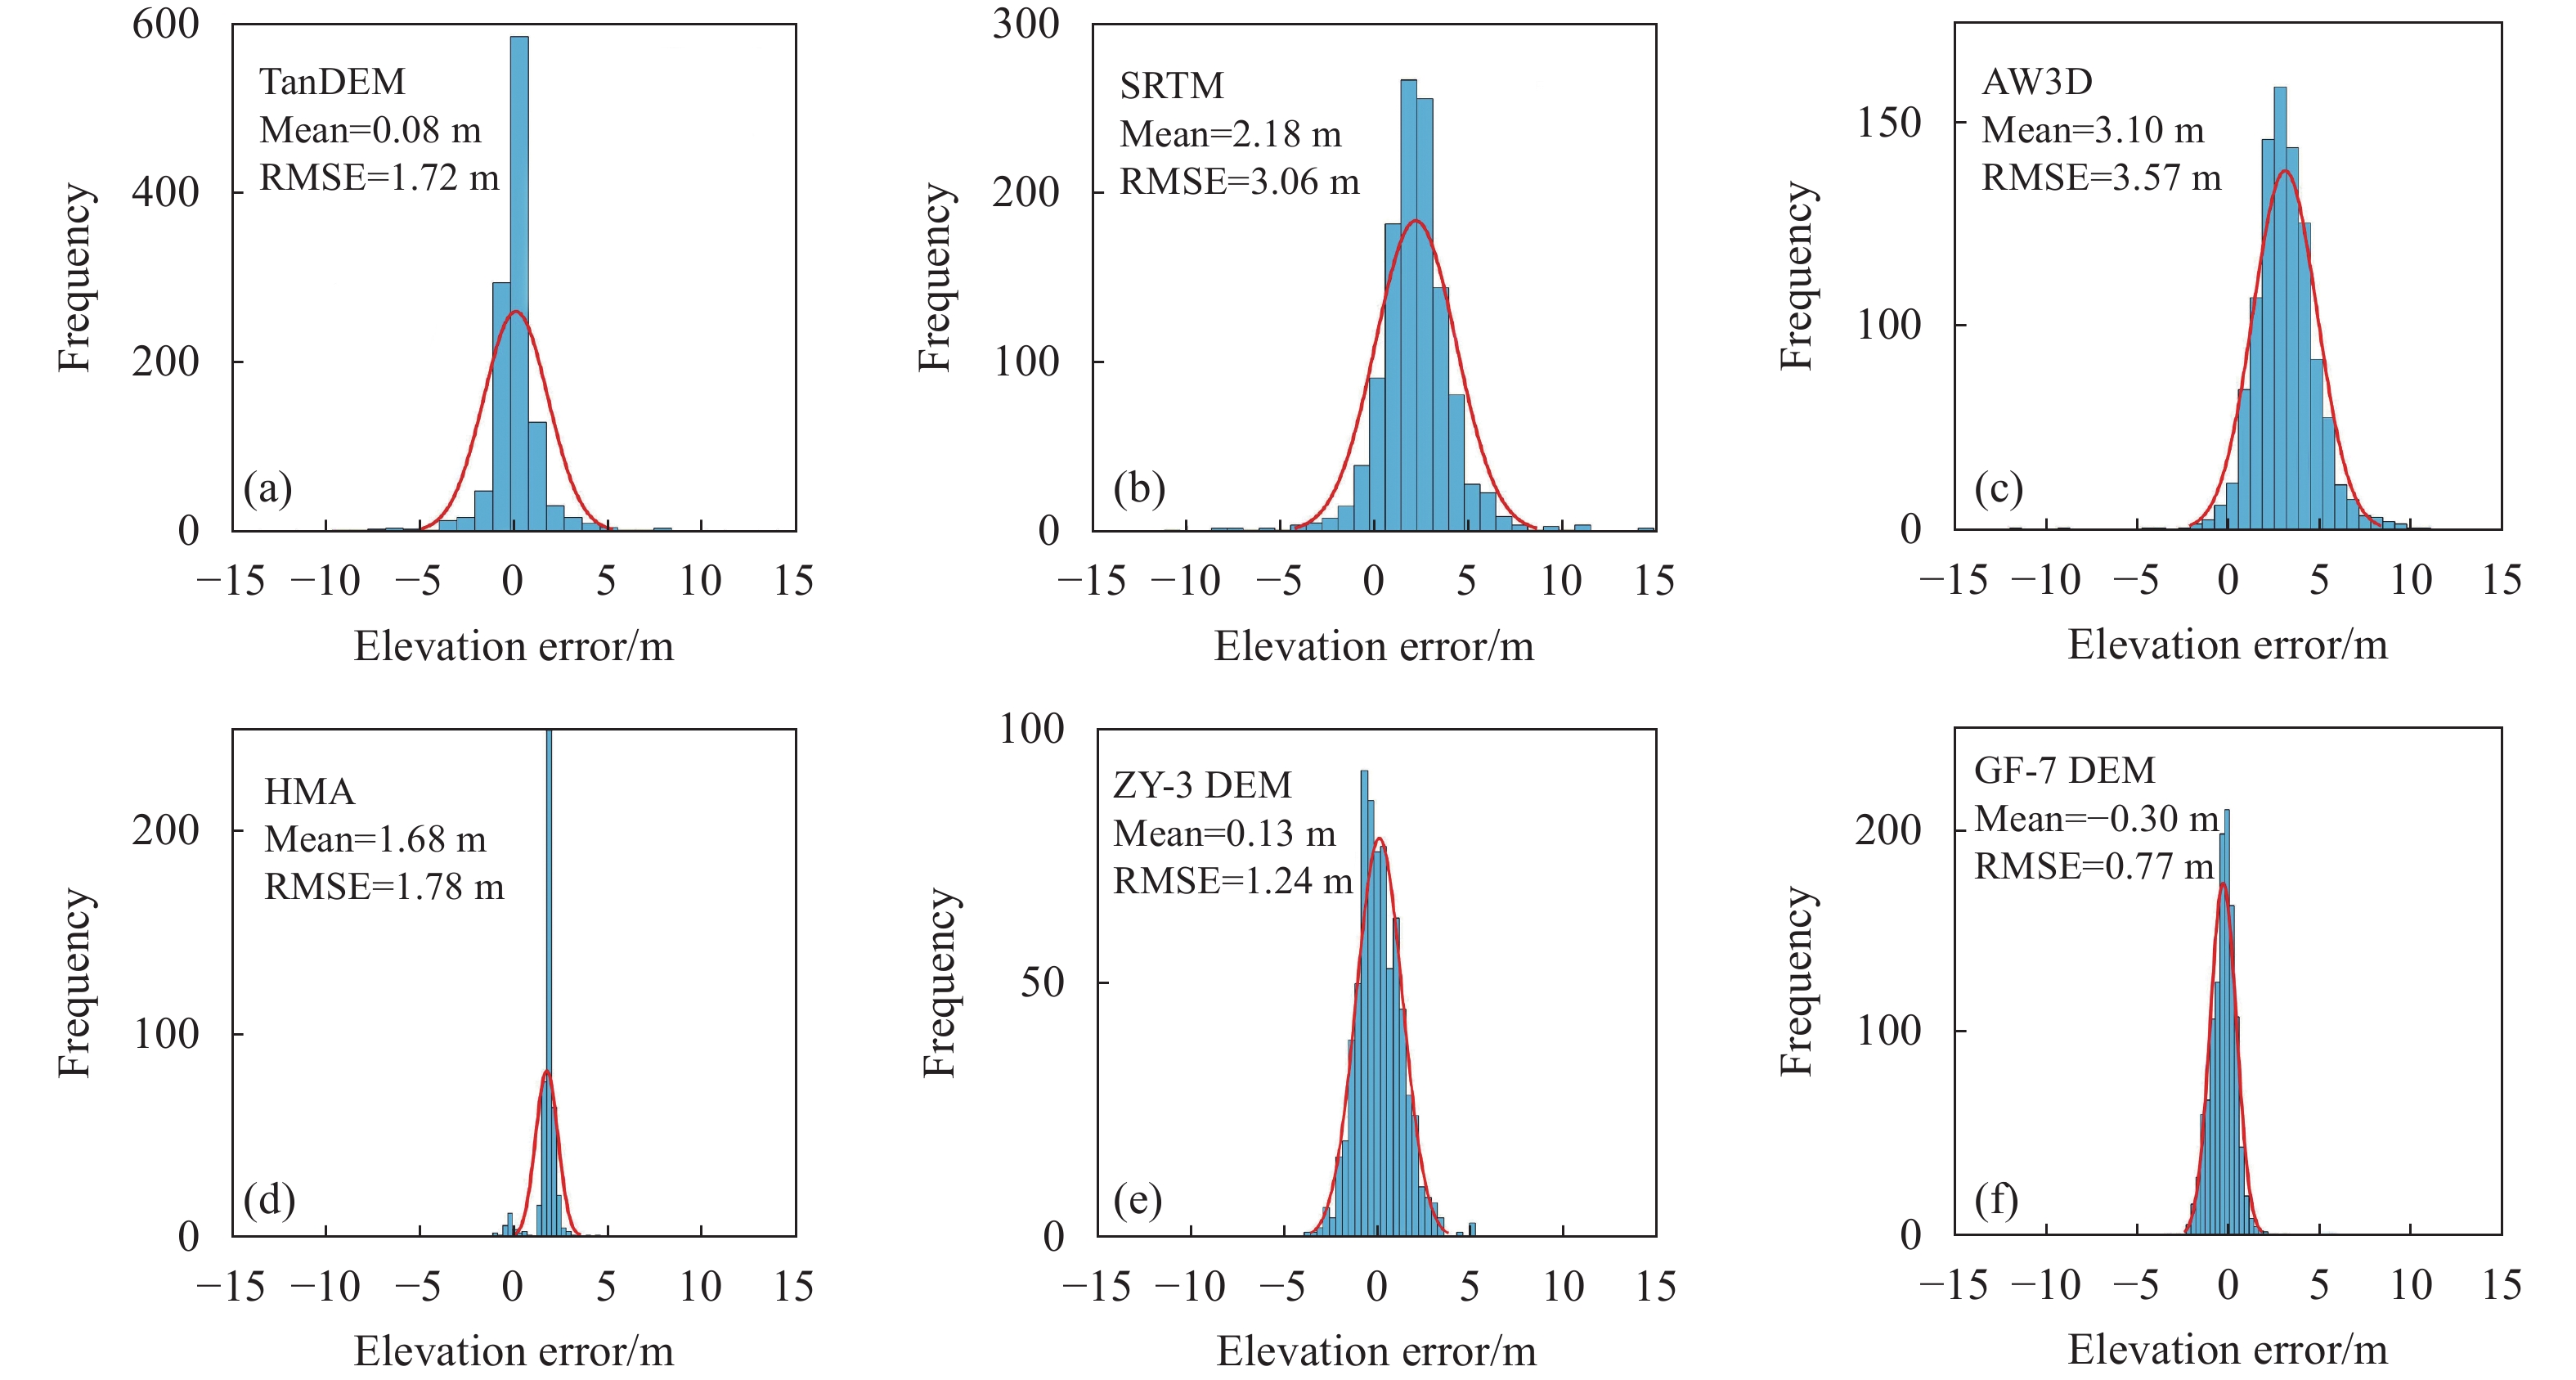
资源三号及高分七号DEM数据和其他4种开源DEM数据集的高程误差分布直方图如图11、12所示。从图中可以看出,在两研究区中六种DEM在误差聚集度上,GF-7 DEM、HMA的误差分布最为集中,其次是ZY-3 DEM,SRTM及AW3D的分布集中性相近,TanDEM数据误差分布较分散。各直方图都反映出数据误差的大小与误差分布集中性的一致,误差分布越集中,误差越小,精度越高。

图 11 岗钦区域六种DEM误差分布
Figure 11. Error distribution of six types of DEM in the Gangqin area
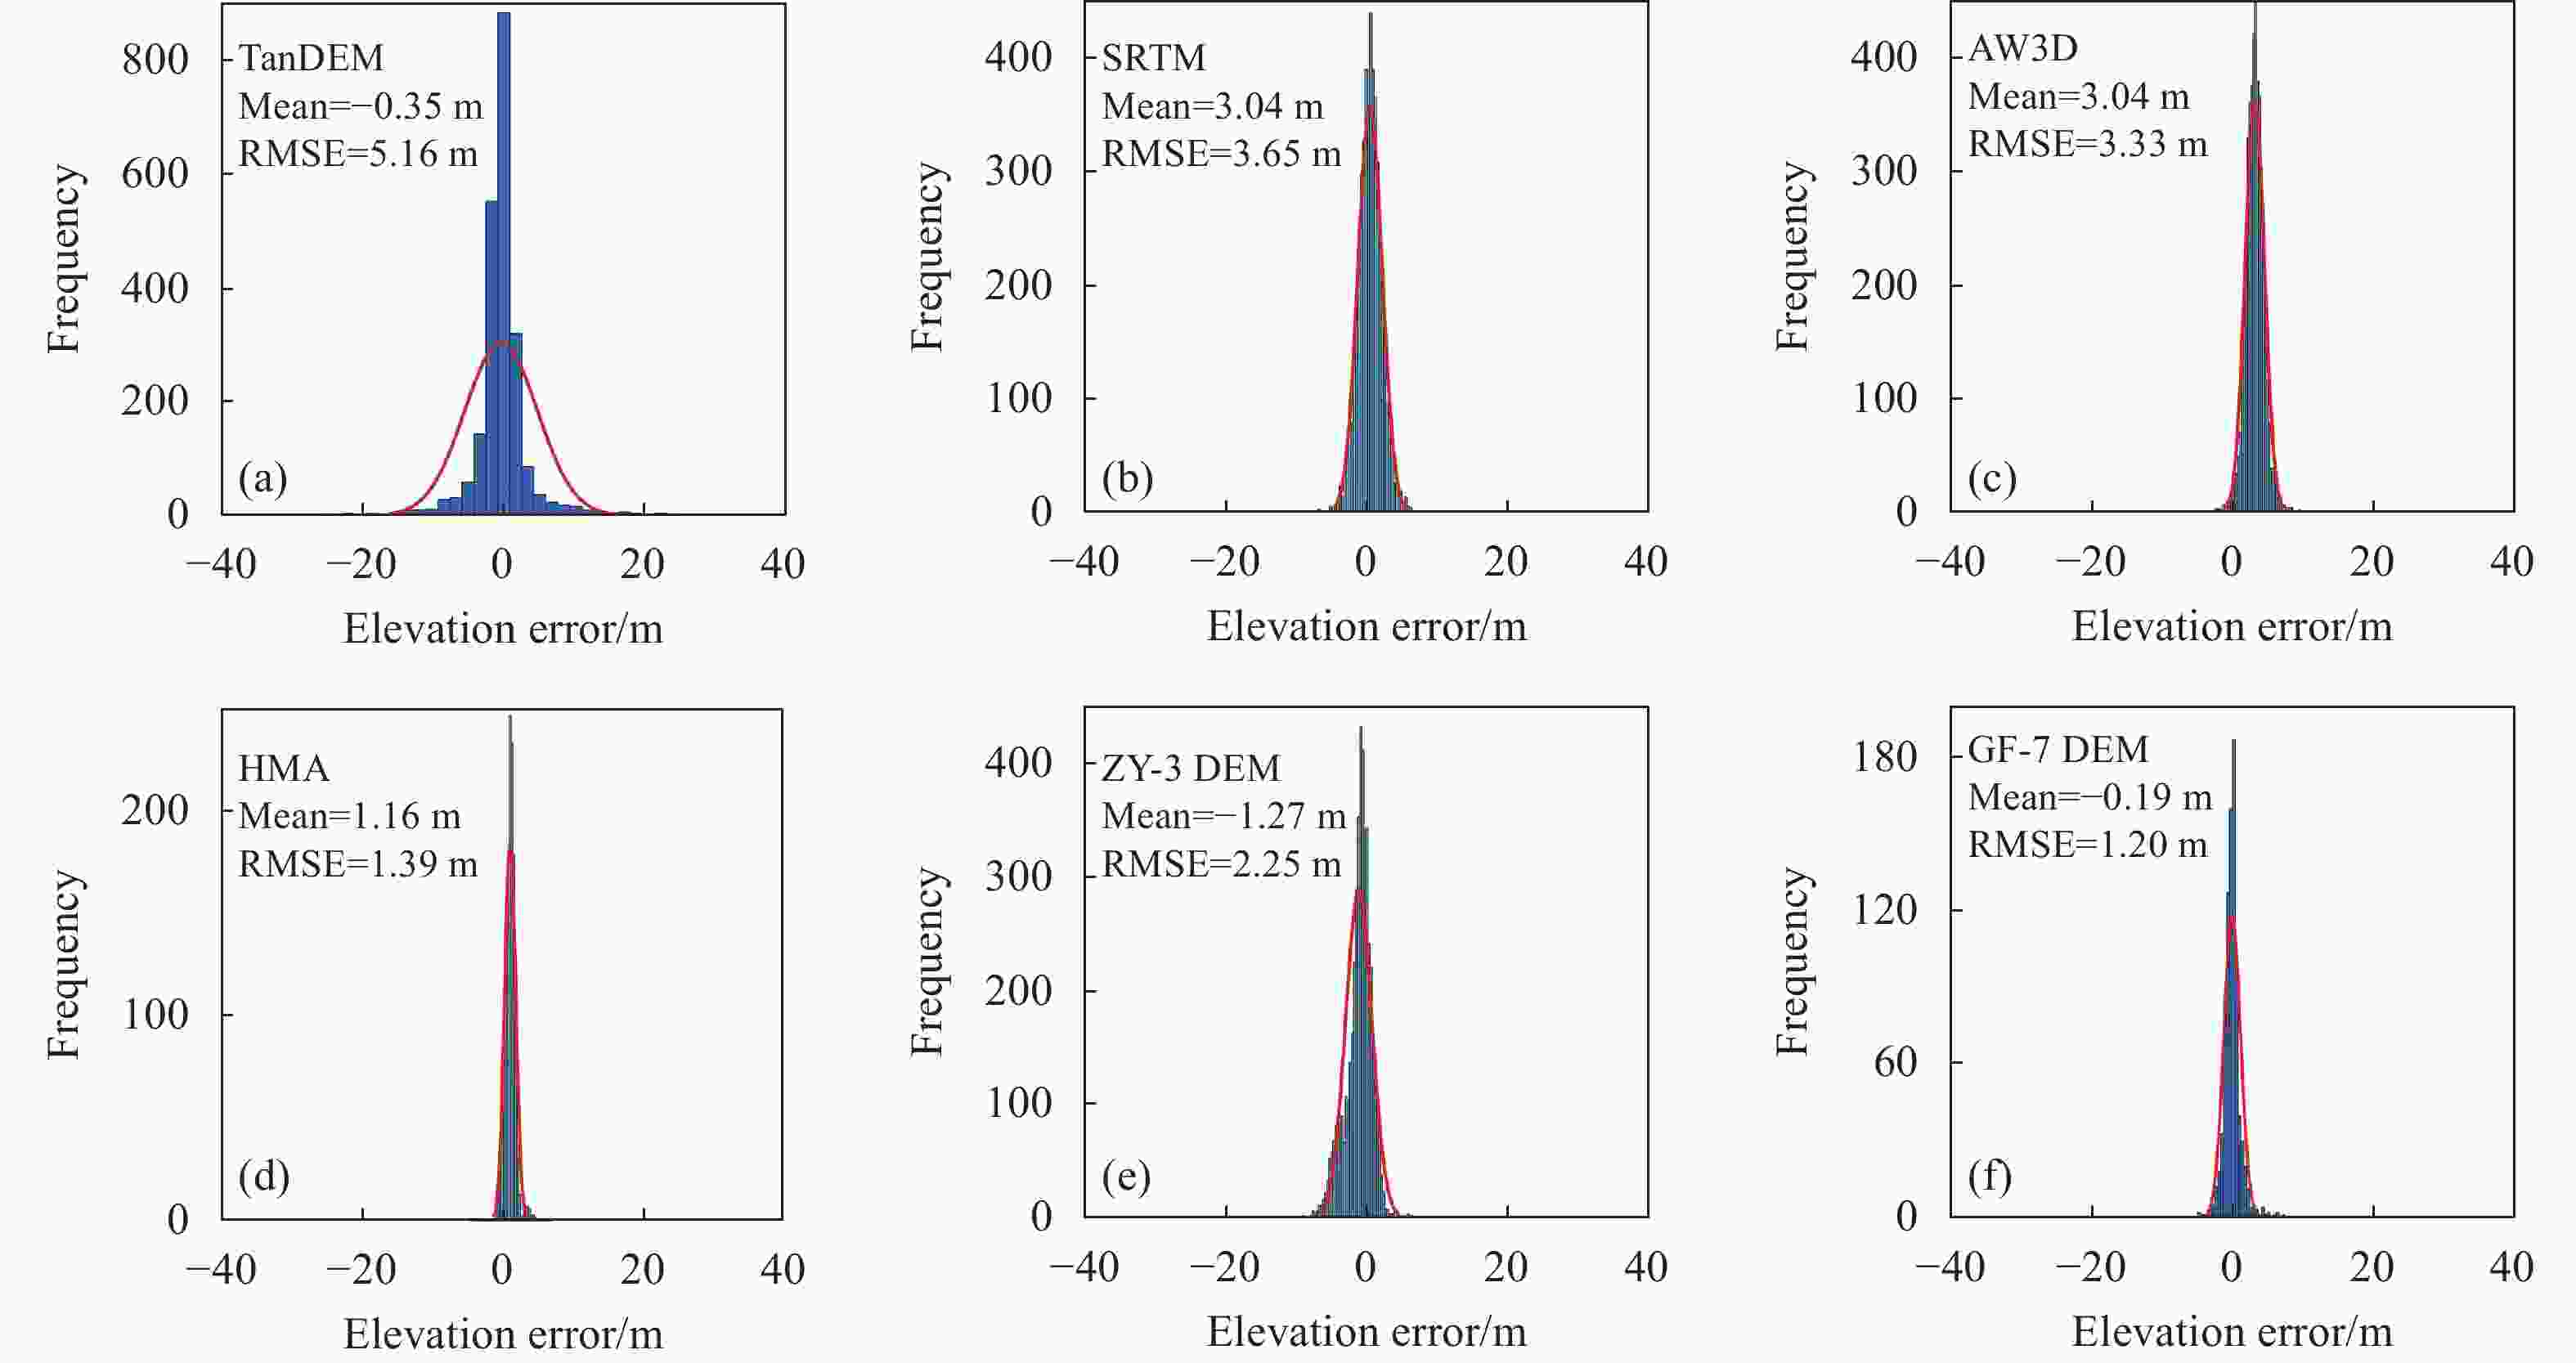
图 12 普若岗日区域六种DEM误差分布
Figure 12. Error distribution of six types of DEM in the Purogangri area
-
采用与DEM时相相同或非常接近的陆地冰表面高度数据ATL06对冰川区DEM进行验证,岗钦研究区相近时间无经过冰川区ATL06数据,此处验证为冰川附近区域。岗钦研究区验证点数据如图13、14所示,普若岗日研究区验证点数据如图15、16所示。

图 13 高分七号岗钦冰川DEM验证ATL06分布
Figure 13. Distribution of ATL06 in GF-7 Gangqin glacier DEM validation

图 14 资源三号岗钦冰川DEM验证ATL06分布
Figure 14. Distribution of ATL06 verified by DEM of ZY-3 Gangqin glacier

图 15 高分七号普若岗日冰川DEM验证ATL06点分布
Figure 15. Distribution of ATL06 points for DEM verification of GF-7 Purogangri glacier

图 16 普若岗日冰川资源三号DEM验证ATL06分布
Figure 16. Distribution of ATL06 verified by DEM of Puruogangri glacier ZY-3
1)岗钦冰川区DEM验证
岗钦冰川区DEM精度验证情况如表7所示。GF-7 DEM在0°~2°平地区RMSE值为0.63 m。ZY-3 DEM在0°~2°平地区RMSE值为1.62 m。不区分坡度地形从整体来看,GF-7 DEM的高程精度为0.92 m,ZY-3 DEM的高程精度为2.43 m。
2)普若岗日冰川区DEM验证
普若岗日冰川区DEM精度验证情况如表8所示。GF-7 DEM在0°~2°平地区RMSE值为0.98 m。ZY-3 DEM在0°~2°平地区RMSE值为3.47 m。在不考虑地形、坡度等因素,所有激光点都参与验证时,冰川区GF-7 DEM精度为2.8 m,ZY-3 DEM的精度为3.86 m。
表 7 岗钦冰川DEM激光验证结果
Table 7. DEM laser verification results of Gangqin glacier
Data source Evaluation parameters Slope/(°) All point 0°-2° 2°-6° 6°-25° >25° GF-7 DEM Points 177 1120 4049 664 6018 Mean/m 0.05 0.01 0.03 0.08 0.03 RMSE/m 0.63 0.67 0.83 1.62 0.92 ZY-3 DEM Points 378 2671 7799 1643 12491 Mean/m 1.43 1.27 0.96 0.70 1.00 RMSE/m 1.62 1.71 1.89 4.74 2.43 表 8 普若岗日冰川DEM激光验证结果
Table 8. DEM laser verification results of Purogangri glacier
Data source Evaluation parameters Slope/(°) All point 0°-2° 2°-6° 6°-25° >25° GF-7 DEM Points 331 2994 7857 1205 12416 Mean/m −0.05 0.25 0.52 1.11 0.51 RMSE/m 0.98 1.37 2.68 5.30 2.80 ZY-3 DEM Points 785 1780 6040 1542 12147 Mean/m −2.65 −2.61 −1.69 −0.58 −1.90 RMSE/m 3.47 3.52 3.53 5.66 3.86 -
文中首次系统地将国产激光测高产品与立体影像结合应用于冰川区DEM的生产,并与国外开源DEM进行了对比分析,为青藏高原冰川大规模高精度制图研究提供新思路。主要得到以下结论:
1)对实验区高分七号和资源三号DEM进行验证,结果表明冰川区高分七号DEM在坡度小于6°时精度优于1.5 m,总体精度优于2.8 m,资源三号DEM在坡度小于6°时精度优于3.5 m,总体精度优于5.0 m。国产卫星DEM均优于中等空间分辨率的开源DEM 数据(SRTM、AW3D、TanDEM),且冰川细节纹理特征更明显。
2)虽然HMA DEM采用优于0.61 m的立体影像生产,但国产高分七号卫星冰川区DEM高程精度优于HMA DEM。资源三号DEM略逊于HMA DEM精度,但相对于HMA数据覆盖稀疏且存在漏洞的缺点而言,国产立体影像生产的DEM精度可靠且数据覆盖更优。
国产立体测图卫星具有自主可控的优势,能够为青藏高原地区冰川科学研究提供稳定的数据,随着时间积累还可以形成长时间序列数据,更好地服务于青藏高原冰川变化监测。基于国产立体测图卫星开展青藏高原地区大规模的冰川三维制图与长时序监测分析将是下一步努力的方向。
Comparison and analysis of high precision DEM production and quality in typical glacier regions of domestic stereometric mapping satellites
-
摘要: 数字高程模型(Digital Elevation Model, DEM)是开展青藏高原冰川研究的重要基础数据。随着国产立体测图卫星的快速发展,自主可控地获取青藏高原冰川区高精度DEM成为可能。该研究综合采用资源三号、高分七号卫星的立体影像和激光测高数据,分别生成冰川区域5 m和2 m格网的DEM,并选择岗钦及普若岗日等两处冰川为实验区,将国产卫星DEM与国外的AW3D、SRTM、TanDEM、HMA DEM等多种开源数字高程模型进行对比分析,并采用ICESat-2星载激光测高数据开展DEM绝对高程精度验证。结果表明:与中等空间分辨率的开源DEM相比,基于国产立体测图卫星影像生产的DEM高程精度更优,且格网更精细、更能详细描述冰川末端纹理特征;与高空间分辨率数据集HMA DEM对比高程精度,资源三号DEM略差、高分七号DEM更优,且在覆盖完整性方面国产卫星DEM均优于HMA DEM。综上所述,基于国产立体测图卫星可以实现冰川区高精度DEM的获取,能够为青藏高原冰川研究提供自主可控、精度可靠的地形参考数据。Abstract:
Objective The glaciers on the Qinghai-Tibet Plateau are an important freshwater reserve resource in China. In the context of global warming, glaciers on the Qinghai-Tibet Plateau are generally in retreat, affecting China’s water resources reserves. Therefore, it is necessary to monitor changes in glaciers on the Qinghai-Tibet Plateau. The existing DEM (Digital elevation model) for complex terrain applications in the Qinghai-Tibet Plateau region have insufficient descriptions of glacier details or data gaps, which cannot reflect glacier characteristics well and are not suitable for monitoring elevation changes in mountain glaciers and small ice caps. This article is based on the autonomous and controllable production of high-precision and finer grid DEMs in the glacier area of the Qinghai-Tibet Plateau using domestic stereo mapping satellites. Methods When producing DEM using satellite remote sensing stereo images, field control points are often required. However, the research area is located in high mountain glacier areas, making it difficult for personnel to reach and collect control points. The GF-7 satellite laser altimetry data product has the characteristic of high elevation accuracy and can be used as elevation control points in complex terrain areas. The specific methods are as follows: Firstly, conduct preliminary screening of GF-7 laser points and select laser points in bare areas; Secondly, the matching algorithm based on phase correlation is used to determine the homonymous points of GF-7 laser points on the stereo image, establishing the connection between the laser points and the stereo image; Thirdly, establish the Affine transformation model between the laser point and the stereo image to realize the image square compensation of the stereo image, update the RPC (Rational Polynomial Coefficients, RPC) information of the stereo image, optimize the orientation parameters of the stereo image, and improve its stereo mapping accuracy; Finally, high-precision DEM is extracted through dense image matching to complete high-precision DEM extraction based on stereo images. Results and Discussions In the research area, comparing the elevation accuracy of domestic three-dimensional surveying satellite DEM with medium spatial resolution DEM, as shown in Tables 4 and 5, it was found through ATL08 laser point verification that GF-7 DEM has the highest elevation accuracy, followed by ZY-3 DEM, AW3D, SRTM, and TanDEM has the worst accuracy, with a maximum error of over 20 m. Verify its accuracy with high spatial resolution HMA (High Mountain Asia, HMA) DEM data. From the validation results in Tab. 6, it can be seen that the elevation accuracy of GF-7 DEM is superior to HMA DEM, and the accuracy of HMA DEM is higher than ZY-3 DEM. The main reason is the limitation of basic data source resolution. HMA originates from sub meter resolution images, so it has more advantages in accuracy compared to ZY-3 DEM. From the perspective of DEM coverage, GF-7 DEM and ZY-3 DEM have comprehensive coverage, while HMA data has many data holes and poor quality, especially in glacier regions with less data coverage. In terms of detailed description of the glacier end, due to the finer grids of GF-7 DEM, ZY-3 DEM, and HMA, they have more advantages compared to other large grids, and the detailed texture features are clearer. Conclusions Select laser data with similar collection times in the glacier area to verify the accuracy of GF-7 DEM and ZY-3 DEM. The accuracy of GF-7 DEM is better than 1.5 m when the slope is less than 6°, and the accuracy of ZY-3 DEM is better than 3.5 m when the slope is less than 6°. Both have high accuracy and can be applied to monitoring elevation changes in glacier areas. Domestic stereo mapping satellites have the advantage of being autonomous and controllable, providing stable data for glacier scientific research in the Qinghai-Tibet Plateau region. Over time, they can also form long-term time series data, better serving the monitoring of glacier changes in the Qinghai-Tibet Plateau. -
Key words:
- laser altimeter /
- glacier in Qinghai-Tibet Plateau /
- digital elevation model /
- GF-7 /
- ZY-3
-
图 1 同区域立体影像及激光足印影像。(a)、(b)立体影像;(c)激光足印影像
Figure 1. Stereoscopic images and laser footprint images of the same area. (a), (b) Stereoscopic images; (c) Laser footprint image
图 2 岗钦区域用于验证的ICESat-2/ATL08数据点分布
Figure 2. Distribution of ICESat-2/ATL08 data points used for validation in Gangqin area
图 3 普若岗日区域用于验证的ICESat-2/ATL08数据点分布
Figure 3. Distribution of ICESat-2/ATL08 data points used for validation in the Purogangri area
图 4 GF-7、ZY-3 DEM与其他源DEM均方根误差与地形的关系
Figure 4. Relationship between GF-7, ZY-3 DEM and other source DEM RMSE and terrain
图 5 HMA DEM与GF-7 DEM交集部分验证点分布
Figure 5. Distribution of verification points at the intersection of HMA DEM and GF-7 DEM
图 6 HMA DEM与ZY-3 DEM交集部分验证点分布
Figure 6. Distribution of verification points at the intersection of HMA DEM and ZY-3 DEM
图 7 岗钦研究区六种DEM山体阴影图。(a)岗钦研究区TanDEM;(b)岗钦研究区SRTM;(c)岗钦研究区AW3D;(d)岗钦研究区HMA;(e)岗钦研究区ZY-3 DEM;(f)岗钦研究区GF-7 DEM
Figure 7. Shadow map of six DEM mountains in Gangqin research area. (a) TanDEM of Gangqin research area; (b) SRTM of Gangqin research area; (c) AW3D of Gangqin research area; (d) HMA of Gangqin research area; (e) ZY-3 DEM of Gangqin research area; (f) GF-7 DEM of Gangqin research area
图 8 普若岗日研究区六种DEM山体阴影。(a)普若岗日研究区TanDEM;(b)普若岗日研究区SRTM;(c)普若岗日研究区AW3D;(d)普若岗日研究区HMA;(e)普若岗日研究区ZY-3 DEM;(f)普若岗日研究区GF-7 DEM
Figure 8. Six types of DEM mountain shadows in the Purogangri research area. (a) TanDEM of Purogangri research area; (b) SRTM of Purogangri research area; (c) AW3D of Purogangri research area; (d) HMA of Purogangri research area; (e) ZY-3 DEM of Purogangri research area; (f) GF-7 DEM of Purogangri research area
图 9 岗钦研究区六种DEM冰川末端地形特征。(a)岗钦研究区TanDEM冰川末端地形特征;(b)岗钦研究区SRTM冰川末端地形特征;(c)岗钦研究区AW3D冰川末端地形特征;(d)岗钦研究区HMA冰川末端地形特征;(e)岗钦研究区ZY-3 DEM冰川末端地形特征;(f)岗钦研究区GF-7 DEM冰川末端地形特征
Figure 9. Topographic characteristics of six DEM glacier ends in the Gangqin research area. (a) Topographic characteristics of TanDEM glacier ends in Gangqin research area; (b) Topographic characteristics of SRTM glacier ends in Gangqin research area; (c) Topographic characteristics of AW3D glacier ends in Gangqin research area; (d) Topographic characteristics of HMA glacier ends in Gangqin research area; (e) Topographic characteristics of ZY-3 DEM glacier ends in Gangqin research area; (f) Topographic characteristics of GF-7 DEM glacier ends in Gangqin research area
图 10 普若岗日研究区六种DEM冰川末端地形特征。(a)普若岗日研究区TanDEM冰川末端地形特征;(b)普若岗日研究区SRTM冰川末端地形特征;(c)普若岗日研究区AW3D冰川末端地形特征;(d)普若岗日研究区HMA冰川末端地形特征;(e)普若岗日研究区ZY-3 DEM冰川末端地形特征;(f) 普若岗日研究区GF-7 DEM冰川末端地形特征
Figure 10. Topographic characteristics of six DEM glacier ends in the Purogangri research area. (a) Topographic characteristics of TanDEM glacier ends in Purogangri research area; (b) Topographic characteristics of SRTM glacier ends in Purogangri research area; (c) Topographic characteristics of AW3D glacier ends in Purogangri research area; (d) Topographic characteristics of HMA glacier ends in Purogangri research area; (e) Topographic characteristics of ZY-3 DEM glacier ends in Purogangri research area; (f) Topographic characteristics of GF-7 DEM glacier ends in Purogangri research area
图 11 岗钦区域六种DEM误差分布
Figure 11. Error distribution of six types of DEM in the Gangqin area
图 12 普若岗日区域六种DEM误差分布
Figure 12. Error distribution of six types of DEM in the Purogangri area
图 13 高分七号岗钦冰川DEM验证ATL06分布
Figure 13. Distribution of ATL06 in GF-7 Gangqin glacier DEM validation
图 14 资源三号岗钦冰川DEM验证ATL06分布
Figure 14. Distribution of ATL06 verified by DEM of ZY-3 Gangqin glacier
图 15 高分七号普若岗日冰川DEM验证ATL06点分布
Figure 15. Distribution of ATL06 points for DEM verification of GF-7 Purogangri glacier
图 16 普若岗日冰川资源三号DEM验证ATL06分布
Figure 16. Distribution of ATL06 verified by DEM of Puruogangri glacier ZY-3
表 1 青藏高原地区开源数字高程模型产品基本参数
Table 1. Basic parameters of open-source digital elevation model products on the Qinghai-Tibet Plateau
Product name Release year Coverage of the
Qinghai-Tibet PlateauGrid
size/mHeight datum Elevation accuracy/m SRTM 2003 Void-free 30 EGM96 16 AW3D30 2016 Void-free 30 EGM96 5 TanDEM 2016 Void-free 90 WGS84 10 HMA 2017 Covering sparse 8 WGS84 5  下载: 导出CSV
表 2 数字高程模型精度要求
Table 2. Precision requirements for digital elevation model
Terrain category Slope/
(°)RMSE/m 5 m grid 10 m grid Flatland S<2 5 6 Hilly terrain 2≤S<6 5 6 Mountainous region 6≤S<25 8 10 Alpine land S≥25 10 13
下载: 导出CSV
表 3 实验区ATL08验证数据筛选情况
Table 3. Screening of ATL08 validation data in experimental area
Study area Longitude and latitude range Laser collection time Number of laser points after screening Gangqin 90.57°-90.88°E, 33.74°-34.18°N 2018.11.19-2022.3.22 1178 Puruogangri 88.78°-89.56°E, 33.62°-34.09°N 2018.12.26-2021.11.21 4605
下载: 导出CSV
表 4 岗钦研究区五种DEM高程精度验证
Table 4. Verification of five DEM elevation accuracy in Gangqin research area
Different DEMs Resolution ratio/m Evaluation parameters Slope (Verify points) All points 0°-2° 2°-6° 6°-25° >25° 168 528 473 9 1178 SRTM 30 Mean/m 2.13 2.17 2.27 −0.81 2.18 RMSE/m 2.55 2.65 3.54 6.22 3.06 AW3D30 DEM 30 Mean/m 3.43 3.18 2.94 1.51 3.1 RMSE/m 3.96 3.52 3.42 6.19 3.57 TanDEM 90 Mean/m 0.03 0.1 0.14 −3.53 0.08 RMSE/m 0.65 0.94 2.36 6.34 1.72 GF-7 DEM 2 Mean/m −0.21 −0.33 −0.31 0.83 −0.30 RMSE/m 0.58 0.73 0.84 2.35 0.77 ZY-3 DEM 5 Mean/m 0.03 0.05 0.34 1.58 0.13 RMSE/m 1.14 1.15 1.39 2.87 1.24
下载: 导出CSV
表 5 普若岗日研究区五种DEM高程精度验证
Table 5. Verification of the accuracy of five DEM elevations in the Purogangri research area
Different DEMs Resolution ratio/m Evaluation parameters Slope (Verify points) All points 0°-2° 2°-6° 6°-25° >25° 2254 1348 992 11 4605 SRTM 30 Mean/m 3.06 3.02 3.06 7.27 3.04 RMSE/m 3.93 3.54 4.26 11.87 3.65 AW3D DEM 30 Mean/m 2.98 2.97 2.98 4.01 3.04 RMSE/m 3.3 3.22 3.38 5.76 3.33 TanDEM 90 Mean/m −0.48 −0.17 −0.83 −7.62 −0.35 RMSE/m 6.69 4.84 8.30 23.12 5.16 GF-7 DEM 2 Mean/m −0.27 −0.26 0.01 1.79 −0.19 RMSE/m 0.76 0.92 2.43 2.54 1.20 ZY-3 DEM 5 Mean/m −1.32 −1.28 −1.37 −0.84 −1.27 RMSE/m 2.43 2.27 2.59 5.46 2.25
下载: 导出CSV
表 6 HMA DEM与GF-7、ZY-3 DEM的验证结果
Table 6. Validation results of HMA DEM and GF-7, ZY-3 DEM
Area Verification points/piece Different DEMs DEM grid/m Elevation accuracy/m Gangqin 470 HMA 8 Mean 1.68 RMSE 1.78 GF-7 DEM 2 Mean −0.54 RMSE 0.94 Puruogangri 1298 HMA 8 Mean 1.16 RMSE 1.39 ZY-3 DEM 5 Mean −2.24 RMSE 2.79
下载: 导出CSV
表 7 岗钦冰川DEM激光验证结果
Table 7. DEM laser verification results of Gangqin glacier
Data source Evaluation parameters Slope/(°) All point 0°-2° 2°-6° 6°-25° >25° GF-7 DEM Points 177 1120 4049 664 6018 Mean/m 0.05 0.01 0.03 0.08 0.03 RMSE/m 0.63 0.67 0.83 1.62 0.92 ZY-3 DEM Points 378 2671 7799 1643 12491 Mean/m 1.43 1.27 0.96 0.70 1.00 RMSE/m 1.62 1.71 1.89 4.74 2.43
下载: 导出CSV
表 8 普若岗日冰川DEM激光验证结果
Table 8. DEM laser verification results of Purogangri glacier
Data source Evaluation parameters Slope/(°) All point 0°-2° 2°-6° 6°-25° >25° GF-7 DEM Points 331 2994 7857 1205 12416 Mean/m −0.05 0.25 0.52 1.11 0.51 RMSE/m 0.98 1.37 2.68 5.30 2.80 ZY-3 DEM Points 785 1780 6040 1542 12147 Mean/m −2.65 −2.61 −1.69 −0.58 −1.90 RMSE/m 3.47 3.52 3.53 5.66 3.86
下载: 导出CSV
-
[1] Yao T, Wu G, Xu B, et al. Changes and impacts of the "Asian Water Tower" [J]. Bulletin of Chinese Academy of Sciences, 2019, 34(11): 1203-1209. [2] Zhang Y, Zhang J, Wu H, et al. A study on glacier changes in the Nyingchi Region of Tibet from 1990 to 2000 [J]. Journal of Glaciology and Geocryology, 2011, 33(1): 14-20. (in Chinese) doi: 10.7522/j.issn.1000-0240.2011.0004 [3] Li Z, Yao T, Tian L, et al. Progress in the research on the impart of Glacial change on water resources [J]. Journal of Natural Resources, 2008, 23(1): 1-8. [4] Wu G, Yao T, Wang W, et al. Glacial hazards on Tibetan Plateau and surrounding alpines [J]. Bulletin of Chinese Academy of Sciences, 2019, 34(11): 1285-1292. [5] Rodriguez E, Morris C S, Belz J E, et al. An assessment of the SRTM topographic products, Technical Report JPL D-31639[R]. USA: JPL, NASA, 2005. [6] Tadono T, Nagai H, Ishida H, et al. Generation of the 30 M-mesh global digital surface model by alos prism [J]. The International Archives of the Photogrammetry, 2016, 156: 157-62. [7] Wessel B. TanDEM-X ground segment–DEM products specification document[C]//EOC, DLR, Oberpfaffenhofen, Germany, Public Document, 2016. [8] Shean D E. High-resolution DEMs for high-mountain Asia: A systematic, region-wide assessment of geodetic glacier mass balance and dynamics[C]//AGU Fall Meeting Abstracts, 2017. [9] Wang Y, Chen X, Bai Y, et al. Monitoring glacier volume change based on multi-source DEM and multi-temporal remote sensing image—a case study in the Mount Naimona’nyi Region on the Tibetan Plateau [J]. Journal of Glaciology and Geocryology, 2010, 32(1): 126-132. (in Chinese) doi: 10.7522/j.issn.1000-0240.2010.0017 [10] Huang X. Analysis of the changes in the surface elevation and mass balance of the gongga mountain glacier in the past 50 years based on multi-temporal DEM[D]. Chengdu: Southwest Jiaotong University, 2021. (in Chinese) [11] Wang J. Change of glacier volume based on multi-source digital elevation model over the Qilian Mountain during the last 50 years[D]. Ji’nan: Shandong Normal University, 2021. (in Chinese) [12] Ji X, Ye Q, Nie W, et al. Glacier surface elevation change in southeastern Mt. Kangri Karpo on Tibet during 2000-2014 based on TerraSAR/TanDEM-X data [J]. Mountain Research, 2021, 39(5): 631-645. [13] Berthier E, Toutin T. SPOT5-HRS digital elevation models and the monitoring of glacier elevation changes in North-West Canada and South-East Alaska [J]. Remote Sensing of Environment, 2008, 112: 2443-2454. [14] Kääb A. Glacier volume changes using ASTER optical stereo [C]//IEEE International Geoscience and Remote Sensing Symposium (IGARSS), 2007: 3994-3996. [15] Zong Jibiao,Ye Qinghua, Tian Lide. Recent Naimona'Nyi glacier surface elevation changes on the Tibetan Plateau based on ICESat/GLAS, SRTM DEM and GPS measurements [J]. Chinese Journal Bulletin, 2014, 59(21): 2108-2118. doi: 10.1360/972013-1243 [16] E D, Shen Q, Meng Y, et al. DEM Generation and analysis of fildes peninsula using IKONOS stereo pairs [J]. Chinese Journal of Polar Research, 2007, 19(4): 266-274. [17] Zhang X, Zhou J, Liu Z, et al. DEM extraction and precision evaluation of mountain glaciers in the Qinghai-Tibet Plateau based on KH-9 data: Take the Purog Kangri Glacier and the Jiong Glacier as example [J]. Journal of Glaciology and Geocryology, 2019, 41(1): 27-35. (in Chinese) doi: 10.7522/j.issn.1000-0240.2019.0005 [18] Li G, Tang X, Chen J, et al. Processing and preliminary accuracy validation of the GF-7 satellite laser altimetry data [J]. Acta Geodaetica et Cartographica Sinica, 2021, 50(10): 1338-1348. [19] Gao X, Li G, Guo J, et al. Discussion on the development of laser altimetry satellite for tri-polar regions observation [J]. Infrared and Laser Engineering, 2020, 49(11): 20200233. (in Chinese) [20] Zhang S. Preliminary study on glacier elevation change monitoring based on multi-source satellite remote sensing data[D]. Lanzhou: Lanzhou Jiaotong University, 2022. (in Chinese) [21] Tang X, Wang H, Zhu X, et al. Technology and applications of surveying and mapping for ZY-3 satellites [J]. Acta Geodaetica et Cartographica Sinica, 2017, 46(10): 1482-1491. [22] Li G, Gao X, Chen J, et al. Data quality analysis of ZY-3 02 satellite laser altimeter [J]. National Remote Sensing Bulletin, 2019, 23(6): 1159-1166. doi: 10.11834/jrs.20197548 [23] Tang Xinming, Liu Changru, Zhou Ping, et al. Satellite-imagery geometric accuracy improvement based on direct correction of dominant coefficients [J]. Photogrammetric Engineering and Remote Sensing, 2020, 86(4): 215-224. doi: 10.14358/PERS.86.4.215 [24] Fsrr G T, Rosen P A, Caro E, et al. The shuttle radar topography mission [J]. Reviews of Geophysics, 2007, 45(2): 1-33. [25] Courty L G, Soriano-monzalvo J C, Pedrozo-acuña A. Evaluation of open-access global digital elevation models (AW3D 30 m, SRTM, and ASTER) for flood modelling purposes [J]. Journal of Flood Risk Management, 2019, 12(S1): e12550. doi: 10.1111/jfr3.12550 [26] Yuan X, Li G, Gao X, et al. Evaluation of AW3D 30 m DSM data elevation quality and precision validation of typical region [J]. Geomatics & Spatial Information Technology, 2018, 41(4): 98-101. [27] Neuenschwander A, Magruder L. Canopy and terrain height retrievals with ICESat-2: A first look [J]. Remote Sensing, 2019, 11(14): 1721-1731. doi: 10.3390/rs11141721 [28] Fang Y, Cao B, Gao L, et al. Development and application of lidar mapping satellite [J]. Infrared and Laser Engineering, 2020, 49(11): 20201044. (in Chinese) [29] Brunt K M, Neumann T A, Smith B E. Assessment of ICESatIce sheet surface heights, based on comparisons over the interior of the antarctic ice sheet [J]. Geophysical Research Letters, 2019, 46(22): 13072-13078. doi: 10.1029/2019GL084886 [30] Dandabathula G, Verma M, Sitiraju S R. Evaluation of best-fit terrain elevation of ICESat-2 ATL08 using DGPS surveyed points [J]. Journal of Applied Geodesy, 2020, 14(3): 285-293. doi: 10.1515/jag-2020-0003 [31] Luo Y, Qin N, Pang Y, et al. Effect of climate warming on the runoff of source regions of the Yangtze river: Take tuotuo river basin as an example [J]. Journal of Glaciology and Geocryology, 2020, 42(3): 952-964. (in Chinese) doi: 10.7522/j.issn.1000-0240.2020.0069 [32] Yao T. Discovery of the purogangri ice sheet in the central Qinghai-Tibet Plateau and its scientific significance [J]. Journal of Glaciology and Geocryology, 2000, 22(1): 2. (in Chinese) [33] Tang X, Xie J, Mo F, et al. GF-7 dual-beam laser altimeter on-orbit geometric calibration and test verification [J]. Acta Geodaetica et Cartographica Sinica, 2021, 50(3): 384-395. [34] Tang X, Liu C, Zhang H, et al. GF-7 Satellite stereo images block adjustment assisted with laser altimetry data [J]. Geomatics and Information Science of Wuhan University, 2021, 46(10): 1423-1430. (in Chinese) [35] Liu C, Tang X, Zhang H, et al. Geopositioning improvement of ZY-3 satellite imagery integrating GF-7 laser altimetry data [J]. IEEE Geoscience and Remote Sensing Letters, 2022, 19: 1-5. [36] Chen J, Tang X, Xue Y. Registration and combined adjustment for the Laser altimetry data and high-resolution optical stereo images of the GF-7 satellite [J]. Remote Sens, 2022, 14(6): 1666-1685. [37] Li Guoyuan, Tang Xinming, Gao Xiaoming, et al. ZY-3 block adjustment supported by GLAS laser altimetry data [J]. The Photogrammetric Record, 2016, 31(153): 88-107. doi: 10.1111/phor.12138 [38] Li Guoyuan, Tang Xinming, Gao Xiaoming, et al. Integration of ZY3-02 satellite laser altimetry data and stereo images for high accuracy mapping [J]. Photogrammetric Engineering and Remote Sensing, 2018, 84(9): 569-578. doi: 10.14358/PERS.84.9.569 [39] Zhou P. Key technology of high precision geometric processing and evaluation of mapping efficiency for ZY-3 remote sensing image[D]. Wuhan: Wuhan University, 2016. (in Chinese) [40] Wang P, Xu Y. Photogrammetry: Surveying and Mapping Engineering[M]. Wuhan: Wuhan University Press, 2005. (in Chinese) [41] Li D, Zhang G, Jiang W, et al. SPOT-5 HRS Satellite imagery block adjustment without GCPS or with single GCP [J]. Geomatics and Information Science of Wuhan University, 2006, 31(5): 377-381. (in Chinese) [42] Zhang J. Quality evaluation of typical open DEM based on satellite laser altimetry data[D]. Ganzhou: Jiangxi University of Science and Technology, 2021. (in Chinese) [43] Global Geographic Information Resource Data Product Specification[S]. CH/T 9032—2022. SinoMaps Press, 2022. [44] Li B, Xie H, Liu S, et al. A method of extracting high-accuracy elevation control points from ICESat-2 altimetry data [J]. Photogrammetric Engineering & Remote Sensing, 2021, 87(11): 821-830. -

 点击查看大图
计量
- 文章访问数: 97
- HTML全文浏览量: 44
- PDF下载量: 50
- 被引次数: 0

