


-
随着遥感图像的广泛应用,用户对图像的定位精度要求越来越高。其中无控制点定位精度(在无地面控制点条件下进行地面目标坐标计算精度)成为光学遥感器的重要指标能力[1-2]。国外遥感卫星中,从2001年发射的Quick Bird全色分辨率0.61 m、无控定位精度23 m(CE90)[3],迅速发展到2007年发射的WorldView-1的全色分辨率0.46 m,无控定位精度4 m(CE90),到2014年发射的WorldView-3达到了无控定位精度3.1 m (CE90)[4]的指标。国内2010年发射的天绘一号01星达到了15.2 m (CE90)的无控定位精度[5],2012年发射的资源三号无控定位精度也在该量级[6]。
制约无控定位精度的因素主要有星敏感器的测量精度[7]、相机载荷内方位元素稳定性以及相机视轴与星敏感器成像基准相对指向的稳定性。国外的测绘卫星均进行了视轴稳定性设计,如日本2006年发射的先进陆地观测卫星-1(ALOS-1)[8],以及美国近几年发射的具有立体测绘能力的世界观测 (WorldView)系列遥感卫星[9]等,主要采用星敏感器与相机一体化布局、应用低膨胀结构材料等措施提高系统稳定性[10],但未见系统反映其视轴稳定性设计、分析及验证方法的技术文献。国内目前对视轴稳定性也越来越重视,资源三号要求三台相机间的夹角半年内变化不超过0.8″[11],而且资源三号、高分二号均采取了星敏相机一体化布局的方式来提高稳定性[12-13]。
很多相机在设计之初只有一个无控定位精度指标或视轴稳定性总体指标,目前公开发表的视轴稳定性相关文献很少,且未有公开的基于顶层设计的视轴指标分解设计方法。文中利用线性光学理论,以某相机为例,使用CODEV得到了光学系统的视轴灵敏度矩阵。在此基础上,使用蒙特卡洛法将相机视轴系统稳定性指标分解到了主镜、次镜三镜等各部组件。
-
无控定位精度常用CE90来表示。无控定位精度3.5 m (CE90)即在N次测量后,定位精度达到3.5 m的圆概率为90%,如图1所示。无控定位精度主要受定轨精度、星敏测量精度、视轴(Line of Sight, LOS)稳定度、星敏指向稳定度影响,这里只讨论与相机相关的视轴稳定度。

图 1 3.5 m (CE90)定位精度概率示意图
Figure 1. Schematic diagram of 3.5 m (CE90) positioning accuracy
相机对无控定位精度的误差贡献主要来自视轴稳定度。定位精度和视轴稳定度关系可用如下公式来计算:
$$ {{d}} \approx H\times\theta $$ (1) 式中:d为视轴稳定度带来的定位精度误差;$ \theta $为视轴的变化角;H为卫星的高度。
视轴稳定度主要和微振动、在轨热学环境以及在轨湿气解析附有关。在轨湿气解析附是指地面上复合材料由于吸湿膨胀,材料发生尺寸变化,在轨时由于真空环境,湿气缓慢逸散,造成在轨时材料的尺寸再次发生变化。但随着水汽不断逸散,尺寸最终会稳定在一个最终值。因此,湿气解析附只在初期影响光轴稳定性。微振动则影响短期稳定度,真正影响全周期的视轴长期稳定性主要为温度波动。为保证视轴稳定性,光机主体一般需要精密的热控要求。
传统的热光学指标实现方法为正向迭代设计,相机主体设计完成后,施加热载荷,将相机的热位移代入到光学软件中计算视轴是否满足要求,若不满足要求,相应地修改热控精度;或者修改组件设计,直到相机设计满足要求。
正向迭代设计的过程比较复杂,迭代周期长,而且往往指导热控时有不必要的余量浪费。依据视轴灵敏度矩阵为转换核心,利用蒙特卡洛法分解视轴指标到各光学元件,流程如图2所示。
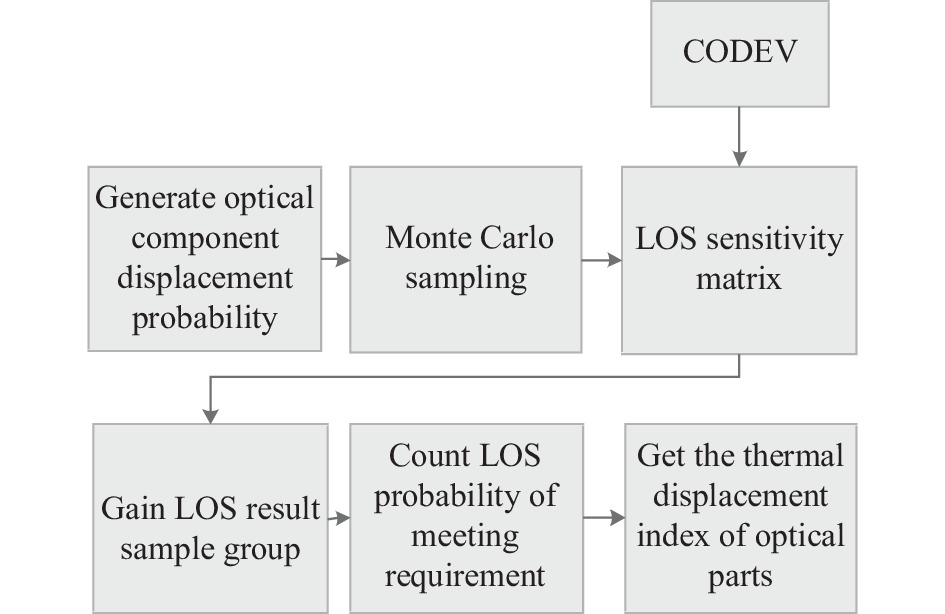
图 2 热位移指标分解示意图
Figure 2. Thermal displacement index decomposition process
-
某相机光学模型如图3所示,主要由主镜、次镜、三镜组成,X轴为弧矢方向,垂直YZ平面向内,Y轴为子午方向,弧矢方向和子午方向的光学特性会有差别。忽略光学系统的高阶影响,光学系统模型能够用入瞳光线穿过系统到出瞳静态参考面的光程矩阵L的一阶泰勒展开描述[14-15]:
$$ L = {L_0} + \frac{{\partial L}}{{\partial U}}\Delta U $$ (2) 式中:$ {L_0} $为系统不受影响时的设计视轴;$ \Delta U $为各光学元件在外界作用下的平移和转动量,也称作摄动;$ \dfrac{{\partial L}}{{\partial U}} $为L对U的一阶偏导数,这里也是视轴敏感度矩阵。

图 3 某相机光学模型
Figure 3. Optical model of a camera
根据公式(2),敏感度矩阵可以将光学元件的刚体位移转化为探测器处的像移,实现结构模型与光学模型间的数据交换。热载荷造成的光学元件的位移变化可以认为是小角度位移,根据理想光学线性系统理论,当光学元件发生小角度位移时,每个光学元件位移造成的系统视轴变化被认为是独立且线性的,单独给出每个光学元件的六自由度位移对视轴的影响,可以得到视轴灵敏度矩阵。
视轴运动一般有两个方向,子午方向和弧矢方向。表1给出了利用CODEV计算得到的该相机的视轴灵敏度矩阵,该矩阵作为光学元件六自由度运动与视轴之间的数据桥梁。表中数据代表光学元件每微米或者每角秒的变化带来的视轴变化角。
该矩阵可记录为L:
$$ {\boldsymbol{L}} = \left[ \begin{array}{*{20}{c}} { - 0.33}&0&0&0&{ - 2}&0&{0.25}&0&0&0&{0.48}&0&{0.13}&0&{0.01}&0&{0.38}&0 \\ 0&{ - 0.33}&0&3&0&0&0&{0.25}&0&{ - 0.45}&0&0&0&{0.133}&0&{ - 0.35}&0&{ - 0.01} \end{array} \right] $$ 式中:第一行为子午方向的主镜、次镜、三镜和视轴的灵敏度;第二行为弧矢方向的主镜、次镜、三镜和视轴的灵敏度。
表 1 视轴与各部件六自由度位移敏感度矩阵 (单位:(″)/μm或(″)/s)
Table 1. LOS-six degrees of freedom displacement sensitivity matrix of each component (Unit: (″)/μm or (″)/s)
Direction Component TX TY TZ RX RY RZ Meridian PM −0.33 0 0 0 −2 0 SM 0.25 0 0 0 0.488 0 TM 0.134 0 0.01 0 0.348 0 Sagittal PM 0 −0.33 0 2 0 0 SM 0 0.25 0 −0.45 0 0 TM 0 0.133 0 −0.35 0 −0.01 -
蒙特卡洛法由美国数学家冯·诺伊曼提出,也称统计模拟方法,是指使用随机数来解决计算问题的方法。其主要步骤如下:
1)构造概率过程。对于本身就具有随机性质的问题,主要是正确描述和模拟这个概率过程。对于不是随机性质的确定性问题,必须构造一个人为的概率过程,其某些参量正好是所要求问题的解,即将不具有随机性质的问题转化为随机性质的问题。
2)实现从已知概率分布抽样。构造概率模型后,由于各种概率模型都可以看作是由各种各样的概率分布构成的,产生已知概率分布的随机变量,成为实现蒙特卡洛方法模拟实验的基本手段。最基本的概率分布是(0, 1)的均匀分布。
3)建立各种估计量。一般来说,构造概率模型并能从中抽样后,即实现模拟实验后,需要确定随机变量的估计值作为所求问题的解。
文中为了将视轴热稳定度指标分解到各个反射镜,就以各反射镜的六自由度位移作为参量,将六自由度参量的值作为随机量。主镜三个平动位移分别记为:TXPM、TYPM、TZPM,三个转动位移分别记为RXPM、RYPM、RZPM,次镜三个平动位移分别记为:TXSM、TYSM、TZSM,三个转动位移分别记为RXSM、RYSM、RZSM,三镜三个平动位移分别记为:TXTM、TYTM、TZTM,三个转动位移分别记为RXTM、RYTM、RZTM,共18个变量,该变量形成矩阵U。
$$ \begin{split} {\boldsymbol{U}}=&[ TX_{{\rm{PM}} }\;TY_{{\rm{PM}}}\; TZ_{{\rm{PM}}}\; RX_{{\rm{PM}}} \;RY_{{\rm{PM}}} \;RZ_{{\rm{PM}}}\;TX_{{\rm{SM}} }\;TY_{{\rm{SM}}}\;TZ_{{\rm{SM}}} \\ & RX_{{\rm{SM}}}\; RY_{{\rm{SM}}}\; RZ_{{\rm{SM}} }\;TX_{{\rm{TM}}} \;TY_{{\rm{TM}}}\; TZ_{{\rm{TM}}} \;RX_{{\rm{TM}}} \;RY_{{\rm{TM}}}\; RZ_{{\rm{TM}}}]^{{\rm{T}}} \end{split} $$ 相机两个方向的视轴变化可记为:
$${\boldsymbol{ LOS}}={\boldsymbol{L}}\times {\boldsymbol{U}} $$ 式中:LOS为视轴子午、弧矢两个方向的位移矩阵。
每个光学系统的L是固定的,为构造概率过程,求解光学元件六自由度位移的许用值,将矩阵U的每个变量视为在许用值内的均匀分布。例如:主镜TXPM在许用值TPM*[−1, 1]内视为均匀分布,构造出N个值;次镜TXSM在许用值TSM*[−1, 1]内视为均匀分布,同样构造出N个值,以此类推。18个参数能构造出N18个视轴的统计结果。
视轴的系统指标许用是已知的,在构造数据中满足要求的概率可以经由统计得到。构造的N数量越多,计算越准确。
不断调整18个参数许用值的大小,可以得到满足指标的光学元件许用值。
-
分解到某相机的无控定位精度指标为1.5 m (CE90),根据公式(1),计算得到视轴的变化许用值为0.6″。考虑到余量,视轴稳定度指标定为0.45″ (CE90)。
由表1可以看出,不同光学元件的位移对视轴的影响是不等价的,总体来看,主镜的六自由度位移对光轴的变化影响最大,主次、三镜的单位角位移影响光轴的权重比接近10∶2∶1,平动位移影响光轴的权重比接近3∶2∶1。
考虑到不同元件位移对光轴变化的影响程度不同,采用相反的权重比例分解到各光学元件的热稳定度公差,影响大的位移公差更小,即平动许用值TPM∶TSM∶TTM取1∶2∶3;RPM∶RSM∶RTM取1∶2∶10。
经过蒙特卡洛法追迹也验证了权重分配的合理性。例如:图4(a)中主镜热环境下0.1″许用角位移、次镜热环境下0.2″许用角位移、三镜热环境下2″许用角位移位移(此时主镜、次镜、三镜权重为1∶2∶20)时,随机视轴变化位于[−0.45″ 0.45″]的概率为77.9%;图4(b)将三镜热位移公差从2″提高到1″(此时主镜、次镜、三镜权重为1∶2∶10)时,随机视轴变化位于[−0.45″ 0.45″]的概率可提高到92% (1000次蒙特卡洛法追迹);但图4(c)再将三镜热位移公差提高1倍到0.5 s,视轴变化位于[−0.45″ 0.45″]的概率只能提高到95.5%,提升效率大为降低。因此,按照光学灵敏度的权重分配光学元件热位移公差是比较合理的。

图 4 不同权重比下满足指标的概率
Figure 4. Probability of meeting indicators under different weight ratios
按照视轴变化落入[−0.45″ 0.45″]的概率为90%计算,可分配到各个光学元件的热位移公差如表2所示。
表 2 不同光学元件的热位移许用值
Table 2. Allowable values of thermal displacement for different optical components
Component TX/μm TY/μm TZ/μm RX/(″) RY/(″) RZ/(″) PM 0.76 0.76 13 0.1 0.1 5 SM 1.5 1.5 20 0.4 0.4 5 TM 2.5 2.5 25 0.8 0.8 5 -
按照表2设计许用值指导设计,得到的各反射镜设计结果如表3所示。可见相同的支撑设计下,由于三镜的要求更宽,口径更小,三镜的控温指标要求也更低。
表 3 各部件设计结果
Table 3. Design results of each component
Component Temperature
range/℃Maximum displacement TX/
μmTY/
μmTZ/
μmRX/
(″)RY/
(″)RZ/
(″)PM 20±1 0.5 0.51 0.66 0.08 0.07 0.08 SM 20±2 1.2 1.2 0.8 0.3 0.31 0.4 TM 20±5.5 2.2 2.1 2.5 0.7 0.6 0.9 为验证指标分解的准确性,建立有限元模型,按照最大温度变形施加热载荷,得到相机的热变形云图如图5所示(显示变形量调至实际变形量的3000倍以获得明显的变形趋势),蓝色部分为热变形前,彩色部分为热变形后。可见,相机的热变形使得其机械轴线发生了明显变化,相机整体产生了低头。为评估光学变化,将热变形导入到光学系统中,得到视轴的变化量为±0.41″,完全满足±0.45″的指标,证明指标分解可以有效指导部组件设计,并最大程度地减少无效的热控余量。

图 5 某相机的热变形
Figure 5. Thermal deformation of a camera
-
为了解决复杂相机无控定位精度指标分解到光学部组件的问题,利用小角度下的线性光学系统理论,提出了以视轴和光学元件的灵敏度矩阵为核心的蒙特卡洛分解法。通过构造各光学元件的公差概率分布,统计完成视轴指标满足CE90的概率来最终确定光学元件的位移。对某相机进行了指标分解,结果表明,主镜、次镜、三镜的指标随着灵敏度的增加,其许用值成反比例的设置为最优结果。根据分解结果设计的三镜,其温控公差相比其他两镜明显更大。最后,利用有限元仿真的方法验证了指标分解的准确性,结果表明,指标分解可以有效指导部组件设计,并最大程度地减少无效的热控余量。所提出的分解方法可为其他相机的分析提供借鉴。
Research on decomposition method of camera LOS thermal stability index based on Monte Carlo method
-
摘要: 随着用户对定位精度的要求越来越高,遥感器对视轴稳定性的要求指标也越来越高。随着相机系统复杂性的提高,部组件设计完毕后复算视轴稳定性的迭代设计方法越来越不可取。为将视轴稳定性指标分解到部组件,利用线性光学理论,以某相机为例,使用CODEV得到光学系统的视轴灵敏度矩阵。在此基础上,使用蒙特卡洛法将相机总体视轴稳定性指标分解到了各部组件。结果表明,若要视轴保持0.45″(CE90)的稳定性指标,主镜、次镜、三镜应分别保证最大平移不超过0.76、1.5、2.5 μm,最大角位移不超过0.1″、0.4″、0.8″。最后,根据设计后的相机模型复算了相机视轴稳定性,结果表明满足总体指标。该方法可为复杂遥感器设计之初的视轴稳定性指标分解提供参考。Abstract:
Objective With the wide application of remote sensing image, users are increasingly demanding for position accuracy, so the stability of the line of sight (LOS) for remote sensor is more and more important. On the other hand, as camera system complexity increases, the iterative method of components' designing and modeling again and again is increasingly unable to meet the requirements of design. The stability of the LOS is a key indicator for the decomposition of overall into components in the remote camera. At present, many camera designs only have a uncontrolled positioning accuracy index or overall LOS stability index at the beginning, and there is no publicly available LOS index decomposition design method based on top-level design. To improve the efficiency of camera design and reduce design iterations, a Monte Carlo method is proposed to decompose the thermal stability index of the camera's line of sight. Methods Using the linear optical theory and taking a certain camera as an example, CODEV is used to obtain the visual axis sensitivity matrix of the optical system (Tab.1). On this basis, in order to decompose the LOS thermal stability index into various mirrors, the six degree of freedom displacement values of each mirror are regarded as random quantities, and each random quantity is regarded as a uniform distribution within the allowable value, constructing a large displacement distribution of the mirror. Multiplying the displacement and axis of sight sensitivity matrix, countless LOS results are calculated. The allowable use of LOS system indicators is known, and the probability of meeting the requirements in the constructed data can be obtained through statistics. The more constructs, the more accurate the calculation. By continuously adjusting the allowable value of the six degrees of freedom displacement of the reflector, the allowable value of optical components that meet the indicators can be obtained, thus decomposing the overall stability index of the camera's visual axis into various components such as primary mirror, secondary mirror, and tertiary mirror. Results and Discussions According to the LOS sensitivity matrix of a certain camera (Tab.1), it can be seen that the influence of displacement of different optical components on the optical axis is not equivalent. Overall, the six degree of freedom displacement of the primary mirror has the greatest impact on the change of the optical axis. The weight ratio of the unit angular displacement of the primary mirror, secondary mirror, and tertiary mirror on the optical axis is close to 10∶2∶1, and the weight ratio of the translation displacement on the optical axis is close to 3∶2∶1. It is more reasonable to decompose the opposite weight ratio into the thermal stability tolerance of each optical element. The rationality of weight allocation was also verified through Monte Carlo tracing. The probability of a random LOS change at [−0.45″ −0.45″] is 77.9% when the weight of the primary mirror, secondary mirror, and tertiary mirror is 1∶2∶20. When the weight is 1∶2∶10, the probability can be increased to 92%. However, by doubling the thermal displacement tolerance of the tertiary mirror to 0.5 seconds, the probability can only be increased to 95.5% when the weight of the primary and secondary mirrors is 1∶2∶5, greatly reducing the efficiency of improvement. Conclusions In order to solve the problem of decomposing the accuracy index of complex camera uncontrolled positioning into optical components, a Monte Carlo decomposition method based on the sensitivity matrix of the line of sight was proposed using the theory of linear optical systems at small angles. By constructing the tolerance probability distribution of each optical element and calculating the probability of achieving CE90 for the axis of sight index, the displacement of the optical element is ultimately determined. A certain camera underwent indicator decomposition, and the results showed that as the sensitivity increased, the indicators of the primary, secondary, and tertiary mirrors were set in inverse proportion to the optimal result. The temperature control tolerance of the tertiary mirror designed based on the decomposition results is significantly larger than the other two mirrors. Finally, this article validated the accuracy of indicator decomposition using finite element simulation, and the results showed that indicator decomposition can effectively guide the design of component components and minimize ineffective thermal control margins to the greatest extent. -
Key words:
- camera /
- line of sight /
- stability /
- sensitivity matrix /
- Monte Carlo
-
图 1 3.5 m (CE90)定位精度概率示意图
Figure 1. Schematic diagram of 3.5 m (CE90) positioning accuracy
图 4 不同权重比下满足指标的概率
Figure 4. Probability of meeting indicators under different weight ratios
表 1 视轴与各部件六自由度位移敏感度矩阵 (单位:(″)/μm或(″)/s)
Table 1. LOS-six degrees of freedom displacement sensitivity matrix of each component (Unit: (″)/μm or (″)/s)
Direction Component TX TY TZ RX RY RZ Meridian PM −0.33 0 0 0 −2 0 SM 0.25 0 0 0 0.488 0 TM 0.134 0 0.01 0 0.348 0 Sagittal PM 0 −0.33 0 2 0 0 SM 0 0.25 0 −0.45 0 0 TM 0 0.133 0 −0.35 0 −0.01  下载: 导出CSV
表 2 不同光学元件的热位移许用值
Table 2. Allowable values of thermal displacement for different optical components
Component TX/μm TY/μm TZ/μm RX/(″) RY/(″) RZ/(″) PM 0.76 0.76 13 0.1 0.1 5 SM 1.5 1.5 20 0.4 0.4 5 TM 2.5 2.5 25 0.8 0.8 5
下载: 导出CSV
表 3 各部件设计结果
Table 3. Design results of each component
Component Temperature
range/℃Maximum displacement TX/
μmTY/
μmTZ/
μmRX/
(″)RY/
(″)RZ/
(″)PM 20±1 0.5 0.51 0.66 0.08 0.07 0.08 SM 20±2 1.2 1.2 0.8 0.3 0.31 0.4 TM 20±5.5 2.2 2.1 2.5 0.7 0.6 0.9
下载: 导出CSV
-
[1] 王任享, 王建荣, 胡莘. 光学卫星摄影无控定位精度分析[J]. 测绘学报, 2017, 46(3): 332-337. Wang Renxiang, Wang Jianrong, Hu Xin. Analysis of location accuracy without ground control points of optical satellite imagery [J]. Acta Geodaetica et Cartographica Sinica, 2017, 46(3): 332-337. (in Chinese) [2] Li Yingjie, Zhang Junju, Chang Benkang, et al. Remote multiband infrared image fusion system and registration method [J]. Infrared and Laser Engineering, 2016, 45(5): 0526002. (in Chinese) [3] Zhang Shaohua, Xu Dalong. The development of commercial remote sensing satellites in the United States [J]. Geomatics & Spatial Information Technology, 2016, 39(12): 135-138. (in Chinese) [4] Ming Yang, Chen Chujiang, Yu Shaohuai, et al. Geolocation accuracy analysis of multi-strip WorldView satellite imagery [J]. Science of Surveying and Mapping, 2013, 38(1): 160-162. (in Chinese) [5] 黄志勇, 王淑婷, 李晶等. “天绘一号”卫星定位精度的不同表述. [C]// 第八届中国卫星导航学术年会论文集. 南京: 中国卫星导航学术年会组委会, 2017: 24. Huang Zhiyong, Wang Shuting, Li Jing, et al. The different expressions of the positioning accuracy of "TH-01" satellite [C]//The Eighth China Satellite Navigation Conference. Nanjing: China Satellite Navigation Conference, 2017: 24. (in Chinese) [6] 潘红播, 张过, 唐新明, 等. 资源三号测绘卫星影像产品精度分析与验证[J]. 测绘学报, 2013, 42(5): 738-744. Pan Hongbo, Zhang Guo, Tang Xinming, et al. Accuracy analysis and verification of ZY-3 products [J]. Acta Geodaetica et Cartographiea Sinica, 2013, 42(5): 738-744. (in Chinese) [7] 乔培玉, 何昕, 魏仲慧, 等. 高精度星敏感器的标定[J]. 红外与激光工程, 2012, 41(10): 2780-2784. Qiao Peiyu, He Xin, Wei Zhonghui, et al. Calibration of high accuracy star sensor [J]. Infrared and Laser Engineering, 2012, 41(10): 2780-2784. (in Chinese) [8] Eoportal. ALOs-3 (Advanced Land Observing Satellite-3): opticalmission [EB/OL]. (2016-11-20) [2023-08-24]. https://directory.eoportal.org/web/eoportal/satellite~missions/a/alos-3. [9] Eoportal. WorldView-3 [EB/OL]. (2016-11-20) [2023-08-24]. https://directory.eoportal.org/web/eoportal/satellite-missions/v-w-x-y-z/worldview-3. [10] Takanori Iwata. Precision attitude and position determination for the Advanced Land Observing Satellite (ALOS) [C]//Proceedings of SPIE, 2005, 5659: 34-50. [11] 高卫军, 孙立, 王长杰, 等. “资源三号”高分辨率立体测绘卫星三线阵相机设计与验证[J]. 航天返回与遥感, 2012, 33(3): 25—35 Gao Weijun, Sun Li, Wang Changjie, et al. Design and verification of three-line array camera for ZY-3 high resolution stereo mapping satellite [J]. Spacecraft Recovery & Remote Sensing, 2012, 33(3): 25-35. (in Chinese) [12] 高洪涛, 罗文波, 史海涛等. 资源三号卫星结构稳定性设计与实现[J] . 航天器工程, 2016, 25(6): 18-24. Gao Hongtao, Luo Wenbo, Shi Haitao, et al. Structural stability design and implementation of ZY-3 satellite [J]. Spacecraft Engineering, 2016, 25(6): 18-24. (in Chinese) [13] 姜海滨 罗世魁 曹东晶等. “高分二号”卫星轻小型高分辨率相机技术[J]. 航天返回与遥感, 2015, 36(4): 25-32. Jiang Haibin, Luo Shikui, Cao Dongjing, et al. Technology of high-density and high-resolution camera of GF-2 satellite [J]. Spacecraft Recovery & Remote Sensing, 2015, 36(4): 25-32. (in Chinese) [14] Howard J M. Optical modeling activities for the James Webb Space Telescope (JWST) project: I. The linear optical model [C]//Proceedings of SPIE, 2004, 5178: 82-88. [15] Johnston J D, Howard J M, Mosier G E, et al. Integrated modeling activities for the James Webb Space Telescope: optical jitter analysis [C]//Proceedings of SPIE, 2004, 5487: 588-599. -

 点击查看大图

计量
- 文章访问数: 53
- HTML全文浏览量: 7
- PDF下载量: 16
- 被引次数: 0

