


 下载:
下载:


-
过渡金属硫属化合物(Transition metal chalcogenides, TMCs)是一类具有特殊结构的层状化合物,由过渡金属和硫族元素组成,因其具有较高的化学稳定性、电子传输能力及生物相容性,被广泛应用于光电器件、催化、生物医学等领域[1-4]。硫化亚铁(FeS)是一种典型的TMCs,具有密排六方晶体结构,属于P63/mmc空间群,对称性良好。FeS体材料具有良好导电性、磁性和光催化特性,其纳米材料光电性能优异,化学性质稳定,生物相容性好,在光电子器件、磁性材料及生物医学等领域具有广泛的应用前景。Maji等人[5]利用化学沉积法(CBD)在涂有氟掺杂氧化锡(FTO)的玻璃基底上沉积FeS纳米晶薄膜,将其作为光阳极构建光电化学太阳能电池,转换效率为2.6%,展现出FeS纳米薄膜在太阳电池领域的应用潜力;Malek等人[6]以硝酸铁和硫代硫酸盐为前驱体,分别通过CBD和旋涂沉积法制备得到两种FeS薄膜,结果表明:两种薄膜在可见光到近红外波长范围内均有稳定的吸收特性,其直接光学带隙分别为1.75 eV(CBD)和1.81 eV(旋涂);Yang等人[7]经过高温化学法合成FeS纳米片,利用聚乙二醇(PEG)进行功能化得到FeS-PEG,研究发现,FeS-PEG在近红外波段具有较强的吸收能力,并表现出强超顺磁性,可用于实现肿瘤高效光热消融。近年来,FeS量子点(quantum dots, QDs)因具有高的比表面积、良好的红外吸收特性及生物低毒性等优势备受瞩目。Yang等人[8]将白蛋白(BSA)作为约束剂,采用仿生法成功合成了FeS@BSA QDs,平均尺寸约3 nm,在近红外区域表现出强吸收特性,可进一步用于肿瘤的光热治疗。
目前,FeS纳米材料的研究主要集中于FeS纳米薄膜和纳米颗粒,有关FeS QDs及其复合材料的研究报道相对较少。随着光电器件、生物成像等领域对新型量子点材料的需求不断增加,加快相关的研究工作是很必要的。液相超声剥离是一种常见的材料制备方法,早期多用于层状材料的剥离:在液相环境中,辅助剂在超声波的驱动下进入到材料分子内部,借助超声波脉冲能量破环层间作用力,使片状结构逐渐剥离,形成片层极少的纳米材料。该方法设备简单、耗材少、容易操控,现已发展为一种制备QDs的方法。
聚乙烯醇(PVA)是一种水溶性聚合物,具有透明度高、热稳定性好、绿色无毒及成膜能力强等优点,可作为基底材料与FeS QDs复配并提供柔性支撑,同时可以有效减少FeS QDs团聚,提升其稳定性和加工性能。文中采用工艺简便、成本低廉的液相超声剥离法制备FeS QDs,并将FeS QDs与PVA复配得到FeS QDs/PVA纳米复合薄膜,对制备得到的FeS QDs及其PVA纳米复合薄膜进行红外光学性能研究,以期发现FeS QDs及其复合薄膜在红外光学领域的更多应用潜力。
-
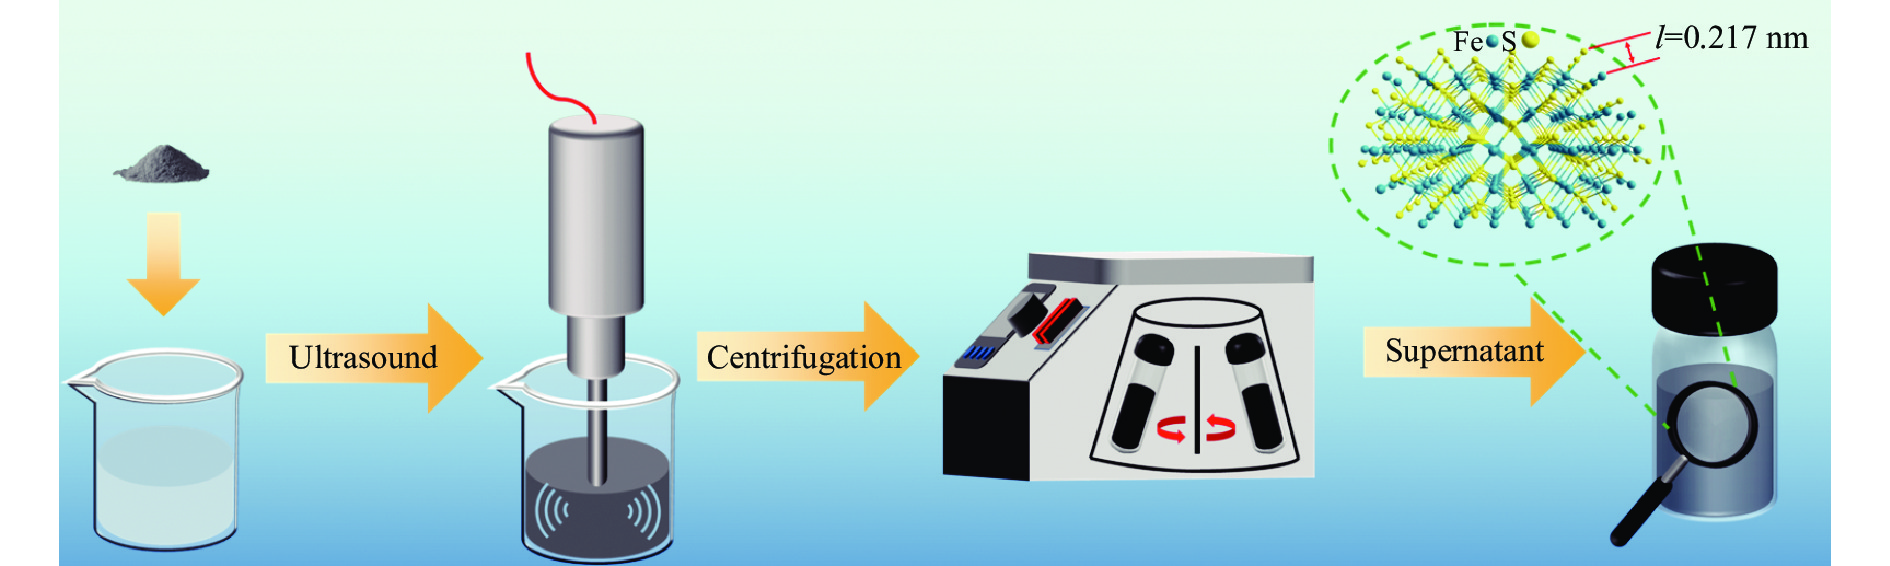
实验采用液相超声剥离法制备FeS QDs,制备流程如图1所示。称取0.15 g FeS粉末(纯度≥99.9%)置于研钵中研磨2 h;将磨好的粉末倒入50 mL的异丙醇(IPA,纯度≥99.7%)中混合均匀;再将其置于超声仪中以120 W的功率超声2 h,超声后的溶液以500 r/min离心5 min,取上层清液即为FeS QDs溶液。

图 1 FeS QDs的制备流程图
Figure 1. Flow chart preparation of FeS QDs
-
实验采用共混法制备FeS QDs/PVA纳米复合薄膜,步骤如下:分别取0.4 g PVA粉末和20 mL去离子水加入烧杯中,磁力加热搅拌45 min直至粉末完全溶解,再加入4 mL FeS QDs溶液继续加热搅拌15 min;取4 mL混合溶液滴铸于金属样品盒内;放置在40 ℃加热板上加热4 h成膜。
-
采用透射电子显微镜(TEM, FEI Tecnai G2 F30 S-Twin)、原子力显微镜(AFM,日本精工SPA-400)及能谱仪(EDS, NOVA NANOSEM 450)对FeS QDs的尺寸、形貌、结构和元素组分进行表征测试;采用X射线光电子能谱 (XPS,PHI Versa 探针 II)、傅里叶变换红外光谱(FTIR, Nicolet iS10)、X射线衍射(XRD,Empyrean Ultima Ⅳ)和拉曼光谱(Raman, Horiba Jobin-Yvon LabRAM HR800)对FeS QDs的物相组成及成键特性进行分析;采用紫外-可见分光光度计(UV-Vis, Shimadzu UV-3600)和荧光光谱仪(Hitachi, F-4500)测试FeS QDs及FeS QDs/PVA纳米复合薄膜的光学特性。
-
文中以IPA为分散剂,采用液相超声剥离法制备FeS QDs,反应机理如下:超声波在IPA溶液体系中产生高频振荡,使IPA发生膨胀,产生大量空化微气泡。随着气泡的不断生成、长大以及炸裂会产生持续且强烈的冲击波,导致FeS颗粒间强烈的相互碰撞,不断破坏FeS内部的化学键和分子结构,使FeS大颗粒逐步解体形成小颗粒,小颗粒被超声冲击后继续解体,最终形成分散性良好的FeS QDs。在超声作用下,FeS QDs具有良好的分散性和均匀性,未出现聚集。在此过程中,通过调控反应参数和超声波功率,可获得不同尺寸的FeS QDs,进而实现对其光电特性的调控。
在液相超声剥离制备中,溶剂的选择至关重要,直接影响到QDs的形成和特性。IPA是一种有机极性溶剂,文中作为超声传导介质使用。极性溶剂具有较强的溶解和分散能力,其所含的官能团(如羟基、羰基等)能与FeS表面的硫原子产生相互作用,有利于FeS QDs剥离并在溶液中保持稳定的分散态。而非极性溶剂的溶解和分散能力都较弱,不利于FeS QDs的剥离和分散。此外,溶剂黏度也会对FeS QDs的制备产生影响:黏度过高会导致超声剥离效果差,QDs分散性降低;黏度过低则会出现剥离不均匀,QDs易团聚。适宜的黏度有利于溶剂中形成微小流动,促进FeS QDs的剥离和分散。除了溶剂,FeS粉末粒度、反应体系温度等也是影响FeS QDs制备的因素,需要通过多次反复实验才能最终确定。
FeS QDs/PVA纳米复合薄膜是采用共混法制备得到,通过调控PVA溶液的浓度,可促进后期薄膜的形成,利用磁力搅拌将FeS QDs分散在PVA溶液中,可提高薄膜内QDs的均匀性。在共混的过程中通过静电吸引力、氢键和范德瓦尔斯力等相互作用,使FeS QDs和PVA结合在一起。在加热条件下,PVA分子链开始交联和固化,形成交联网络结构,FeS QDs被嵌在PVA基质中,最终形成稳定的FeS QDs/PVA纳米复合薄膜。
-
图2(a)是FeS QDs的TEM图和粒径直方分布图,可以看出QDs分散性良好,粒径分布在6~10 nm之间,平均尺寸约为8.1 nm。由于量子点的带隙大小主要与其尺寸有关,故利用公式(1)对FeS QDs的带隙进行计算[9]。

图 2 FeS QDs的形貌、结构及组分表征 (a) TEM图(插图为粒径分布图);(b) HR-TEM图;(c) 晶体结构模型;(d) AFM图;(e) 在图(d)中所标1、2和3号处位置的粒径高度分析图;(f) EDS能谱
Figure 2. The morphology, structure and component characterizations of FeS QDs. (a) TEM image (inset shows the particle size distribution); (b) HR-TEM image; (c) Crystal structure model; (d) AFM image; (e) Height analysis of the particle sizes at positions 1, 2, and 3 marked in Fig.(d); (f) EDS energy spectrum
$$ {{E_g}}\left( {{\rm{QDs}}} \right){{ = E_g}}\left( {{\rm{bulk}}} \right){\rm{ + }}\dfrac{{{{h^2}}}}{{{{8R^2}}}}\left[ {\dfrac{{\rm{1}}}{{{{m_e}}}}{\rm{ + }}\dfrac{{\rm{1}}}{{{{m_h}}}}} \right] + \dfrac{{1.8{{{e}}^2}}}{{4\pi \varepsilon_ 0\varepsilon _r{{R}}}} $$ (1) 式中:Eg(QDs)为量子点带隙;Eg(bulk)为体材料带隙;R为量子点半径;me、mh及εr分别为材料的电子有效质量、空穴有效质量和相对介电常数;h为普朗克常数;e为元电荷;ε0为真空介电常数。将FeS的相关参数[10-13]代入公式(1),计算得到FeS QDs的带隙为0.23 eV。由于QDs的带隙值与其激子峰的波长成倒数关系[14],可知文中的FeS QDs在红外波段具有良好的吸收能力。
图2(b)是FeS QDs的HR-TEM图,其晶格间距为0.264 nm,对应(1, 0, 1)晶面。通过Materials Studio软件对FeS QDs建立晶体结构模型,如图2(c)所示,Fe原子和S原子沿着(1, 0, 1)晶面有序排列,形成稳定的晶体结构。图2(d)是FeS QDs的AFM表征结果,可以看到QDs尺寸均匀,分散性良好,从中随机选取三个QDs,分别标记为1、2、3,进行粒径高度分析,如图2(e)所示,高度分别约为8.5、8.4 、9.1 nm,平均高度8.7 nm,该结果与TEM测得的尺寸相近,表明制备的FeS QDs呈球形。通过图2(f)的EDS元素分析图,可以得知FeS QDs中元素的相对含量:排除铜网中的Cu、C等元素的干扰,Fe元素(53.2%)和S元素(46.8%)的原子比例近似为1∶1。
-
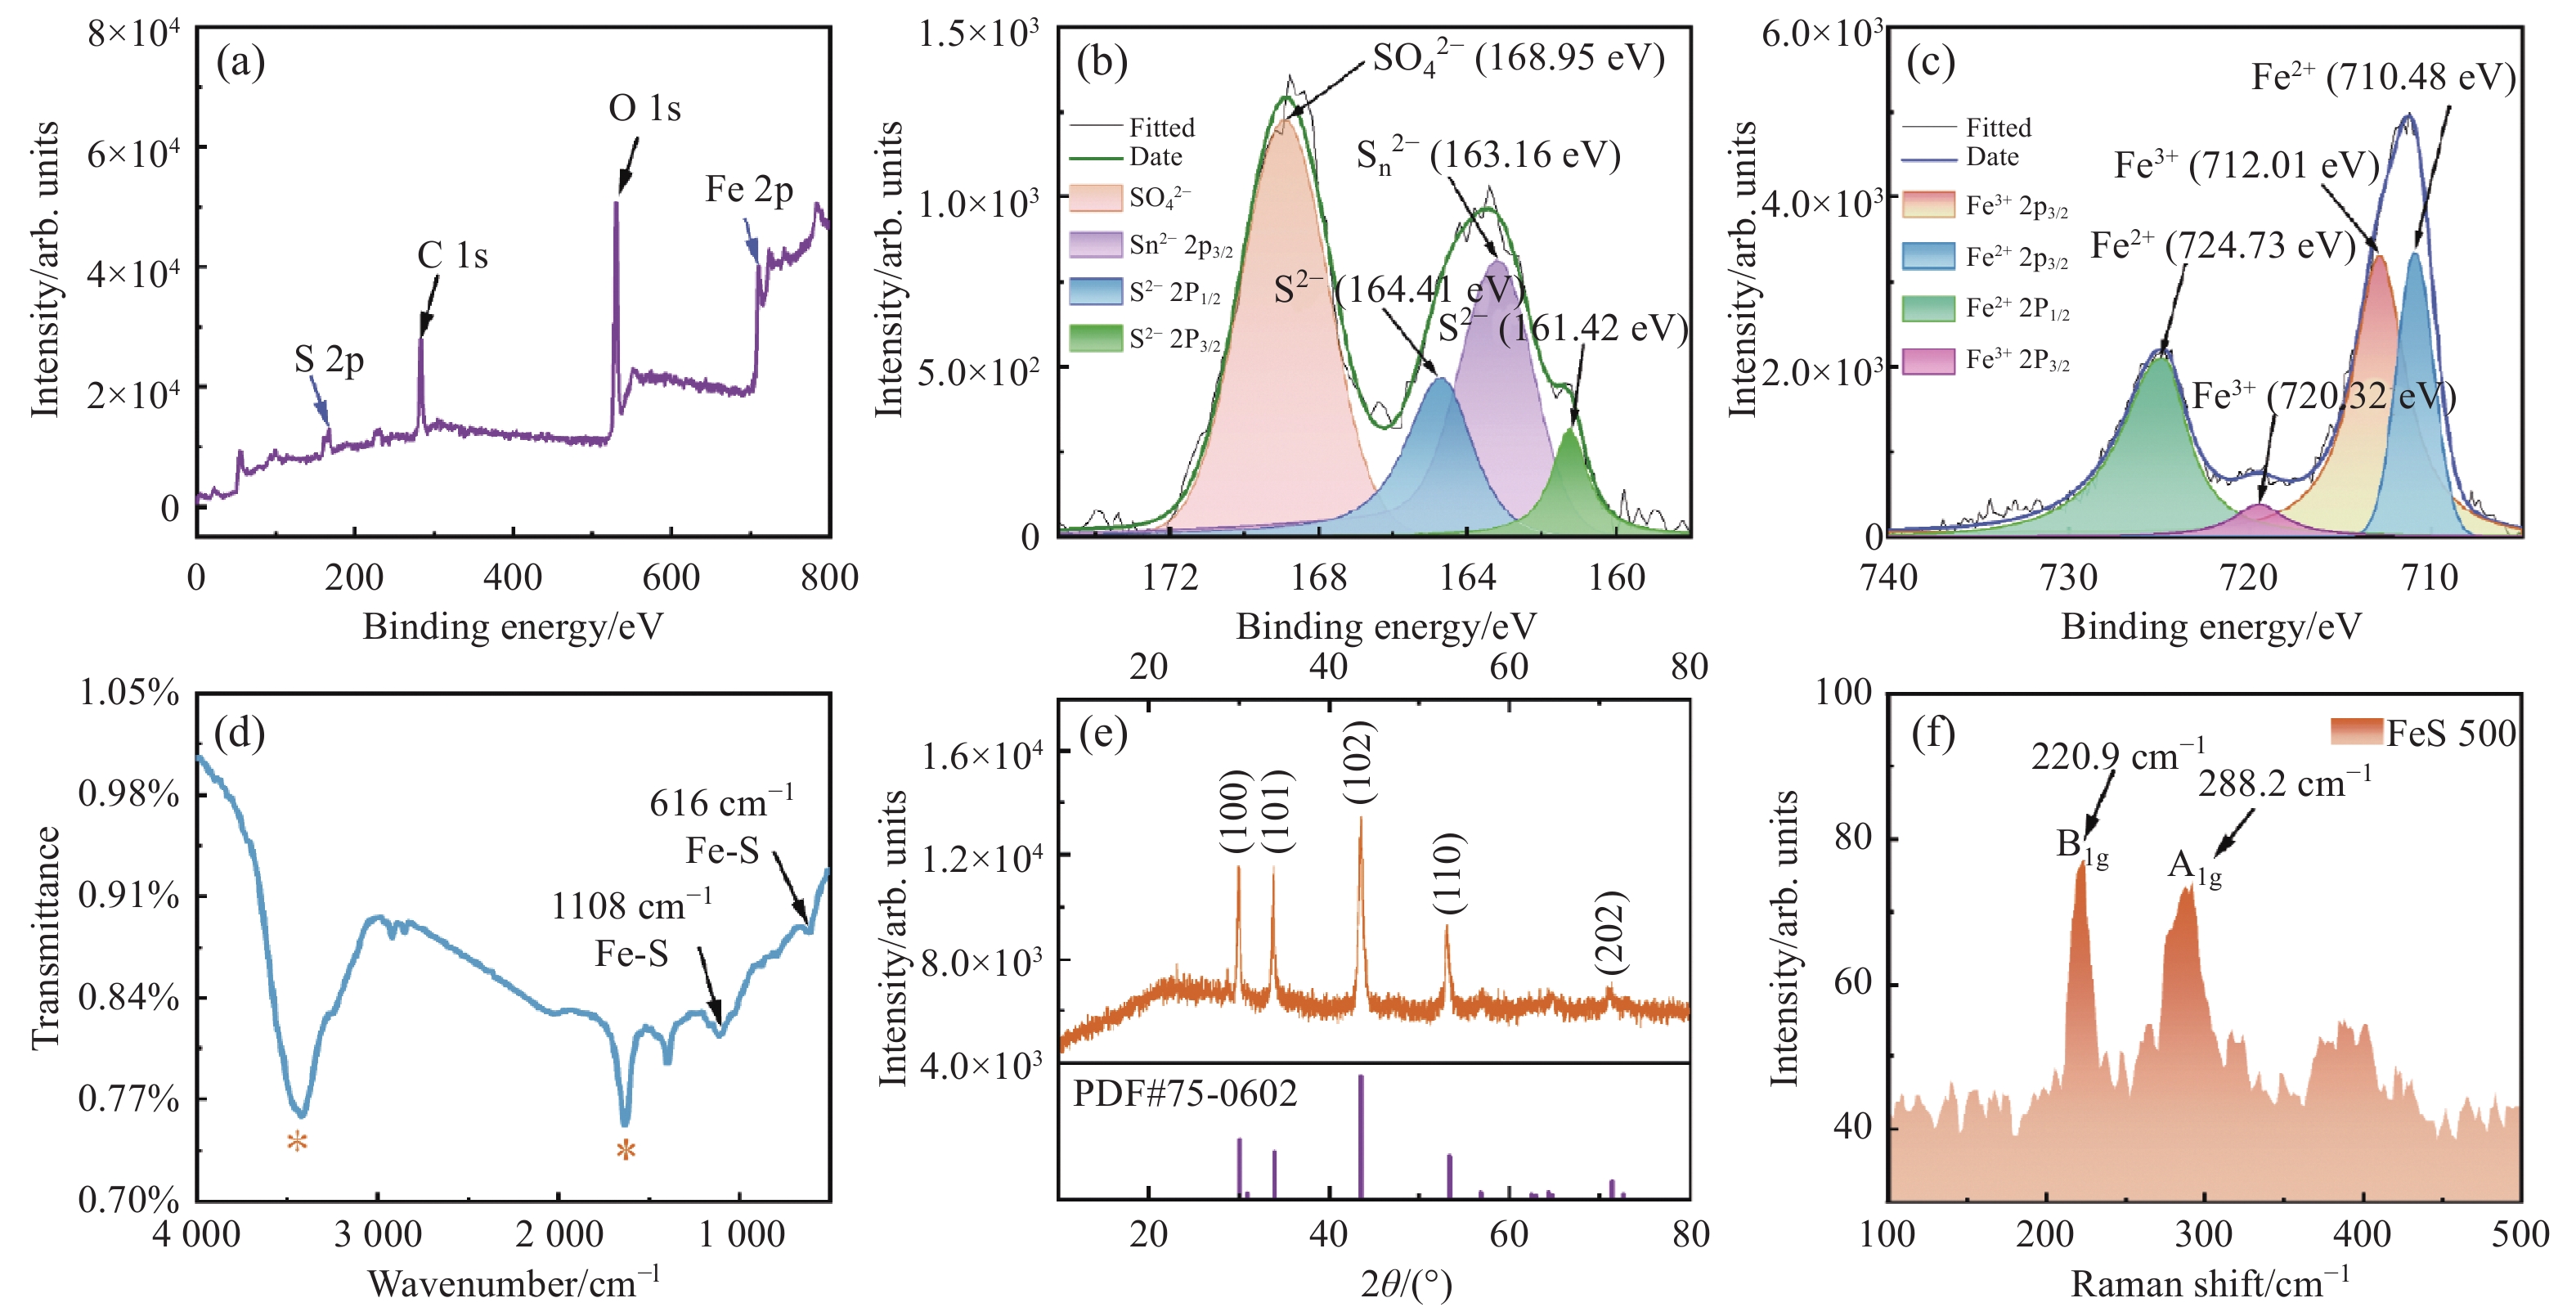
图3(a)是FeS QDs的XPS全谱图,图中有4种类型的峰,分别为S 2p、Fe 2p、C 1s和O 1s,其中C 1s和O 1s可能是分散剂IPA残留导致的;为了深入分析FeS QDs中S 2p和Fe 2p的存在形式,对其进行分峰拟合处理,S 2p的XPS谱如图3(b)所示,共有4种形式: S2− 2p3/2(161.42 eV)、Sn2− 2p3/2(163.16 eV)、S2− 2p1/2(164.41 eV)和SO42−(168.95 eV),其中SO42−可能是由于S2−被空气中的氧气氧化所导致;Fe 2p的XPS谱如图3(c)所示,共有4种形式:Fe2+ 2p3/2(710.48 eV)、Fe3+ 2p3/2(712.01 eV)、Fe3+ 2p1/2 (720.32 eV)和Fe2+ 2p1/2(724.73 eV),根据峰值强度进行分析Fe 2p3/2占主导,这与文献[15-17]报道的峰位位置相接近。图3(d)是FeS QDs的红外傅里叶变化光谱表征结果,*标记的两个峰从左到右分别为O-H和C=O的伸缩振动吸收峰[18],这可能是因为有机溶剂IPA中的C、H和O结合导致的,1108 cm−1 和616 cm−1处的吸收峰对应Fe-S的伸缩振动[19],表明样品中存在FeS。图3(e)是X射线衍射谱的测试结果,通过对比PDF标准卡片得知FeS晶胞中Fe-S的键长为0.217 nm,与Fang[20]报道的一致,图中2θ=30.1°、2θ=33.9°、2θ=43.6°、2θ=53.4°和2θ=71.3°处的衍射峰分别对应于FeS的(1, 0, 0)、(1, 0, 1)、(1, 0, 2)、(1, 1, 0)和(2, 0, 2)晶面,图中没有出现其他衍射峰,表明样品纯度高;图3(f)是FeS QDs的拉曼光谱图,在220.9、288.2 cm−1处均出现特征峰,分别归因于FeS的不对称和对称拉伸模式,即B1g模式和A1g模式,表明FeS是切实存在的[21-23]。

图 3 FeS QDs组分、化学键、物相及振动光谱分析 (a) XPS全谱图;(b) S 2p XPS谱;(c) Fe 2p XPS谱;(d) FTIR谱;(e) XRD衍射图;(f) Raman谱
Figure 3. The component, chemical bond, phase and vibrational spectrum analysis of FeS QDs (a) XPS full spectrum; (b) S 2p XPS spectrum; (c) Fe 2p XPS spectrum; (d) FTIR spectrum; (e) XRD diffraction pattern; (f) Raman spectrum
-
图4(a)是FeS QDs的UV-Vis吸收光谱测试结果,可以清楚地看到FeS QDs在紫外到近红外波段(200~2 000 nm)都存在较强吸收,当波长大于350 nm时,同一个样品的吸收强度不随波长增加而变化。图4(a)中的插图是FeS QDs溶液在不同光照下的照片,可以看到样品在自然光下呈灰黑色,在波长为254 nm和365 nm的紫外光照射下分别呈紫色和蓝色,表明FeS QDs溶液存在荧光效应。为进一步研究纯FeS QDs薄膜的吸收特性,将FeS QDs溶液旋涂在石英衬底上成膜进行测试,如图4(b)所示,FeS QDs薄膜在紫外波段到红外波段(200~3300 nm)都具有吸收,随着波长的增加,薄膜的吸收强度逐渐降低,但下降幅度不大。图4(c)是PVA薄膜和FeS QDs/PVA纳米复合薄膜的UV-Vis吸收光谱,插图为自然光照下拍摄的PVA薄膜(右)和FeS/PVA纳米复合薄膜(左)的照片,测试表明PVA薄膜自身在250~2500 nm波段内没有明显吸收,而FeS QDs/PVA纳米复合薄膜在200~2500 nm范围内都具有较强的吸收,且吸收强度不随波长增加而变化,表明FeS QDs与PVA复合成膜后从紫外到红外波段具有稳定的吸收。

图 4 FeS QDs及FeS QDs/PVA纳米复合薄膜UV-Vis吸收光谱。 (a) FeS QDs溶液(插图:自然光和紫外光下的FeS QDs溶液);(b) FeS QDs薄膜;(c) PVA薄膜和FeS QDs/PVA复合薄膜 (插图:PVA薄膜(右)和FeS/PVA复合薄膜(左)的照片)
Figure 4. UV-Vis absorption spectrum of FeS QDs and FeS QDs/PVA nanocomposite films. (a) FeS QDs solution, (inset: FeS QDs solution under natural light and UV light); (b) FeS QDs films; (c) PVA films and FeS QDs/PVA composite films (inset: photographs of PVA films (right) FeS/PVA composite films (left))
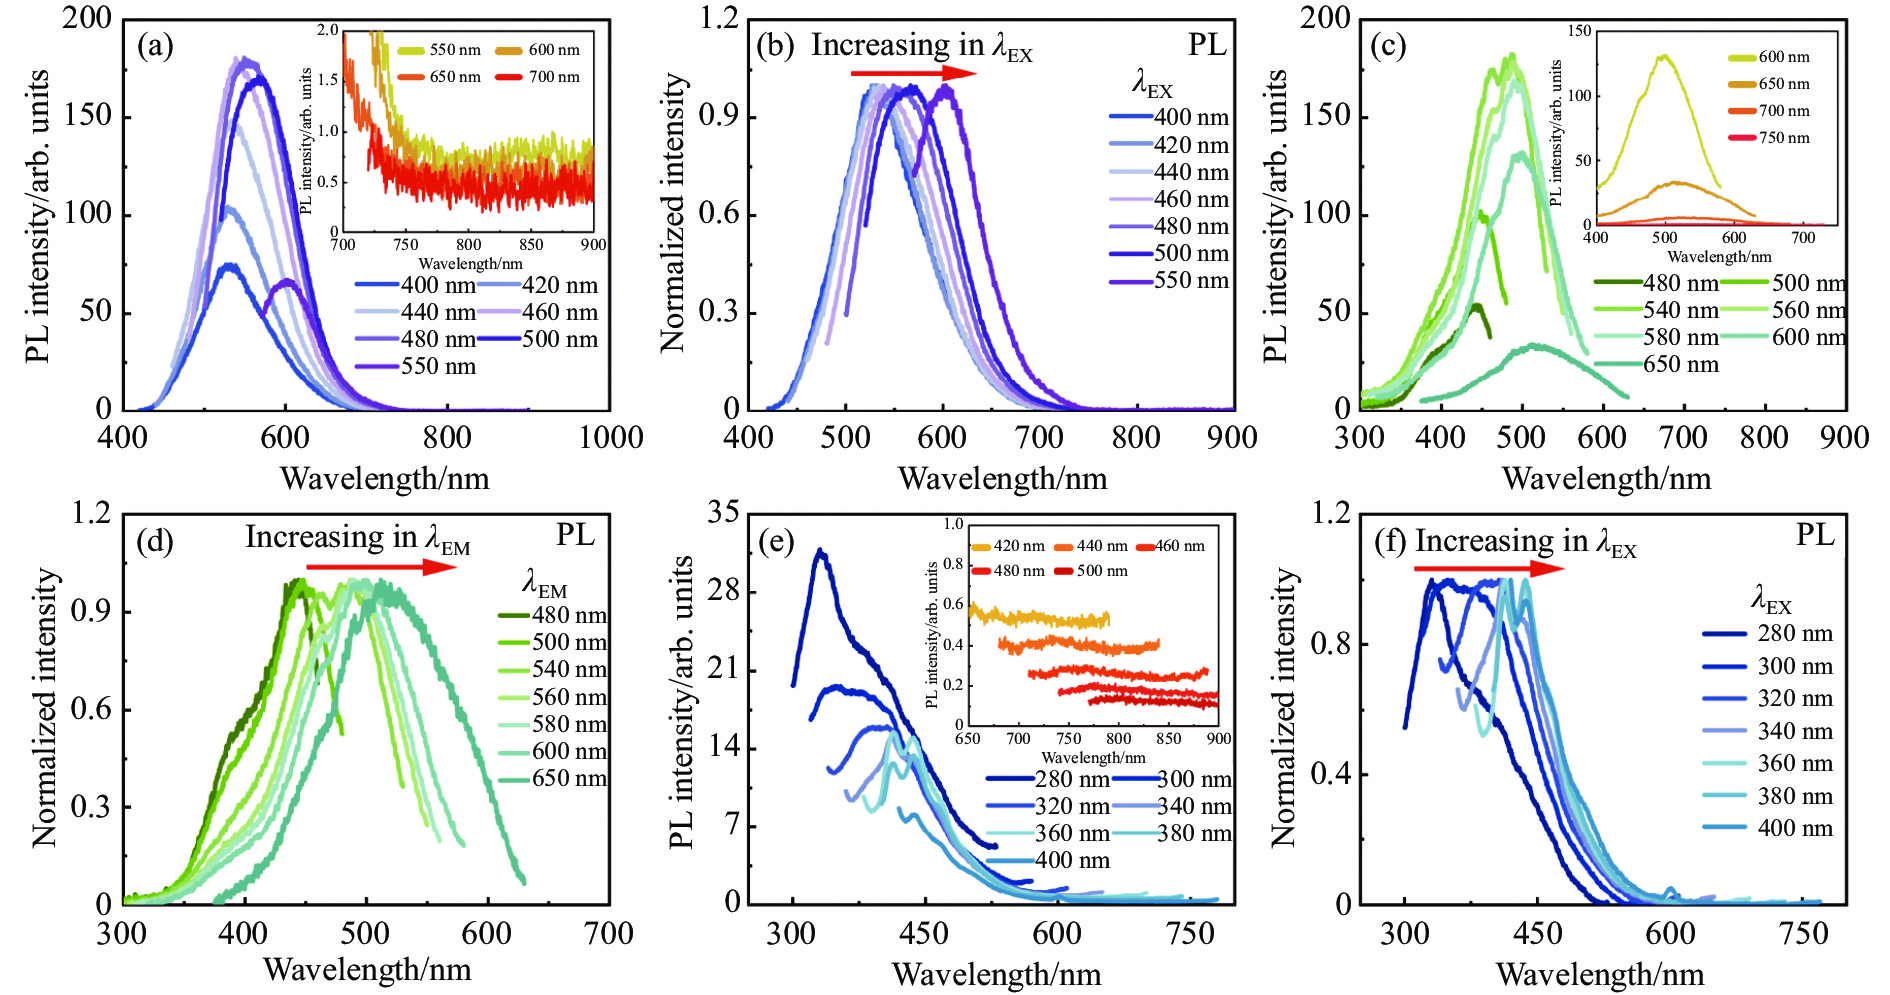
图5(a)是FeS QDs溶液的PL光谱图,随着激发光波长的增加,PL的峰值逐渐向长波方向移动,为了更直观地反映这一现象,对其进行归一化处理,结果如图5(b)所示,其峰值位置从525 nm增加到601 nm,表明PL峰对激发波长具有依赖性。这种现象可能是由量子尺寸效应和表面态引起的;由于量子尺寸效应,FeS QDs能带结构和能级分布受到限制;当激发波长增加时,FeS QDs中电子跃迁到导带的能量也会增加,这将导致激子的束缚能量增加。而PL峰的位置通常对应于激子的发射能量,因此FeS QDs的 PL峰会出现红移现象;表面态的存在可能导致FeS QDs形成多个能级,对应多个能级跃迁。综合考虑以上因素,PL峰对激发波长表现出依赖性。该现象在大部分QDs中均有体现[24-27]。图5(a)插图是FeS QDs在近红外波段的PL光谱图,由此可以看到,当激发波长从550 nm增加到700 nm时,FeS QDs在近红外波段仍存在发光现象。图5(c)是FeS QDs的PLE光谱图,当发射光波长从480 nm增加到650 nm时,FeS QDs的PLE峰也出现类似PL峰的红移现象。归一化处理的PLE光谱图如图5(d)所示,其峰值位置从441 nm增加到520 nm;图5(c)插图是FeS QDs在近红外波段的PLE光谱图,当发射光波长从600 nm增加至750 nm时,可以看到FeS QDs在近红外波段仍存在较强的响应。图5(e)为FeS QDs/PVA纳米复合薄膜的PL图,可以看出当激发光波长从280 nm逐渐增加到400 nm时,复合薄膜的PL峰同样表现出对激发波长的依赖性,图5(e)的插图是FeS QDs/PVA纳米复合薄膜在近红外波段的PL光谱图,当激发光波长从420 nm增加至500 nm时,同样可以观察到其在650~900 nm的近红外波段存在发光现象。图5(f)是将图5(e)进行归一化处理后得到的,可以看到纳米复合薄膜出现明显的红移现象。

图 5 FeS QDs及FeS QDs/PVA纳米复合薄膜PL和PLE光谱 (a) FeS QDs的PL图(插图:近红外的PL图);(b) FeS QDs归一化的PL图;(c) FeS QDs的PLE图(插图:近红外的PLE图);(d) FeS QDs 归一化的PLE图;(e) FeS QDs/PVA复合薄膜的PL图(插图:复合薄膜在近红外的PL图);(f) FeS QDs/PVA复合薄膜归一化的PL图
Figure 5. PL and PLE spectra of FeS QDs and FeS QDs/PVA nanocomposite films. (a) PL plots of FeS QDs (inset: PL plots of NIR); (b) PL plots of FeS QDs normalised; (c) PLE plots of FeS QDs (inset: PLE plots in NIR); (d) PLE plots of FeS QDs normalised; (e) PL plots of FeS QDs/PVA composite films (inset: PL plots of the composite films in NIR); (f) PL plots of FeS QDs/PVA composite films normalised
-
文中以FeS粉末为前驱物,采用液相超声法制备出分散性良好的FeS QDs,平均粒径约8.1 nm,平均高度约8.7 nm,并通过共混法得到FeS/PVA纳米复合薄膜;经计算得出FeS QDs的带隙为0.23 eV,在红外波段具有良好的吸收能力。UV-Vis测试,表明FeS QDs的溶液、薄膜及FeS/PVA纳米复合薄膜在紫外到红外波段具有明显吸收;通过PL和PLE测试发现,FeS QDs和FeS/PVA纳米复合薄膜在红外波段均有光致发光特性,且随着激发波长的增加,峰位出现红移,表现出激发波长依赖的发光特性。综上所述,FeS QDs及FeS QDs/PVA纳米复合薄膜均具有良好的红外光学特性,在红外探测、生物医学和光电器件等领域具有重要的应用潜力,有望成为一种新型红外材料。
Study on preparation and infrared properties of FeS quantum dots and their composite films
-
摘要: 过渡金属硫属化合物(TMCs)因其独特的电子结构和优异的光电性能,被广泛应用于催化、光电器件和生物成像等领域。硫化亚铁量子点(FeS QDs)作为一种TMCs纳米材料,由于较窄的禁带宽度而表现出优异的近红外特性,在红外探测器方面具有潜在价值。文中采用液相超声剥离法制备了FeS QDs,再利用共混法制备得到FeS QDs/PVA纳米复合薄膜,并对FeS QDs进行了形貌和结构的表征,测试了FeS QDs和FeS QDs/PVA纳米复合薄膜的光学性质。结果表明: FeS QDs分散性良好,没有出现团聚现象,平均粒径约8.1 nm,平均高度8.7 nm,呈球形,通过计算得到FeS QDs的直接带隙约为0.23 eV;FeS QDs及其PVA纳米复合薄膜在红外波段均具有明显的吸收和发光特性;随着激发波长增加,复合薄膜的峰位发生红移,表现出Stokes位移效应和激发波长依赖性。FeS QDs/PVA纳米复合薄膜所展示的优异红外吸收和发光特性,表明其在红外探测、生物医学、光电器件等研究领域中具有重要的应用潜力,有望成为一种新型红外光电材料。Abstract:
Objective Compared with other quantum dots (QDs), infrared QDs have narrower band gaps, wider absorption ranges, and longer fluorescence wavelengths. Therefore, they show greater potential in areas such as bioimaging, tumor treatment, photodetector and solar concentrators. As transition metal chalcogenides (TMCs), FeS QDs are promising infrared detection materials due to their narrow band gap, low toxicity, and strong near-infrared absorption. Forming therm into thin films is an effective approach to enhance the stability and processability of QDs. At present, the research about FeS mainly focuses on nanofilms and nanoparticles, and there are few reports on FeS QDs and their composite films. In this paper, we studied the preparation of FeS QDs by liquid-phase ultrasonic exfoliation, and prepared FeS/PVA composite films by mixing FeS QDs with polyvinyl alcohol (PVA). We tested and analyzed the infrared characteristics of FeS QDs in order to explore their potential applications in the field of infrared, and its application in the field of infrared optics was prospected. Methods FeS QDs solution was prepared by liquid phase ultrasonic exfoliation method. The preparation steps were as follows: 0.15 g of FeS powder (purity ≥99.9%) was weighed and placed in a mortar, followed grinding for 2 h. The ground FeS powder was then mixed with 50 mL of isopropyl alcohol (IPA, purity ≥99.7%) dispersant, and placed in the ultrasonic instrument at 120 W power for 2 h. After ultrasonic, the solution was centrifuged at 500 r/min for 5 minutes, taking out the supernatant, FeS QDs solution was obtained. Collect in a reagent bottle for further use. FeS QDs/PVA nanocomposite films were prepared using a blending method, following the steps below: 0.4 g of PVA powder was weighed and added to a beaker containing 20 mL of deionized water. The mixture was placed on a magnetic heating stirrer and continuously stirred at elevated temperature for 45 min until the powder was completely dissolved. Then, 4 mL of the FeS QDs solution was added to the mixture, and the heating and stirring kept on an additional 15 min. Subsequently, 4 mL of the mixed solution was drop-cast onto a metal sample holder, and the film was formed by heating the sample holder on a heating plate at 40 ℃ for 4 h. FeS QDs were characterized and analyze for size, morphology, structure, and elemental composition using transmission electron microscopy (TEM), atomic force microscopy (AFM), and energy spectroscopy (EDS). The phase composition and bonding properties of FeS QDs were analyzed by X-ray photoelectron spectroscopy (XPS), X-ray diffraction (XRD), Fourier transform infrared spectroscopy (FTIR), and Raman spectroscopy. The optical properties of FeS QDs and FeS QDs/PVA nanocomposite films were studied using UV-Vis spectrophotometer and fluorescence spectrometer. Results and Discussions Both FeS QDs and FeS QDs/PVA nanocomposite films exhibit significant absorption and luminescence characteristics in the infrared band (Fig.4(a), (b), (c)). As the excitation wavelength increase, the PL peak of the FeS QDs/PVA nanocomposite film shows a clear redshift, which shows obvious Stokes shift and excitation wavelength dependence (Fig.5(e)). Conclusions FeS QDs with an average particle size of 8.1 nm were successfully prepared by liquid phase ultrasonic exfoliation method. FeS/PVA nanocomposite films were prepared by blending FeS QDs with PVA. UV-Vis tests show that FeS QDs and FeS/PVA nanocomposite films exhibit absorption from ultraviolet to infrared band (200-2500 nm). PL test shows that they have photoluminescence in infrared band. PL peaks show significant redshift and Stokes shift, indicating that both are wavelength dependence. In addition, FeS/PVA nanocomposite film shows excellent infrared optical properties, especially the absorption and luminescence characteristics in the infrared band. These results show that FeS QDs and its nanocomposite films have important application potential in the field of infrared optics, and provide a new idea for the development of infrared optical devices. -
Key words:
- liquid phase ultrasonic exfoliation /
- FeS /
- quantum dots /
- nanocomposite film /
- infrared characteristic
-
图 2 FeS QDs的形貌、结构及组分表征 (a) TEM图(插图为粒径分布图);(b) HR-TEM图;(c) 晶体结构模型;(d) AFM图;(e) 在图(d)中所标1、2和3号处位置的粒径高度分析图;(f) EDS能谱
Figure 2. The morphology, structure and component characterizations of FeS QDs. (a) TEM image (inset shows the particle size distribution); (b) HR-TEM image; (c) Crystal structure model; (d) AFM image; (e) Height analysis of the particle sizes at positions 1, 2, and 3 marked in Fig.(d); (f) EDS energy spectrum
图 3 FeS QDs组分、化学键、物相及振动光谱分析 (a) XPS全谱图;(b) S 2p XPS谱;(c) Fe 2p XPS谱;(d) FTIR谱;(e) XRD衍射图;(f) Raman谱
Figure 3. The component, chemical bond, phase and vibrational spectrum analysis of FeS QDs (a) XPS full spectrum; (b) S 2p XPS spectrum; (c) Fe 2p XPS spectrum; (d) FTIR spectrum; (e) XRD diffraction pattern; (f) Raman spectrum
图 4 FeS QDs及FeS QDs/PVA纳米复合薄膜UV-Vis吸收光谱。 (a) FeS QDs溶液(插图:自然光和紫外光下的FeS QDs溶液);(b) FeS QDs薄膜;(c) PVA薄膜和FeS QDs/PVA复合薄膜 (插图:PVA薄膜(右)和FeS/PVA复合薄膜(左)的照片)
Figure 4. UV-Vis absorption spectrum of FeS QDs and FeS QDs/PVA nanocomposite films. (a) FeS QDs solution, (inset: FeS QDs solution under natural light and UV light); (b) FeS QDs films; (c) PVA films and FeS QDs/PVA composite films (inset: photographs of PVA films (right) FeS/PVA composite films (left))
图 5 FeS QDs及FeS QDs/PVA纳米复合薄膜PL和PLE光谱 (a) FeS QDs的PL图(插图:近红外的PL图);(b) FeS QDs归一化的PL图;(c) FeS QDs的PLE图(插图:近红外的PLE图);(d) FeS QDs 归一化的PLE图;(e) FeS QDs/PVA复合薄膜的PL图(插图:复合薄膜在近红外的PL图);(f) FeS QDs/PVA复合薄膜归一化的PL图
Figure 5. PL and PLE spectra of FeS QDs and FeS QDs/PVA nanocomposite films. (a) PL plots of FeS QDs (inset: PL plots of NIR); (b) PL plots of FeS QDs normalised; (c) PLE plots of FeS QDs (inset: PLE plots in NIR); (d) PLE plots of FeS QDs normalised; (e) PL plots of FeS QDs/PVA composite films (inset: PL plots of the composite films in NIR); (f) PL plots of FeS QDs/PVA composite films normalised
-
[1] Xu Yuan, Li Guodong, Li Ruoshui, et al. PbS/CdS heterojunction thin layer affords high-performance carbon-based all-inorganic solar cells [J]. Nano Energy, 2022, 95: 106973. doi: 10.1016/j.nanoen.2022.106973 [2] Niu Yue, Zeng Junwei, Liu Xiangcheng, et al. A photovoltaic self-powered gas sensor based on all-dry transferred MoS2/GaSe heterojunction for ppb-level NO2 sensing at room temperature [J]. Advanced Science, 2021, 8(14): 2100472. doi: 10.1002/advs.202100472 [3] Li Yangju, Dong Haoran, Li Long, et al. Recent advances in waste water treatment through transition metal sulfides-based advanced oxidation processes [J]. Water Research, 2021, 192: 116850. doi: 10.1016/j.watres.2021.116850 [4] Varnika Y, Shounak R, Prem S, et al. 2D MoS2-based nanomaterials for therapeutic, bioimaging, and biosensing applications [J]. Small, 2019, 15(1): 1803706. doi: 10.1002/smll.201803706 [5] Swarup Kumar Majia, Amit Kumar Duttaa, Papu Biswas, et al. Nanocrystalline FeS thin film used as an anode in photo-electrochemical solar cell and as hydrogen peroxide sensor [J]. Sensors and Actuators B: Chemical, 2012, 166: 726-732. doi: 10.1016/j.snb.2012.03.048 [6] Malek T J, Chaki S H, Giri R K, et al. The structural, morphological, and optical study of chemical bath deposition and a spin coating deposited mackinawite FeS thin films [J]. Applied Physics A, 2022, 128(9): 830. doi: 10.1007/s00339-022-05975-2 [7] Yang Kai, Yang Guangbao, Chen Lei, et al. FeS nanoplates as a multifunctional nano-theranostic for magnetic resonance imaging guided photothermal therapy [J]. Biomaterials, 2015, 38: 1-9. doi: 10.1016/j.biomaterials.2014.10.052 [8] Yang Weitao, Xiang Chenyang, Xu Yu, et al. Albumin-constrained large-scale synthesis of renal clearable ferrous sulfide quantum dots for T1-Weighted MR imaging and phototheranostics of tumors [J]. Biomaterials, 2020, 255: 120186. doi: 10.1016/j.biomaterials.2020.120186 [9] Badawi A, Al-hosiny N, Abdallah S, et al. Tuning photocurrent response through size control of CdTe quantum dots sensitized solar cells [J]. Solar Energy, 2013, 88: 137-143. doi: 10.1016/j.solener.2012.11.005 [10] Bao S K. Study on preparation and properties of novel chalcogenide nano-semiconductor [D]. Nanchang: Nanchang Hangkong University, 2015. (in Chinese) [11] Dong Shizhi, Li Yanshuai, Hu Xudong, et al. Application of MoS2-FeS functional carrier loaded Ni single-atom catalysts on HER: first principle [J]. Nanotechnology, 2022, 33(27): 275401. doi: 10.1088/1361-6528/ac61cc [12] Byoung-Gon Kim, Chong-Lyuck Park, Jae-Ryeong Lee. Dielectric properites of iron sulfide in coal by microwave irradiation [J]. Journal of the Korean Society of Mineral and Energy Resources Engineers, 2013, 50(6): 838-847. doi: 10.12972/ksmer.2013.50.6.838 [13] Cai Q. Application of noble metal/semiconductor composites: Surface Enhanced Spectroscopy (SES) substrates and In-situ monitoring [D]. Suzhou: Soochow University, 2015. (in Chinese) [14] Li Y Y. Preparation of infrared quantum dots-composite film and reasearch on optical properties [D]. Wuhan: Huazhong University of Science and Technology, 2021. (in Chinese) [15] Wang R. Preparation and electrochemical performance of iron-based nanoelectrode materials [D]. Xi’an: Shaanxi University of Science & Technology, 2020. (in Chinese) [16] Cai Jingjing, Liu Huijun, Luo Yulin, et al. Single-phase bimetal sulfide or metal sulfide heterojunction: Which one is better for reversible oxygen electrocatalyst? [J]. Journal of Energy Chemistry, 2022, 74: 420-428. doi: 10.1016/j.jechem.2022.07.023 [17] Hong Qiaofeng, Liu Chao, Wang Zhenbei, et al. Electron transfer enhancing Fe(II)/Fe(III) cycle by sulfur and biochar in magnetic FeS@biochar to active peroxymonosulfate for 2, 4-dichlorophenoxyacetic acid degradation [J]. Chemical Engineering Journal, 2021, 417: 129238. doi: 10.1016/j.cej.2021.129238 [18] Bai Zhiyan, Yang Qi, Wang Jianlong. Fe3O4/multi-walled carbon nanotubes as an efficient catalyst for catalytic ozonation of p-hydroxybenzoic acid [J]. International Journal of Environmental Science and Technology, 2016, 13: 483-492. doi: 10.1007/s13762-015-0881-3 [19] Sun Yong, Danish Muhammad, Ali Meesam, et al. Trichloroethene degradation by nanoscale CaO2 activated with Fe(II)/FeS: the role of FeS and the synergistic activation mechanism of Fe(II)/FeS [J]. Chemical Engineering Journal, 2020, 394: 124830. doi: 10.1016/j.cej.2020.124830 [20] Fang L. Study on the effect and mechanism of iron sulfide nanoenzyme for the prevention and treatment of bacterial vaginitis [D]. Yangzhou: Yangzhou University, 2022. (in Chinese) [21] Duan Yefan, Li Qi, He Panpan, et al. Ultrathin FeS nanosheets with high chemodynamic activity for sensitive colorimetric detection of H2O2 and glutathione [J]. Chinese Chemical Letters, 2022, 33(6): 3217-3220. doi: 10.1016/j.cclet.2021.10.041 [22] Hansson E B, Odziemkowski M S, Gillham R W. Formation of poorly crystalline iron monosulfides: surface redox reactions on high purity iron, spectroelectrochemical studies [J]. Corrosion Science, 2006, 48(11): 3767-3783. doi: 10.1016/j.corsci.2006.03.010 [23] Zhao He, Zeng Linghui, Xu Xiaoliang. Simple synthesis of monoatomic layer FeS semiconductor nanosheetsand its application in photocatalytic reduction of carbon dioxide [J]. Low Temperature Physical Letters, 2020, 42(3): 152-157. (in Chinese) doi: 10.13380/j.ltpl.2020.03.006 [24] Wang Yan, Liu Yang, Zhang Jianfang, et al. Cryo-mediated exfoliation and fracturing of layered materials into 2D quantum dots [J]. Science Advances, 2017, 3(12): e1701500. doi: 10.1126/sciadv.1701500 [25] Liu Yang, Liang Chenglu, Wu Jingjie, et al. Reflux pretreatment-mediated sonication: A new universal route to obtain 2D quantum dots [J]. Materials Today, 2019, 22: 17-24. doi: 10.1016/j.mattod.2018.06.007 [26] Li Hongling, Tay R Y, Tsang S H, et al. Controllable synthesis of highly luminescent boron nitride quantum dots [J]. Small, 2015, 11(48): 6491-6499. doi: 10.1002/smll.201501632 [27] Lai S K, Luk C M, Tang Libin, et al. Photoresponse of polyaniline-functionalized graphene quantum dots [J]. Nanoscale, 2015, 7(12): 5338-5343. doi: 10.1039/c4nr07565j -

 点击查看大图
计量
- 文章访问数: 133
- HTML全文浏览量: 17
- PDF下载量: 35
- 被引次数: 0

