


-
透明物体表面形状质量的测量在医学诊断、天文观测、光学设备的设计和制造等领域中具有广泛的应用和重要意义。光学三维测量技术可以根据所采用光源的形式差异将其分为无需辅助光源的被动式测量和外加辅助光源的主动式测量[1]。被动式测量通常依赖目标物体自身属性或特征,一般适用于特征明显的漫反射表面。常用的主动式测量主要有干涉法、条纹投影轮廓术和相位偏折测量术(Phase Measuring Deflectometry, PMD)。干涉法的测量精度较高,但存在易受环境影响、难以全场测量、并且元器件价格昂贵、不适用于透明物体的测量等缺点[2−3]。条纹投影轮廓术适用于漫反射物体表面三维形貌测量,无法在透明物体表面正确映射[4−5]。PMD是一种高效、灵活和稳健的测量技术,具有产生方便、动态范围大以及非相干性等优点。通过软件编码生成标准正弦条纹图并在显示屏上显示,相机采集经被测物体表面反射的变形条纹图[6]。经相移法处理得到折叠相位,利用相位展开获得物体的展开相位。根据相位与梯度的标定结果,计算物体相对参考面的梯度[7−9]。通过梯度积分重建被测物体的三维形貌。但是,PMD在测量透明物体时存在一定局限,物体下表面的寄生反射会对测量造成干扰[10−12]。
透明物体上下表面反射和折射的叠加,导致图像信息的混叠和失真。相移法因透明物体测量中包含的未知数过多而无法有效应用,并且现有的相位提取方法存在实验设备成本高、条件不佳、阈值难以确定等缺点,使得准确测量透明物体变得十分困难[13]。针对上述问题,Wang等[14]开发了一种基于谱估计算法和多频方法的新算法。对于多频方法,虽然捕获多频图像耗时较长,但可以在不破坏目标的情况下分离出寄生反射,且无需特殊设备即可达到较高的精度[15−16]。通过多频逼近算法分离上下表面的混合信号,利用多频条纹投影获得附加信息,实现上下表面相位的计算。这种方法所选择的是线性调制传递函数,不能保证初始相位值的准确性,将导致优化不收敛。Tao等[17]提出了一种基于多频方法的寄生反射消除包络曲线算法,通过精确计算初始相位值,保证了算法的收敛性。该方法提高了PMD中针对高透明物体的相位计算精度,消除了透明物体的相位重构误差,但是采集时间较长,且受物体厚度的影响。Ye等[18]提出了一种同时测量透明物体上下表面形貌的相位解耦算法,通过显示不同频率的条纹图案,利用最小二乘法迭代求解物体上下表面的相位值。采用一种混合反射-折射偏折模型,利用已重建上表面形貌来计算下表面的梯度和形貌,这导致物体下表面的重建依赖于上表面的重建结果,造成下表面重建区域较小。
上述方法在一定程度上解决了透明物体测量的难题,但现有方法对初始相位精度要求较高,另一方面需要采集大量条纹图。为解决透明物体三维形貌测量的难题,文中提出一种基于多频相移的相位偏折测量透明物体表面三维形貌的方法。该方法将多种频率条纹与相移结合,利用最小二乘+迭代法将透明物体上下表面的相位进行分离,降低了对初始相位的精度要求,易于实现相位的迭代计算,提高了系统的三维测量精度。
-
PMD测量系统主要由LCD(Liquid Crystal Display)显示屏、CCD(Charge Coupled Device)相机和计算机组成,如图1所示。非透明物体不存在下表面反射,只有上表面会反射显示屏上的条纹。经相机采集到的光强值为:
$$ \begin{array}{c}\begin{array}{c}{I}_{N}=A+B\cos\left(u+{\theta }_{N}\right) \end{array}N=\mathrm{1,2},\mathrm{3,4}\end{array} $$ (1) 式中:$ {I}_{N} $为图像光强;$ A $为背景光强;$ B $为物体表面调制度;$ u $为相位值;$ {\theta }_{N} $为条纹相移值;$ N $为相移次数。

图 1 相位偏折测量示意图
Figure 1. Schematic diagram of phase measurement deflectometry
-
对于透明物体,其上表面和下表面都会反射显示屏上的条纹图像。显示屏的光线一部分会由透明物体上表面反射被相机采集,另一部分光线经折射进入透明物体,经折射-反射-折射从上表面出射再被相机采集。显示屏上同一个像素点会被相机在不同位置采集两次,这会对数据的采集产生影响,如图2所示。

图 2 表面反射与折射
Figure 2. Surface reflection and refraction
由图3可知,折射与反射叠加被相机同一像素点采集,相机捕捉到的光强值可以表示为:

图 3 折射与反射叠加
Figure 3. Refraction and reflection superposition
$$I=A+{B}_{1}\cos({u}_{1}+{\theta }_{N})+{B}_{2}\cos\left({u}_{2}+{\theta }_{N}\right) $$ (2) 式中:$ {B}_{1} $和$ {B}_{2} $为透明物体上下表面的调制度;$ {u}_{1} $和$ {u}_{2} $为上下表面的相位值。
透明物体的光强公式所包含未知数数目增加,可将公式(2)改写为:
$$ I=A+{C}_{1}\cos{\theta }_{N}+{C}_{2}\sin{\theta }_{N}+{C}_{3}\cos{\theta }_{N}+{C}_{4}\cos{\theta }_{N} $$ (3) 式中:$ {C}_{1} $=$ {B}_{1}\mathrm{c}\mathrm{o}\mathrm{s}{u}_{1} $;$ {C}_{2} $=$ -{B}_{1}\sin{u}_{1} $;$ {C}_{3} $=$ {B}_{2}\mathrm{c}\mathrm{o}\mathrm{s}{u}_{2} $;$ {C}_{4} $=$ -{B}_{2}\sin{u}_{2} $。通过给定N步相移,可从线性系统得到$ {[A,C_1,C_2,C_3,C_4]}^{{\mathrm{T}}} $的最小二乘解。
$$ \begin{split} \left[\begin{array}{ccccc} N & 0 & 0 & 0 & 0 \\ 0 & \dfrac{N}{2} & 0 & \dfrac{N}{2} & 0 \\ 0 & 0 & \dfrac{N}{2} & 0 & \dfrac{N}{2} \\ 0 & \dfrac{N}{2} & 0 & \dfrac{N}{2} & 0 \\ 0 & 0 & \dfrac{N}{2} & 0 & \dfrac{N}{2} \end{array}\right]\left[\begin{array}{c} A \\ C_1 \\ C_2 \\ C_3 \\ C_4 \end{array}\right]=\left[\begin{array}{c} \displaystyle\sum_{n=0}^{N-1} I_n \\ \displaystyle\sum_{N=0}^{N-1} I_n \cos \theta_N \\ \displaystyle\sum_{N=0}^{N-1} I_n \sin \theta_N \\ \displaystyle\sum_{N=0}^{N-1} I_n \cos \theta_N \\ \displaystyle\sum_{N=0}^{N-1} I_n \sin \theta_N \displaystyle\end{array}\right] \end{split} $$ (4) 由公式(4)可知,无论相移多少次,系数矩阵只有3阶。这表明在寄生反射存在的情况下,仅靠传统的相移法不足以解算所有未知数。因此,采用多频方法建立多个方程来解算未知数信息,解决透明物体寄生反射问题。在不改变相移的情况下显示一组不同频率的条纹图,为相位解算提供约束。设$ {k}_{w} $为条纹频率系数,当条纹频率发生改变时,相应的光强公式可以表示为:
$$ {I}_{w}=A+{B}_{1}\cos({k}_{w}{u}_{1}+{\theta }_{N})+{B}_{2}\cos\left({{k}_{w}u}_{2}+{\theta }_{N}\right) $$ (5) 条纹频率与显示屏显示的条纹数目成线性关系,通过调整条纹数目可以改变条纹频率。当条纹周期的范围为15~90 pixel时,能够捕捉物体表面的细微条纹变化,满足大多数测量的精度需要,避免噪声的影响[19]。将公式(5)进行分离,并加入多步相移得到以下公式:
$$\begin{split} {I}_{\cos}= {B}_{1}\cos\left({k}_{w}{u}_{1}\right)+{B}_{2}{\cos}\left({{k}_{w}u}_{2}\right)=\frac{2}{N}\displaystyle\sum _{n=0}^{N-1}{I}_{n}\mathrm{c}\mathrm{o}\mathrm{s}{\theta }_{N} \end{split} $$ (6) $$\begin{split} {I}_{\sin}={-B}_{1}\sin\left({k}_{w}{u}_{1}\right)-{B}_{2}\sin\left({{k}_{w}u}_{2}\right)=\frac{2}{N}\displaystyle\sum _{n=0}^{N-1}{I}_{n}\mathrm{s}\mathrm{i}\mathrm{n}{\theta }_{N} \end{split}$$ (7) 通过多步相移消除背景光强的影响,仅包含上下表面调制与相位4个未知数。根据三角函数变换$ \cos\left[{k}_{w}u\right]\;=\;\cos\left[\left({k}_{w}\;-\;1\right)u\right]\cos u-\mathrm\sin\left[\left({k}_{w}-1\right)u\right]\sin u $ 和$ \mathrm\sin\left[{k}_{w}u\right]=\mathrm\sin\left[\left({k}_{w}-1\right)u\right]\cos u+\cos\left[\left({k}_{w}-1\right)u\right]\sin u $改写公式为:
$${I}_{cos}+{I}_{\sin}={R}_{w1}{P}_{1}+{R}_{w2}{P}_{2}+{R}_{w3}{{P}_{3}+R}_{w4}{P}_{4} $$ (8) 式中:$ {R}_{w1}={\cos}\left[\left({k}_{w}-1\right){u}_{1}\right] $; $ {R}_{w2}=-\sin\left[\left({k}_{w}-1\right){u}_{1}\right] $;$ {R}_{w3}={\cos}\left[\left({k}_{w}-1\right){u}_{2}\right] $;$ {R}_{w4}=-\sin\left[\left({k}_{w}-1\right){u}_{2}\right] $;$ {P}_{1} $、$ {P}_{2} $、$ {P}_{3} $、$ {P}_{4} $为定义中间变量,$ {P}_{1}={B}_{1}\cos{u}_{1} $,$ {P}_{2}={B}_{1}\sin{u}_{1} $,$ {P}_{3}={B}_{2}\mathrm{c}\mathrm{o}\mathrm{s}{u}_{2} $,$ {P}_{4}={B}_{2}\sin{u}_{2} $。
透明物体上下表面相位可由公式(9)表示:
$$ \begin{array}{c}{u}_{1}={{\mathrm{arctan}}}\left(\dfrac{{P}_{2}}{{P}_{1}}\right),{u}_{2}={{\mathrm{arctan}}}\left(\dfrac{{P}_{4}}{{P}_{3}}\right)\end{array} $$ (9) 假定采集n个不同频率的条纹公式,多频相移方程可表示为:
$$ \begin{array}{c}RP=I\end{array} $$ (10) 式中:$ R=\left[\begin{array}{c}\begin{array}{ccc}{R}_{11}& {R}_{12}& {R}_{13}\\ {R}_{21}& {R}_{22}& {R}_{23}\end{array}\begin{array}{c}{R}_{14}\\ {R}_{24}\end{array}\\ \begin{array}{ccc}\vdots& \vdots& \vdots\\ {R}_{n1}& {R}_{n2}& {R}_{n3}\end{array}\begin{array}{c}\vdots\\ {R}_{n4}\end{array}\end{array}\right];\quad P=\left[\begin{array}{c}\begin{array}{c}{P}_{1}\\ {P}_{2}\end{array}\\ {P}_{3}\\ {P}_{4}\end{array}\right]; I=\left[\begin{array}{c}\begin{array}{c}{I}_{\cos 1}+{I}_{\sin 1}\\ {I}_{\cos 2}+{I}_{\sin 2}\end{array}\\ \vdots\\ {I}_{\cos n}+{I}_{\sin n}\end{array}\right] $。中间变量$ P $可以根据线性关系建立最小二乘方程求解:
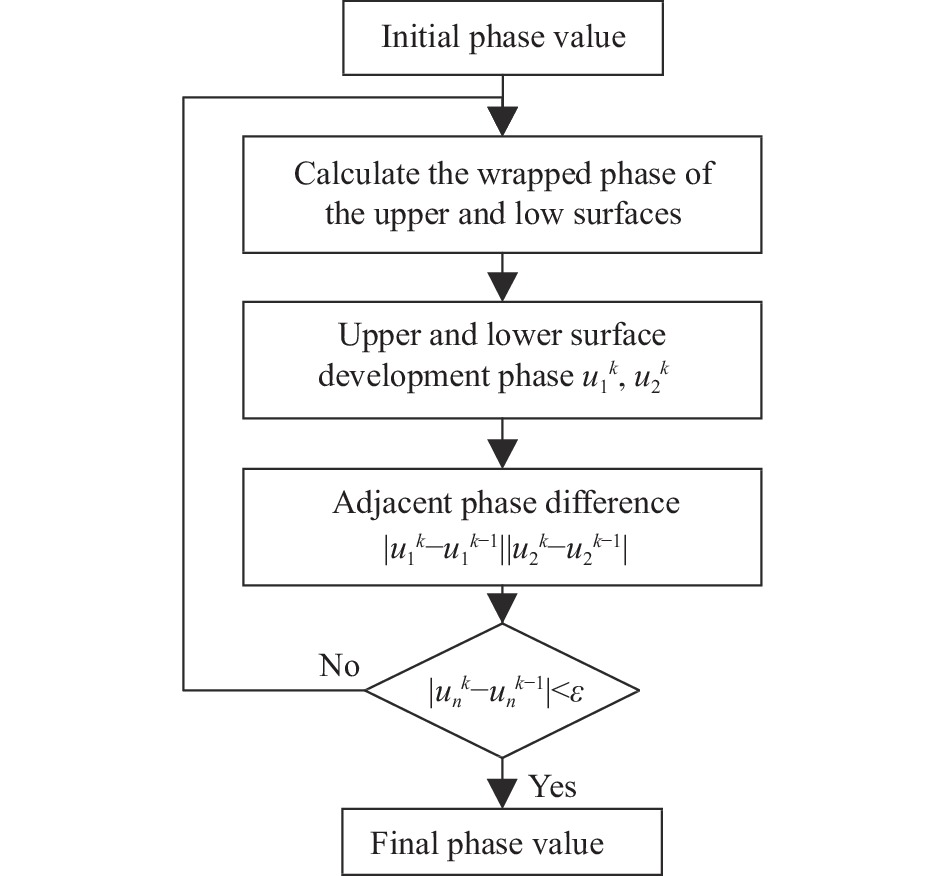
$$ \begin{array}{c}P={\left({R}^{{\mathrm{T}}}R\right)}^{-1}{R}^{{\mathrm{T}}}I\end{array} $$ (11) 得到$ P $值后,由公式(9)计算得到上下表面的折叠相位,选用时间相位展开法对相位进行展开,不会造成累积误差,能够更加高效、准确地处理周期性信号。相位值决定$ R $,因此将所求解相位值再次代入公式(10)中进行计算,以此迭代求解,如图4所示。将相邻两次迭代求解得到的相位值进行作差,对差值设定阈值ε,直到相位差满足设定阈值条件,迭代停止。理论上阈值的选取越小越好,但是相位计算结果会受到噪声的影响,阈值过小会导致相位无法收敛,因此设定阈值ε为10−6 rad,保证计算精度的同时实现相位快速收敛。该迭代方法在计算过程中消除了上下表面调制度,避免调制度计算带来的误差。

图 4 迭代流程图
Figure 4. Iterative flow chart
由于该过程是迭代实现,因此初始值的选择对算法的收敛性至关重要。该方法通过多频相移增强约束条件,降低了初始相位值的精度需求,仅提供粗略相位值,即可实现迭代运算,提高了迭代算法的可实现性与数值稳定性。
-
PMD系统采用梯度积分对物体的三维形貌进行恢复,通过透明物体相位计算得到被测物体在x、y方向的相位值,需要标定相位与梯度的关系,计算出相应的梯度值。
相位与梯度关系的标定步骤如下:1)相机采集不同位姿的棋盘格标定板图像,利用张正友标定法标定相机参数;2)将镜面标定板垂直固定在三轴转台上,提取标识点位置,计算标定板所处位置的旋转矩阵,进而获取梯度信息,软件生成最佳三条纹与四步相移结合的标准水平、竖直正弦条纹,相机采集由镜面标定板反射的条纹图;3)同时沿水平轴和垂直轴方向顺时针旋转三轴转台,避免单轴旋转引起矩阵计算的奇异性,旋转角度小于1°,重复步骤2),采集9个不同姿态的条纹图,计算条纹的绝对相位;4)选取第5次采集的镜面位置作为参考面,设参考位置的梯度为0,对应绝对相位为φ。最终得到每个位置相对于参考面的梯度变化和绝对相位变化,多个方程联立标定相位与梯度的关系,增强解的约束性。
梯度标定原理如图5所示。设$ \mathrm{\angle }OAB=\alpha $,条纹周期为$ T $,坐标原点到显示屏距离为$ \left|OA\right| $,将多次旋转的梯度与相位变化代入公式(12),计算相位与梯度的关系。
$$ \begin{array}{c}\tan2\theta =\dfrac{T\sin\alpha \Delta \varphi }{2\pi \left|OA\right|-T\cos\alpha \Delta \varphi }\end{array} $$ (12) 条纹周期$ T $仅与显示屏显示的条纹数目有关,在待测物体高度远小于$ \left|OA\right| $并且旋转角度小于1°的情况下,$ \left|OA\right| $、$ \alpha $仅与参考面的空间位置有关,高度的微小变化对相位测量结果影响很小,而梯度的变化会显著影响相位结果,因此将$ \left|OA\right| $、$ \alpha $、$ T $视为常量,不会对相位测量造成影响,适用于物体表面起伏不大的情况。
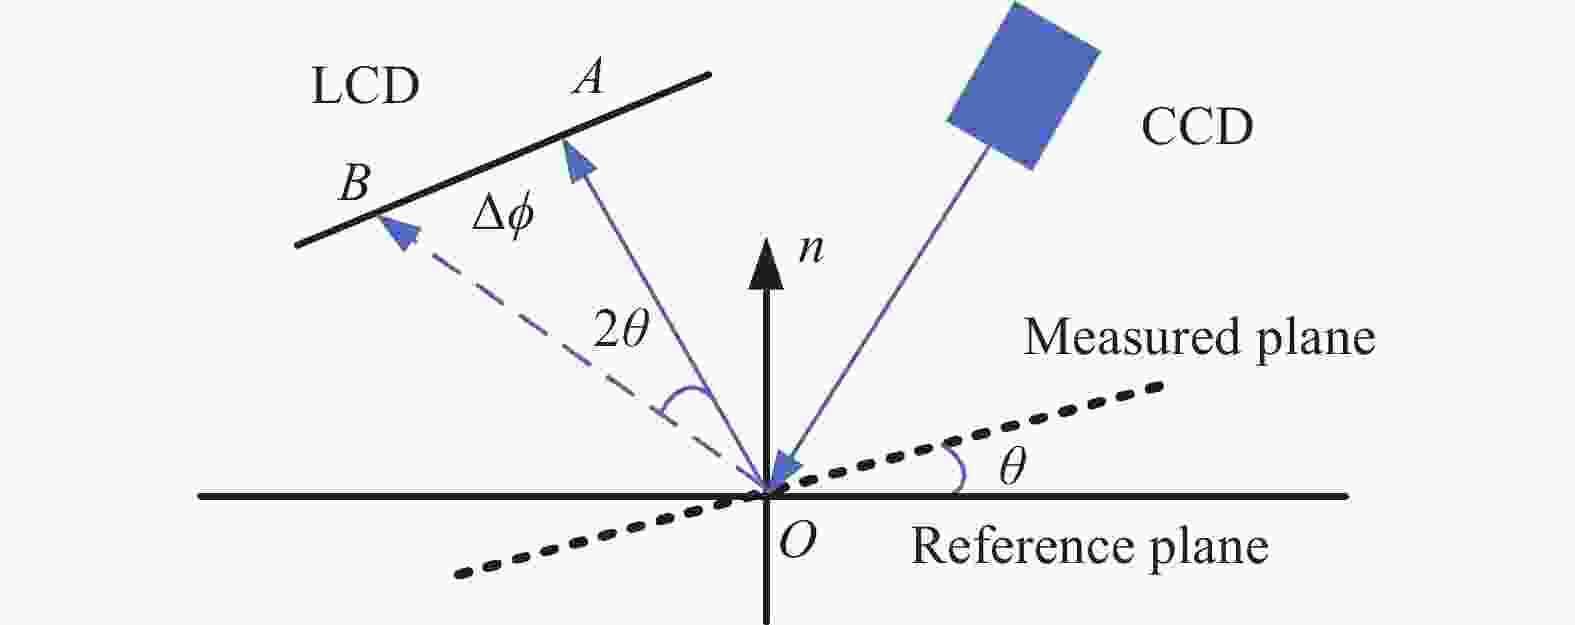
图 5 梯度标定原理图
Figure 5. Schematic diagram of gradient calibration
-
通过仿真验证相位计算方法的可行性,仿真使用分辨率为1 200 pixel×1 000 pixel相机,像素间距为3.45 μm,分辨率为2 160 pixel×2 160 pixel显示屏,像素间距为0.096 mm。被测物体为一块80 mm×80 mm的透明玻璃板,厚度为5 mm,物体折射率n1设为1.5。根据反向射线追踪法建立相机采集模型,计算每个相机像素点对应的显示屏坐标,通过公式(13)将坐标与相位建立关系。
$$ \begin{array}{c}\begin{array}{c}u=2\times \pi \times x\times \tau \end{array}=2\times \pi \times x\times \dfrac{m}{L}\end{array} $$ (13) 式中:$ x $为LCD平面上的$ x $方向坐标;$ \tau $为条纹空间频率;$ m $为条纹数目;$ L $为LCD的边长。$ y $方向同理。
实验中以显示64条纹时的频率为基础频率,根据条纹周期对频率进行限制,频率选取区间为0.375<$ {k}_{w} $<2.25。设定背景光强与上下表面调制度,通过公式(5)编码生成多频加四步相移条纹图,横竖寄生反射条纹如图6所示。

图 6 寄生反射条纹。(a) 横条纹;(b) 竖条纹
Figure 6. Parasitic reflection of fringe. (a) Horizontal fringe; (b) Vertical fringe
以透明玻璃板上表面相位迭代为例,给定初始相位值,将多频四步条纹图代入公式(11)中迭代计算得到折叠相位。由于初始值与真实值存在偏差,某些点的$ R $矩阵接近奇异矩阵,逆矩阵求解存在问题,导致折叠相位计算存在一定的跳变。根据展开相位的连续性,将折叠相位进行展开再近似插值跳变区域的相位。通过迭代缩小跳变区域能够在一定程度上改善相位,但是插值计算所需时间较长。因此,采用在奇异值分解中加入正则化的方法在一定程度上提高折叠相位的精确性和稳定性,如图7所示。此方法适用于折叠相位跳变区域较小的情况,若跳变区域过大,则难以实现有效的优化。
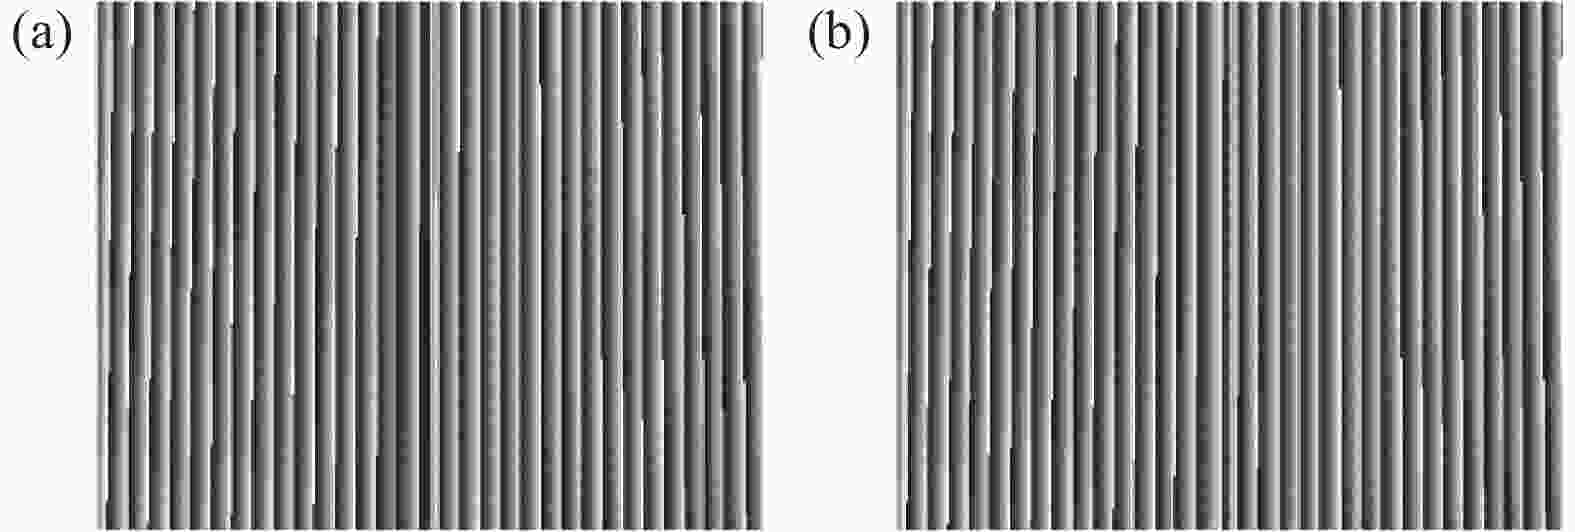
图 7 折叠相位优化。(a) 优化前;(b) 优化后
Figure 7. Wrapped phase optimization. (a) Before optimization; (b) After optimization
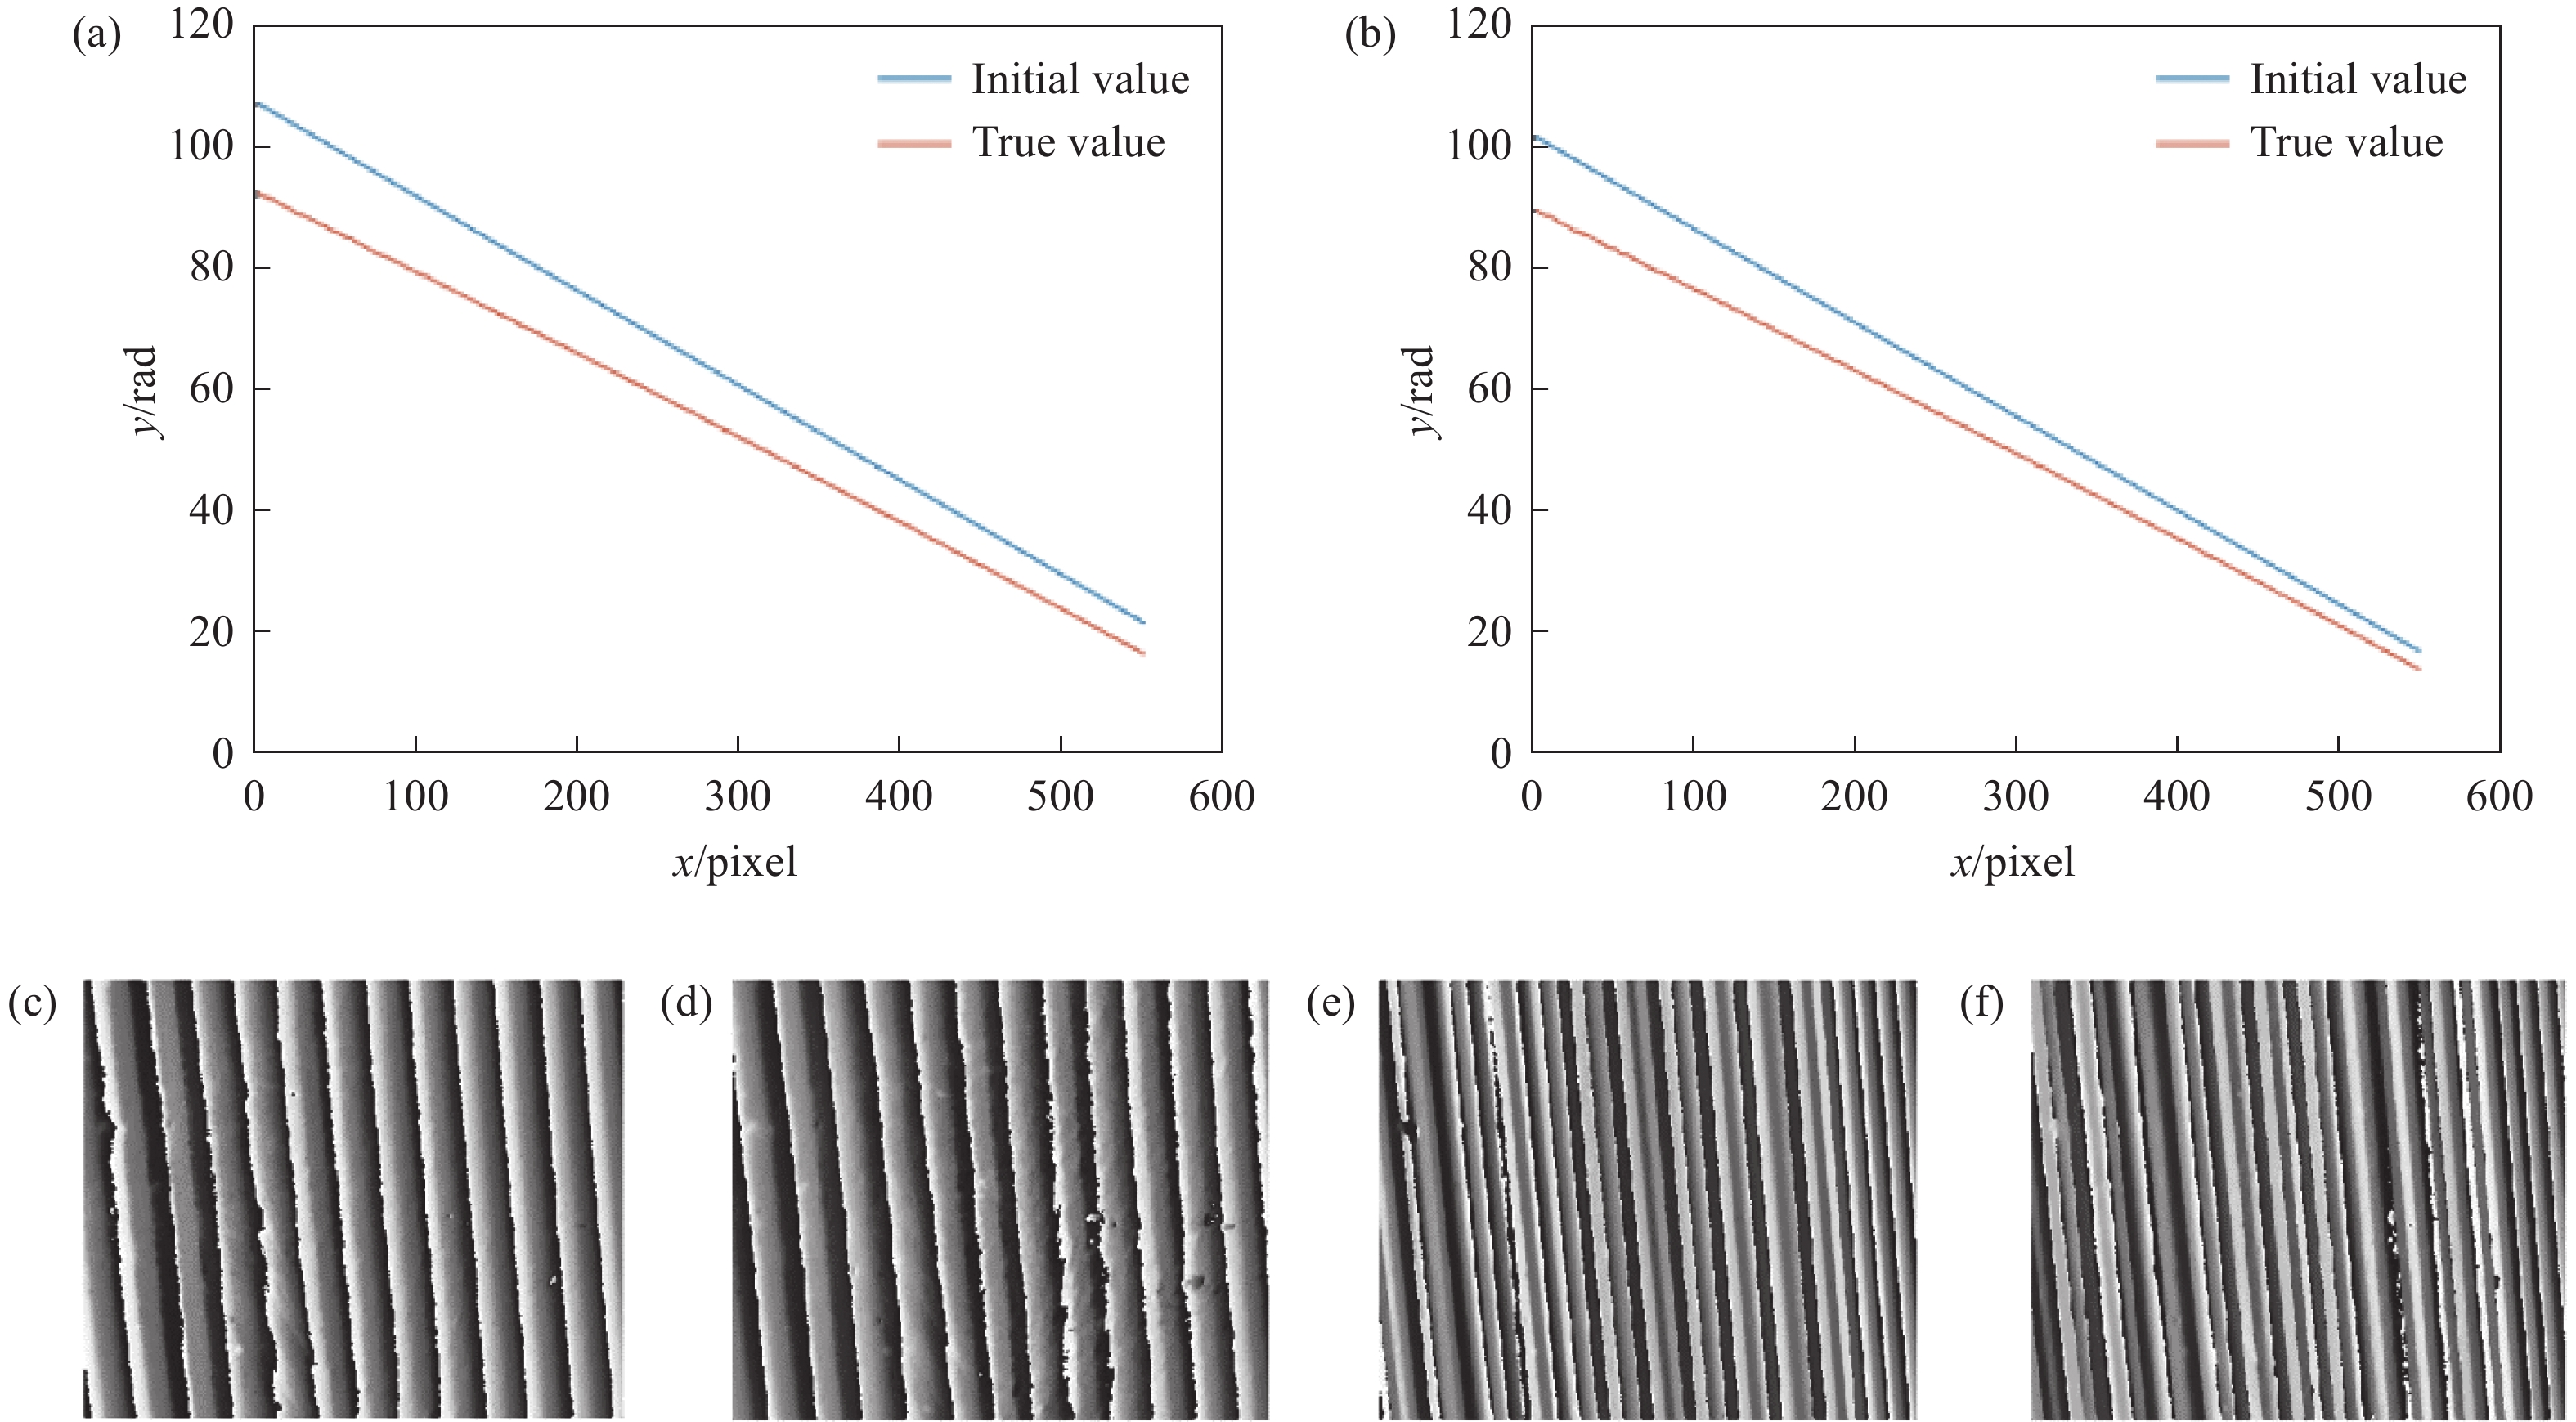
通过仿真比较不同频率数量下折叠相位的计算效果,确定最佳频率数量。六种频率仍受一定程度的噪声影响,八种频率计算效果良好但更多频率的采集会影响采集时间,因此选择七种频率在保证精度的同时减少测量计算所需时间。对折叠相位进行展开,选取展开相位某一行的剖面图与真值进行比较。随着迭代次数增加,计算相位值与真值之间的相位差逐渐减小,在图中显示两个物理量之间的均方根误差,如图8所示。

图 8 相位与真值对比。 (a) 初始相位;(b) 第一次迭代;(c) 第二次迭代;(d) 第三次迭代
Figure 8. Comparison between phase and true value. (a) Initial phase; (b) First iteration; (c) Second iteration; (d) Third iteration
在仿真中经过6次迭代后,相邻两次相位的相位差值平均达10−7 rad数量级,差值满足小于阈值ε的精度条件,此时迭代停止。将计算相位值与相位真值作差,得到相位误差结果图,如图9所示。迭代后的计算相位值与真值的差值达10−4 rad的精度。仿真数据结果表明该算法计算精度较高,能够实现寄生反射条纹相位分离,可用于后续实验。
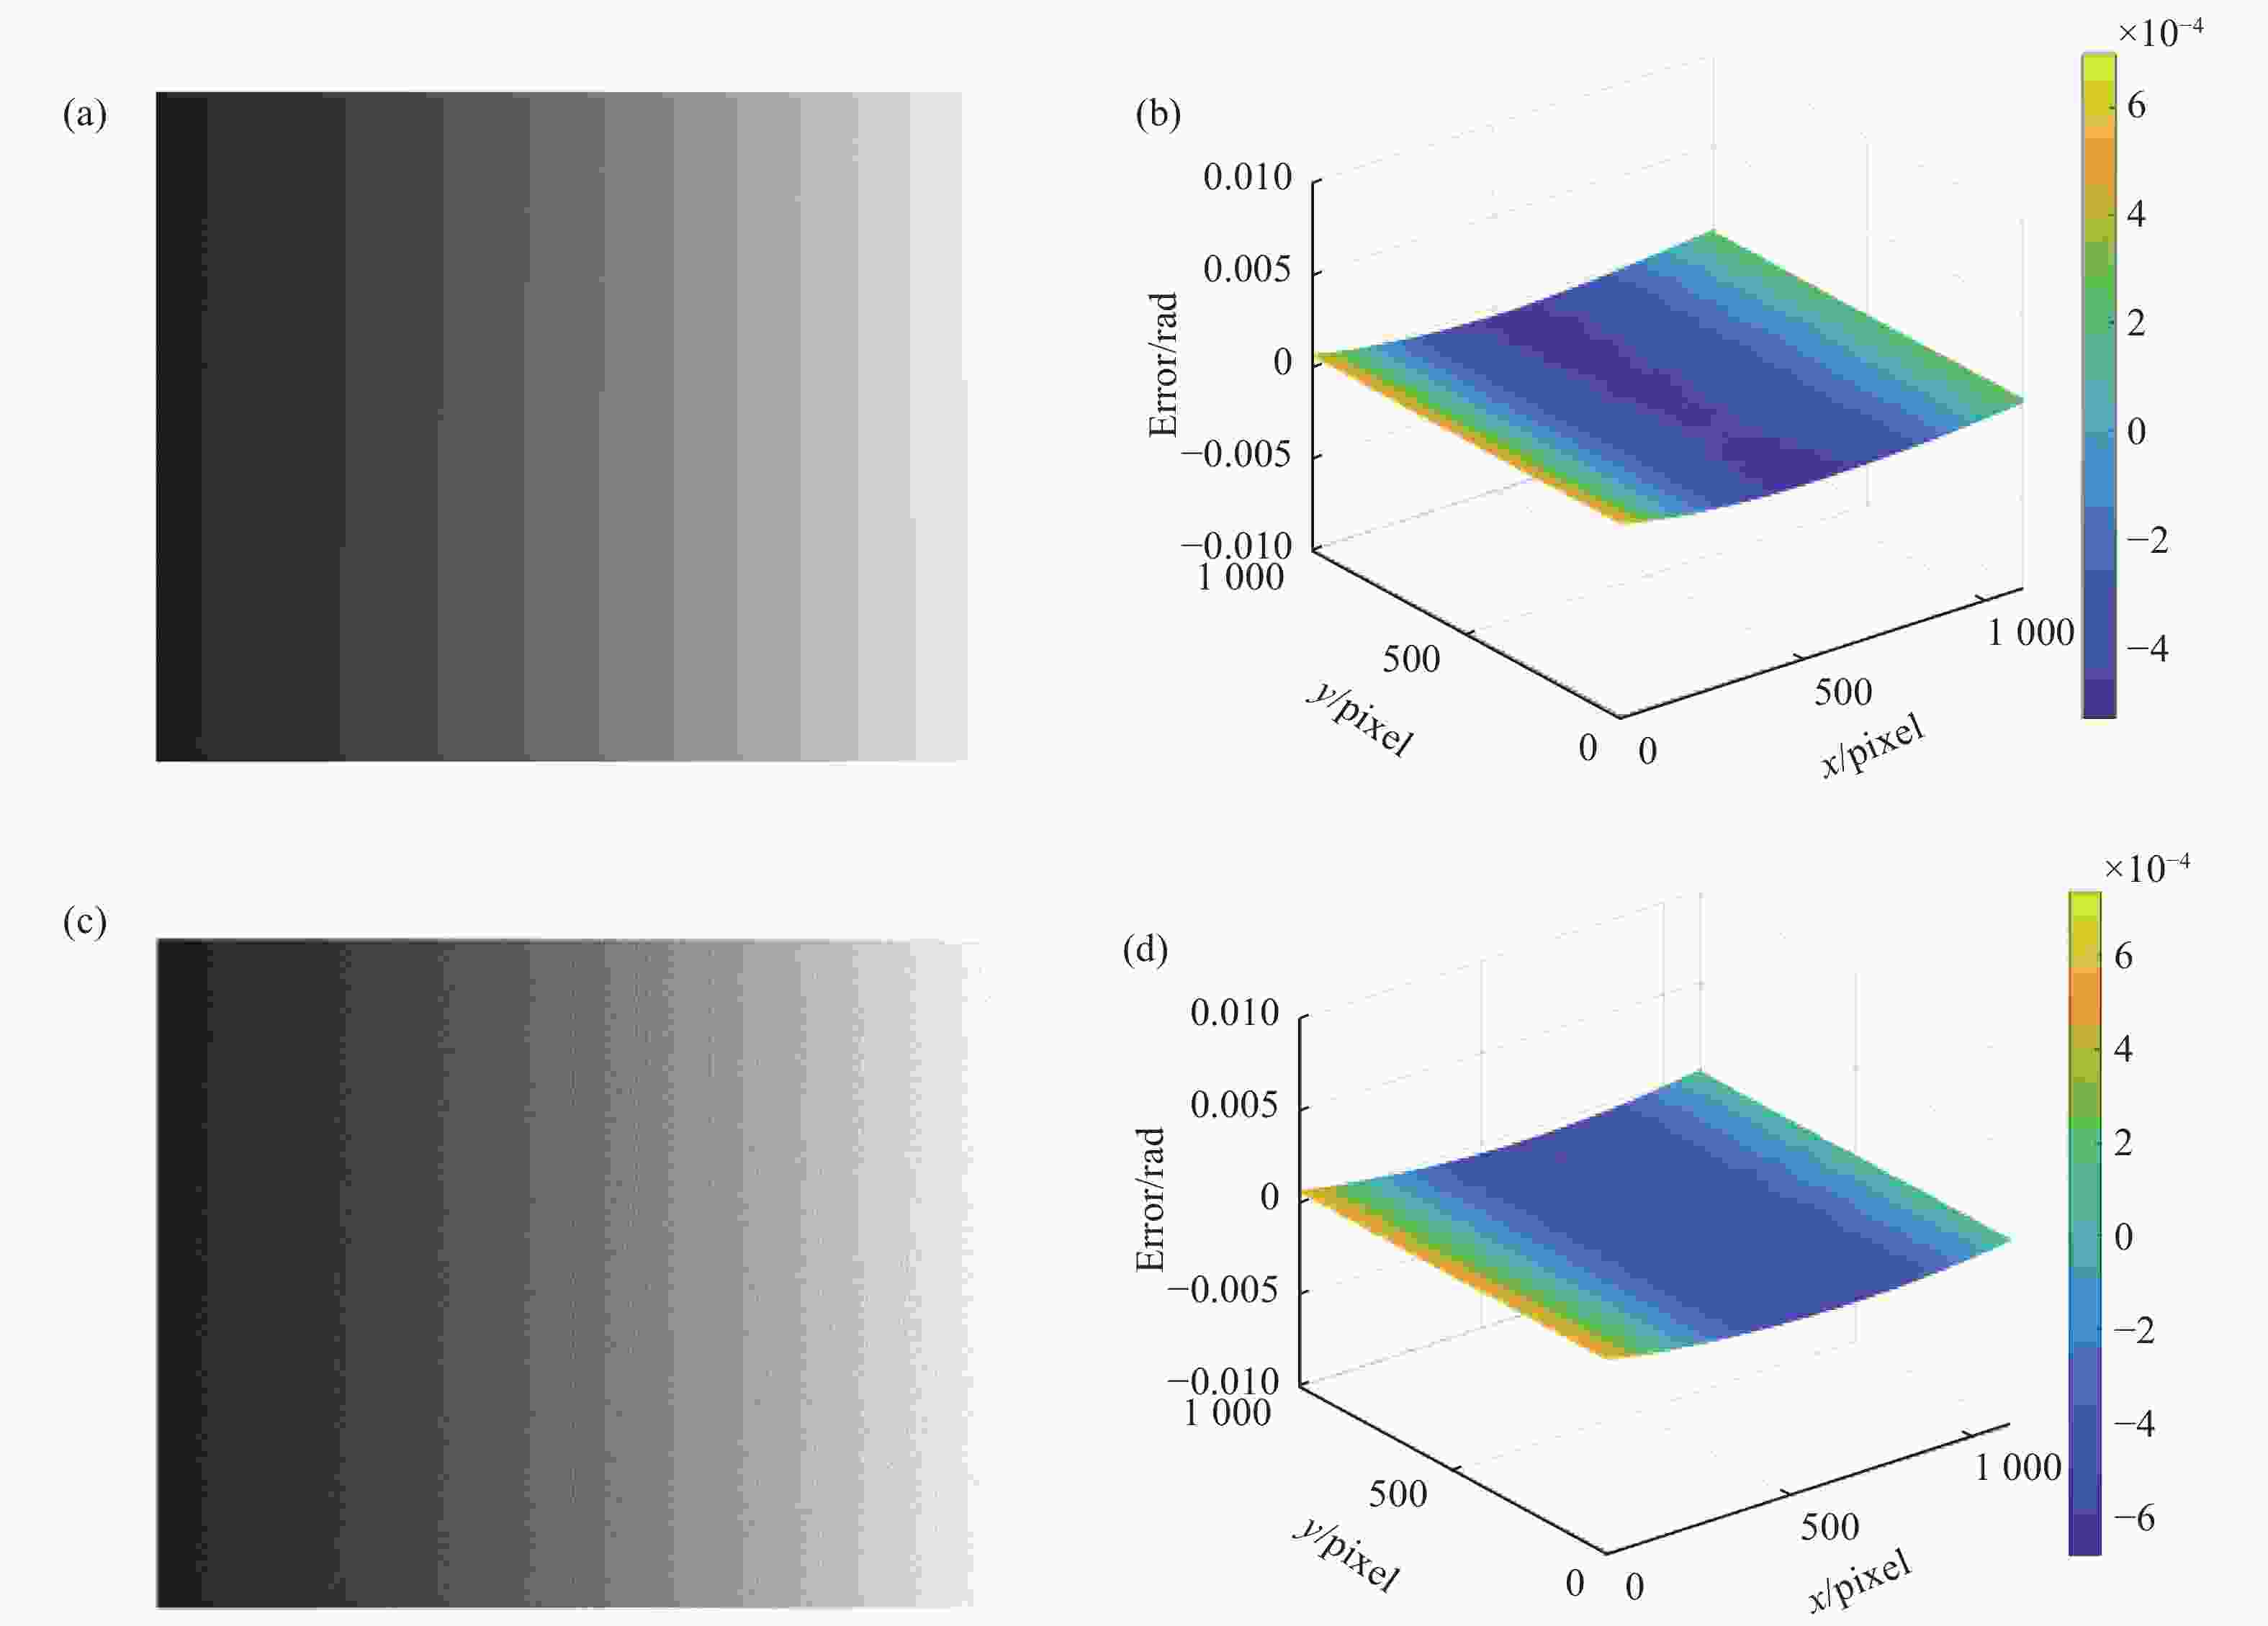
图 9 相位计算结果及真值作差。 (a) 上表面相位;(b) 上表面相位差;(c) 下表面相位;(d) 下表面相位差
Figure 9. The difference between the phase calculation result and the true value. (a) The upper surface phase; (b) Phase difference of the upper surface; (c) Lower surface phase; (d) Phase difference of the lower surface
-
透明物体表面三维形貌测量系统由一个LCD显示屏(分辨率为3 840 pixel×2 160 pixel,像素尺寸为0.076 5 mm)、一个CCD相机(型号为ECO655 CVGE,分辨率为2 448 pixel×2 050 pixel,像素尺寸为3.45 μm,焦距为12~36 mm的变焦镜头)和计算机组成,如图10所示。在透明物体背面放一张粗糙的黑纸,避免物体背面环境光的干扰。

图 10 硬件系统结构图
Figure 10. Hardware system structure diagram
-
根据测量原理,将相机聚焦在参考平面,使用张正友标定法对相机内部参数进行标定,之后利用相机参数进行图像畸变校正、梯度标定和系统参数标定。为了验证梯度标定精度,控制三轴转台沿水平轴、垂直轴各旋转0.5°,将平面标靶置于旋转后平面位置。通过相机拍摄平面标靶并提取特征点像素坐标确定旋转后平面在相机坐标系下的旋转矩阵和平移向量。根据旋转矩阵确定旋转后的平面法向量,根据法向量计算相应的梯度数据。显示屏显示横竖条纹,相机采集标定板上的变形条纹图,获取相位后利用公式(12)计算。计算测量结果与真值的绝对误差如表1所示。梯度标定误差达10−5量级,标定精度较高,可用于后续实验。
表 1 x、y梯度值及绝对误差
Table 1. x, y gradient values and absolute error
Actual value True value Gradient difference x 0.00467 0.00468 –0.00001 y 0.00598 0.00601 –0.00003 -
为了验证所提相位分离方法的可行性,对不同厚度的玻璃板进行测量。仿真结果能够在一定程度上指导实际实验,因此通过显示屏显示七种不同频率条纹,加入四步相移。给定透明物体折射率和上下表面基础形状,通过反向射线追踪获取上下表面反射光线与显示屏的交点坐标,代入公式(13)确定该点的相位值,逐像素点计算获取相位初始值。相机采集经玻璃板反射的变形条纹图,代入多频相移方程中计算折叠相位并展开。选取3 mm厚度的透明玻璃板作为被测件,将上表面置于参考面位置。图11为玻璃板与相机采集的横竖寄生反射条纹图,图12依次为求解的玻璃板横、竖条纹上下表面展开相位图及展开相位剖面图。
为了验证相位提取算法对不同厚度的可靠性,针对4、6、8、12 mm不同厚度的玻璃板在不同角度、不同位置进相位计算,均能满足设定阈值要求,实现相位的分离。
相比于传统算法,多频相移法能够有效地实现寄生反射条纹相位的分离。并且多频相移法计算相位仅需28幅条纹图,相比于多频法上百幅条纹图的测量需求,缩短了数据采集所需时间,提高了执行效率。
为了验证相位计算方法对迭代稳定性的改善,给定相同条纹图、相同初始相位值对相同区域进行处理,分别采用多频法与多频相移法对透明物体条纹相位进行计算。多频法是在固定相移的基础上,仅显示不同频率的条纹,利用不同频率的条纹图进行相位计算。

图 11 (a) 透明玻璃板;(b) 横条纹寄生反射;(c) 竖条纹寄生反射
Figure 11. (a) Transparent glass plate; (b) Parasitic reflection of horizontal fringe; (c) Parasitic reflection of vertical fringe
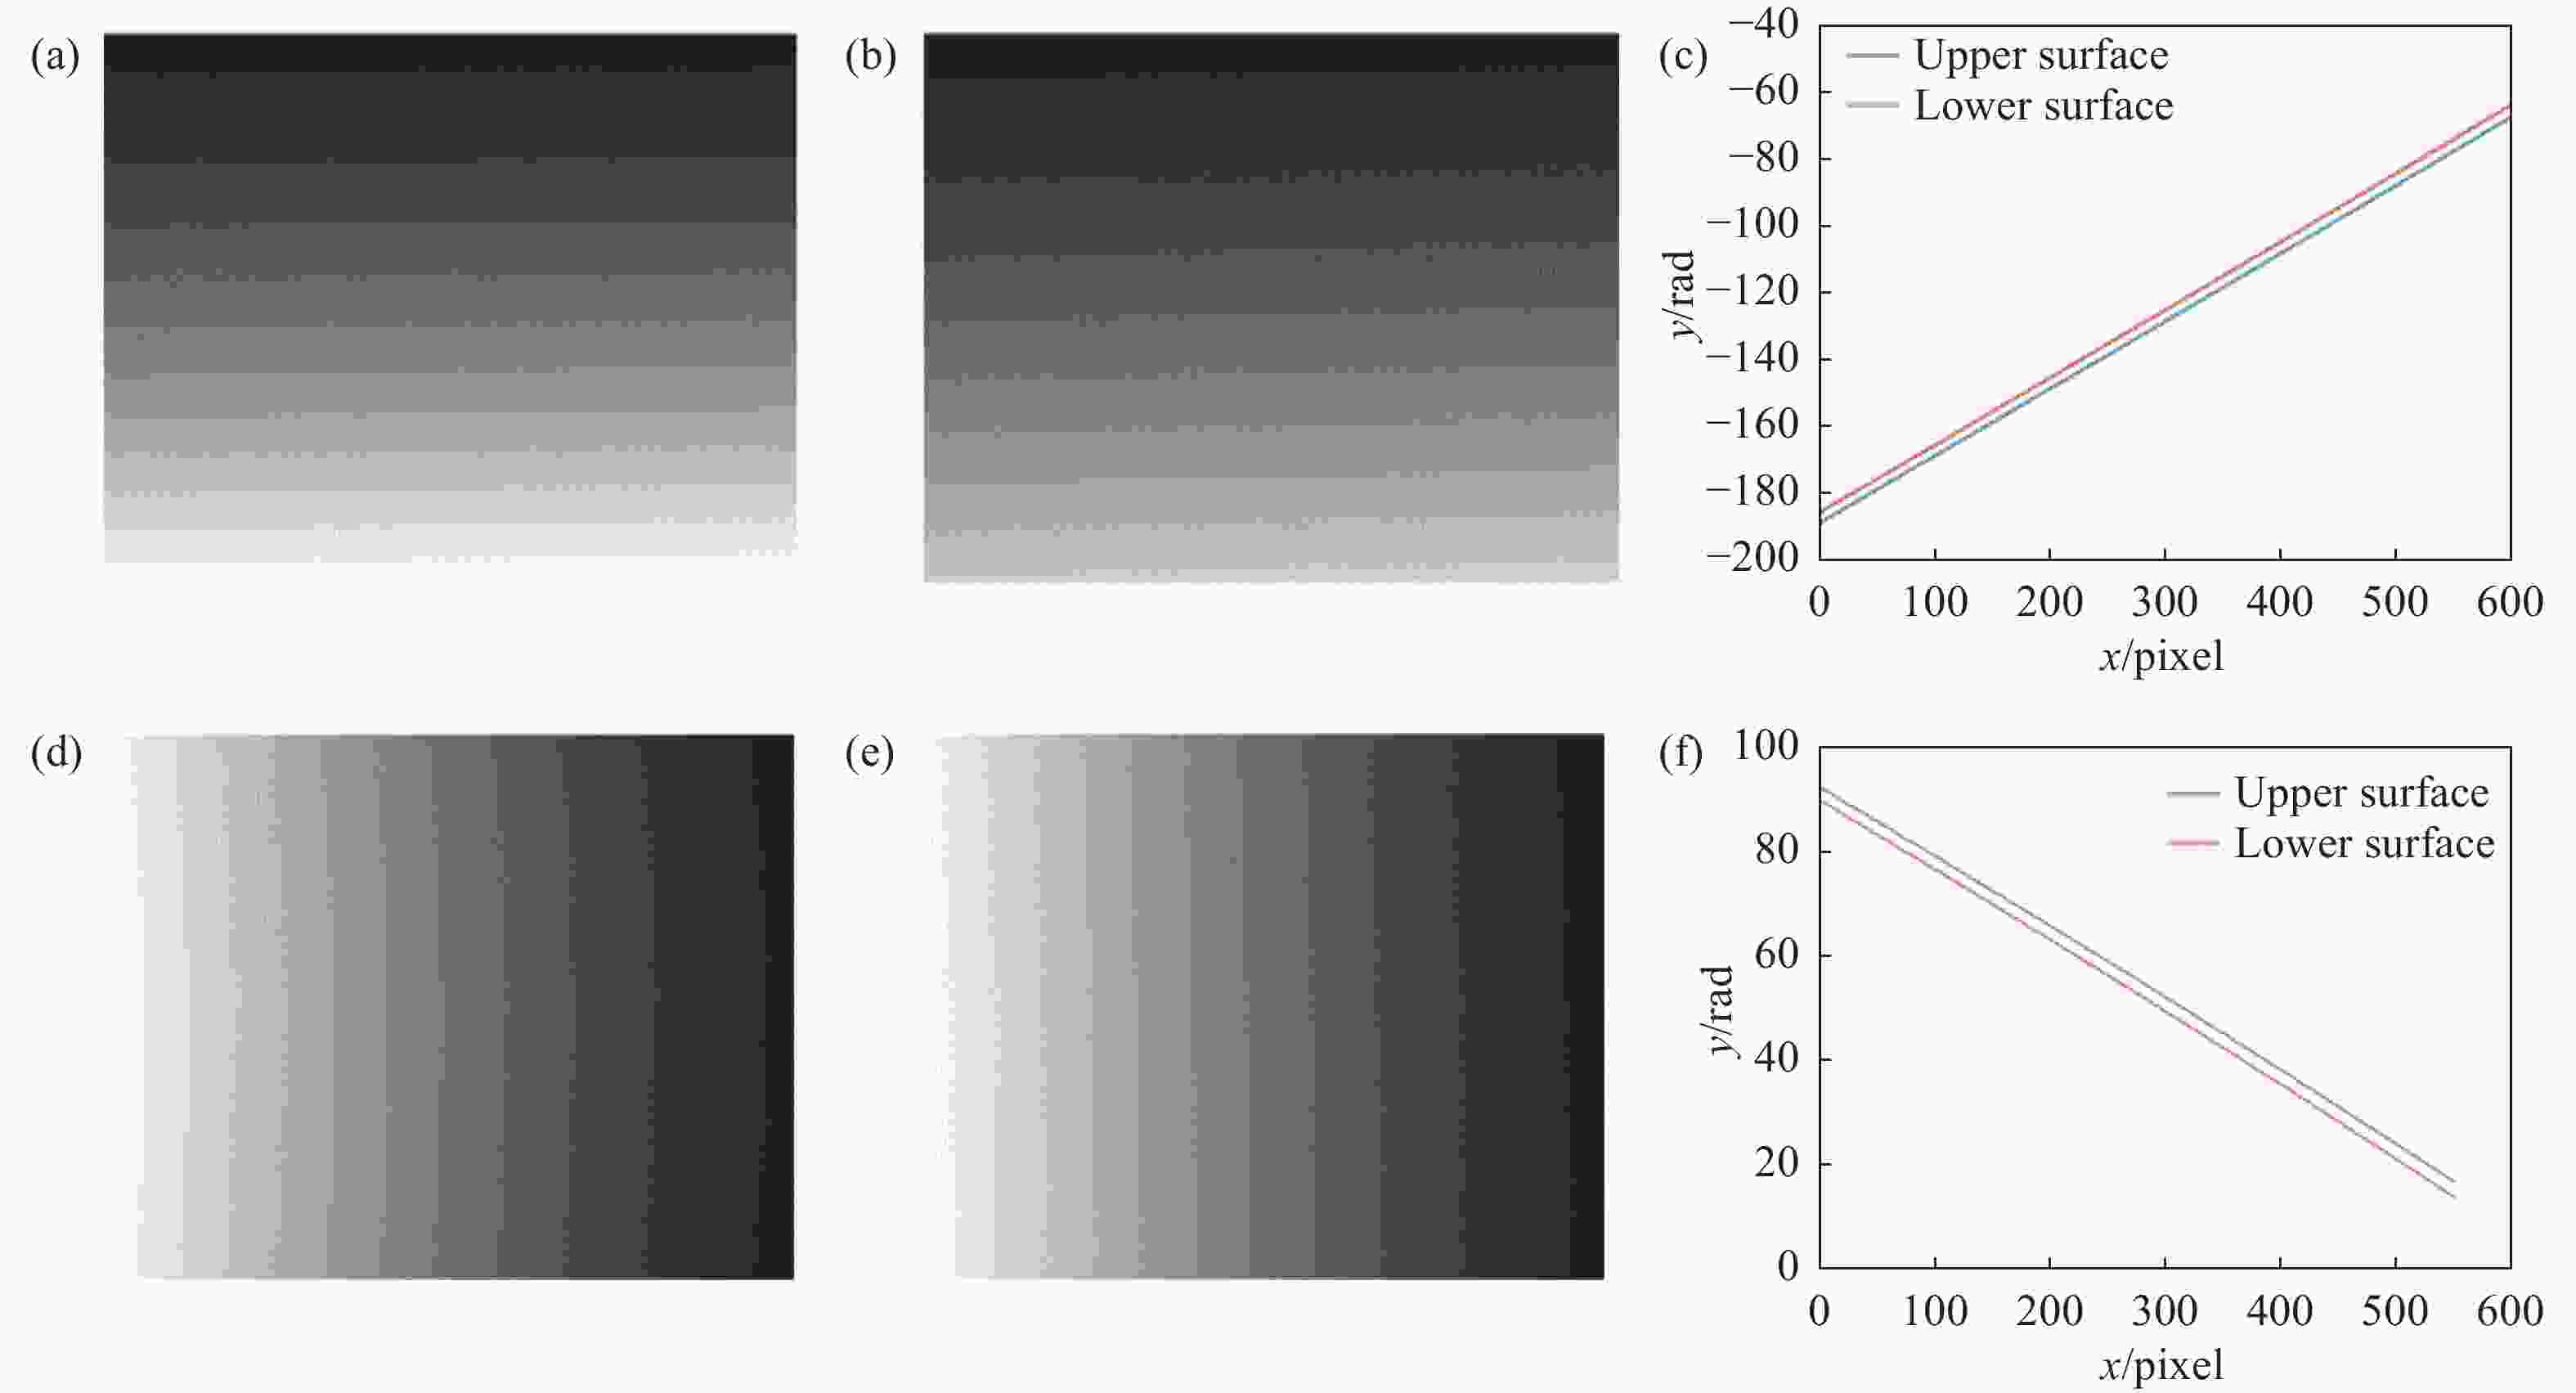
图 12 透明玻璃板相位。 (a) 上表面横条纹;(b) 下表面横条纹;(c) 横条纹展开相位;(d) 上表面竖条纹;(e) 下表面竖条纹;(f) 竖条纹展开相位
Figure 12. Transparent glass plate phase. (a) Horizontal fringes on the upper surface; (b) Horizontal fringes on the lower surface; (c) Horizontal fringe unwrapped phase; (d) Vertical fringes on the upper surface; (e) Vertical fringes on the lower surface; (f) Vertical fringe unwrapped phase
在给定相位初始值与真值偏差较大的情况下,对寄生反射条纹进行一次迭代相位提取,相位初始值与真值相同行列的数值对比以及相位提取结果如图13所示。后续的迭代计算在一次迭代的基础上进行,因此一次迭代的结果能在很大程度上反应后续相位的计算效果。在相位偏差较大的情况下,多频法相位提取结果较差,需重新计算相位初始值。而多频相移法对相位初始值精度要求不高,能够快速收敛得到准确的相位提取结果,提高了数值计算的准确性与稳定性,易于实现后续的相位收敛迭代计算。

图 13 计算方法对比。 (a) 上表面初始值对比;(b) 下表面初始值对比;(c) 多频相移法上表面;(d) 多频相移法下表面;(e) 多频法上表面;(f) 多频法下表面
Figure 13. Comparison of solution methods. (a) Comparison of initial values of the upper surface; (b) Comparison of initial values of the lower surface; (c) Multi-frequency phase-shifting method on the upper surface; (d) Multi-frequency phase shifting method lower surface; (e) Multi-frequency method upper surface; (f) Multi-frequency method lower surface
-
为了验证系统测量精度,以3 mm厚度玻璃板为例,恢复其三维形貌。获取展开相位后,根据标定得到的相位与梯度关系,计算物体表面不同方向的梯度数据。因将物体上表面置于参考面位置,物体上表面的梯度可直接根据相位与梯度的关系直接计算,而下表面的梯度数据需要考虑玻璃板高度以及光线折射引起的相位变化。通过标靶计算下表面相位变化,在进行相位补偿后再计算相应的梯度。图14为透明玻璃板上下表面x、y方向梯度数据。采用传统的southwell积分重建方法对物体形貌进行恢复,图15为透明玻璃板上下表面的三维形貌。

图 14 透明玻璃板表面梯度。(a) 上表面x方向;(b) 上表面y方向;(c) 下表面x方向;(d) 下表面y方向
Figure 14. Surface gradient of transparent glass panels. (a) x direction of the upper surface; (b) y direction of the upper surface; (c) x direction of the lower surface; (d) y direction of the lower surface

图 15 透明玻璃板上下表面三维形貌。 (a) 上表面形貌;(b) 下表面形貌
Figure 15. Three-dimensional morphology of upper and lower surfaces of transparent glass plate. (a) Upper surface morphology; (b) Lower surface morphology
将玻璃板的传统测量结果和多频相移处理后的结果作对比,如表2所示。从实验结果可知,多频相移处理后,平均误差从32.4 μm减少到5.1 μm,与传统方法相比精度得到明显提升。之后,针对不同厚度的玻璃板进行测量,并选取玻璃板几何中心中间行的横截面处数据,测量结果如图16所示。
表 2 透明玻璃板上表面测量结果
Table 2. Measurement results of upper surface of transparent glass plate
Method comparison RMSE/mm PV/mm Traditional method 0.0324 0.1246 Proposed method 0.0051 0.0207 
图 16 不同厚度玻璃板的测量结果。 (a) 6 mm;(b) 6 mm横截面;(c) 12 mm;(d) 12 mm横截面
Figure 16. Measurement results of glass plate with different thickness. (a) 6 mm; (b) 6 mm cross-sectional; (c) 12 mm; (d) 12 mm cross-sectional
最后选取曲率半径为515.09 mm的平凸透镜进行测量。图17为透镜横竖寄生反射条纹图,图18依次为横、竖条纹上下表面折叠相位图。
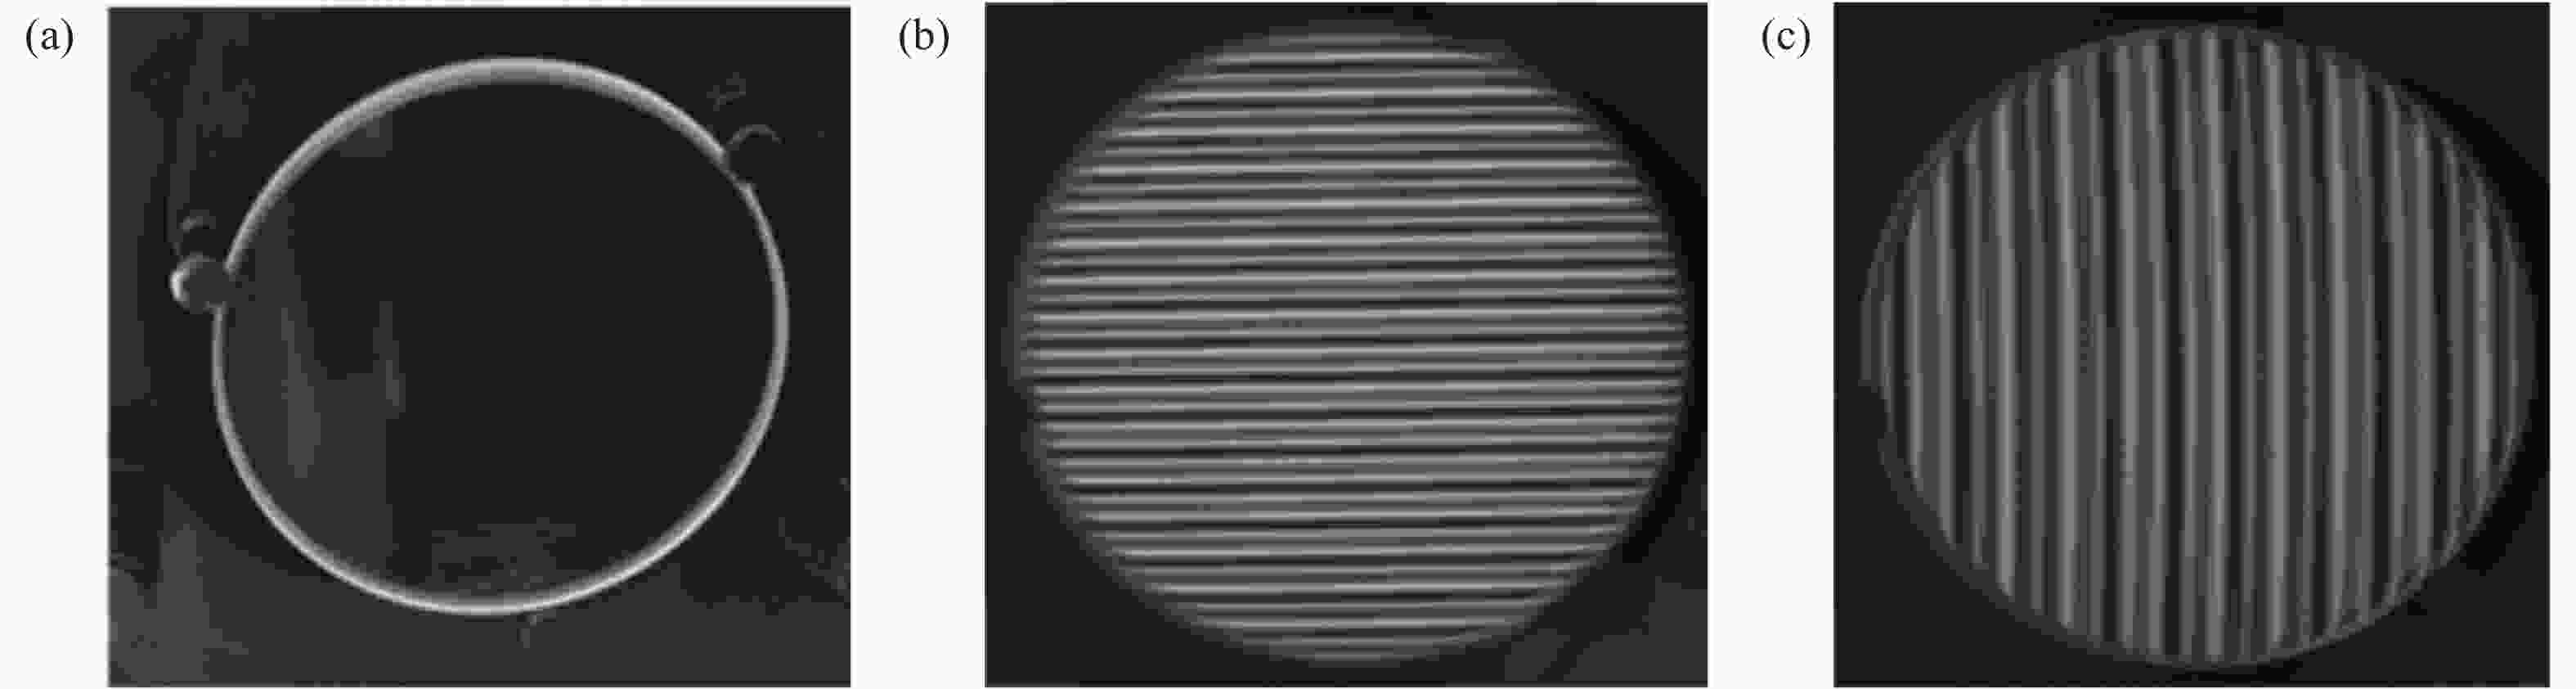
图 17 (a) 平凸透镜;(b) 横条纹寄生反射;(c) 竖条纹寄生反射
Figure 17. (a) Plano-convex lens; (b) Parasitic reflection of horizontal fringe; (c) Parasitic reflection of vertical fringe

图 18 透镜折叠相位。 (a) 上表面横条纹;(b) 下表面横条纹;(c) 上表面竖条纹;(d) 下表面竖条纹;
Figure 18. Calculation and comparison of lens phase. (a) Horizontal fringes on the upper surface; (b) Horizontal fringes on the lower surface; (c) Vertical fringes on the upper surface; (d) Vertical fringes on the lower surface
对平凸透镜凸面部分进行三维形貌恢复,如图19所示。为验证形貌测量精度,根据形貌数据计算平凸透镜的平均曲率半径为515.117 mm,与给定真值误差为27 μm。

图 19 平凸透镜三维形貌
Figure 19. Three-dimensional morphology of plano-convex lens
-
提出了一种基于多种频率测量透明物体表面三维形貌的方法。通过显示不同频率的条纹图,加入多步相移,利用最小二乘法多次迭代实现了透明物体寄生反射条纹的分离,建立了绝对相位与梯度之间的关系。利用梯度积分恢复物体表面的三维形貌。实验结果表明:所提方法弥补了传统相位偏折测量术相位分离的不足,能够有效测量透明物体的表面三维形貌。与传统测量透明物体三维形貌的方法相比较,所提方法既提高了迭代算法的可实现性与数值稳定性,又提高了形貌测量的精度。
3D shape measurement of transparent objects by phase deflection based on multi-frequency phase shift
-
摘要: 光学三维测量中的相位偏折测量术以其快速、高精度、稳定抗干扰的优点,在光学表面测量、快速检测等领域得到广泛应用。透明物体因其上下表面的折射和反射,导致相机采集到不同表面反射叠加的混合条纹,传统的相位偏折测量术难以对其进行有效的三维测量。为解决该问题,文中提出一种基于多频相移的相位偏折法测量透明物体的表面三维形貌。首先,显示屏显示多种不同频率与多步相移结合的正弦条纹,从另外一个角度相机采集物体表面反射的混合条纹。然后,利用最小二乘法迭代将混合条纹进行分离,得到上下表面折叠相位并展开。接着,通过梯度标定确定相位与梯度的关系,根据梯度积分恢复透明物体表面的三维形貌。最后,实验证明所提方法能够有效实现混合条纹的分离,实测透明玻璃板上表面的平均误差从32.4 μm减少到5.1 μm,结果验证了混合条纹分离方法的有效性,提升了透明物体表面三维形貌测量精度。与已有方法相比,文中方法可以有效避免初始相位值偏差较大带来的影响,缩短计算时间,适用于不同形状透明物体表面三维形貌的测量。Abstract:
Objective Phase Measuring Deflectometry (PMD) in optical 3D measurement is widely used in optical surface measurement, rapid detection and other fields because of its advantages of rapid speed, high precision, stability and anti-interference. Due to the refraction and reflection of the upper and lower surfaces of transparent objects, the camera collects mixed fringes with different surface reflections. It is difficult for traditional PMD to measure them effectively in three dimensions. The existing phase extraction methods require high accuracy of the initial phase and need to collect a large number of fringe patterns. In order to solve this problem, a PMD method based on multi-frequency phase-shifting is proposed to measure the 3D morphology of transparent objects surface. Methods This study proposes a multi-frequency phase-shifting-based PMD for measuring the 3D surface morphology of transparent objects. Firstly, the display screen shows a variety of sinusoidal fringes with different frequencies combined with multi-step phase shift, and the camera collects the mixed fringes reflected and superimposed on the surface of the object from another angle. Subsequently, the mixed fringes are separated iteratively by the least square method, and the wrapped phase of the upper and lower surfaces are obtained, and the unwrapping phase is obtained by the optimum three-fringe selection method in temporal phase unwrapping. Then, the relationship between phase and gradient is determined by gradient calibration, and the gradient of the measured object relative to the reference plane is determined according to the unwrapped phase. Finally, the gradient integral is used to restore the 3D morphology of the transparent object surface. Results and Discussions In order to prove the effectiveness of the proposed method, a glass plate with a thickness of 3 mm and a plano-convex lens with a radius of curvature of 515.09 mm were measured, and a comparative experiment was conducted between the multi-frequency phase-shifting method and the multi-frequency method to verify the effectiveness of the proposed phase separation method (Fig.14). The experimental results show that the proposed method can effectively measure the 3D morphology of transparent objects surface (Fig.16, Fig.19). Compared with the existing methods, the average error of measuring the upper surface of transparent glass plate is reduced from 32.4 μm to 5.1 μm (Tab.2). This method can effectively avoid the influence caused by the large deviation of initial phase value, shorten the calculation time, and is suitable for 3D shape measurement of transparent objects with different shapes. Conclusions A method for measuring the 3D morphology of transparent objects surface based on multiple frequencies is proposed. This method makes up for the deficiency of phase separation in traditional phase deflection measurement and can effectively measure the 3D morphology of transparent objects surface. Through the combination of different frequency fringes and multi-step phase-shifting, the upper and lower surfaces of transparent objects are separated by using the least square method for multiple iterations, which reduces the accuracy requirements of initial phase values, improves the numerical stability, is easy to realize phase convergence operation and shortens the calculation time. Compared with the traditional methods, it can be concluded that the proposed method of measuring the 3D topography of transparent objects based on multiple frequencies improves not only the realizability and numerical stability of iterative algorithm, but also the accuracy of topography measurement. -
图 6 寄生反射条纹。(a) 横条纹;(b) 竖条纹
Figure 6. Parasitic reflection of fringe. (a) Horizontal fringe; (b) Vertical fringe
图 7 折叠相位优化。(a) 优化前;(b) 优化后
Figure 7. Wrapped phase optimization. (a) Before optimization; (b) After optimization
图 8 相位与真值对比。 (a) 初始相位;(b) 第一次迭代;(c) 第二次迭代;(d) 第三次迭代
Figure 8. Comparison between phase and true value. (a) Initial phase; (b) First iteration; (c) Second iteration; (d) Third iteration
图 9 相位计算结果及真值作差。 (a) 上表面相位;(b) 上表面相位差;(c) 下表面相位;(d) 下表面相位差
Figure 9. The difference between the phase calculation result and the true value. (a) The upper surface phase; (b) Phase difference of the upper surface; (c) Lower surface phase; (d) Phase difference of the lower surface
图 11 (a) 透明玻璃板;(b) 横条纹寄生反射;(c) 竖条纹寄生反射
Figure 11. (a) Transparent glass plate; (b) Parasitic reflection of horizontal fringe; (c) Parasitic reflection of vertical fringe
图 12 透明玻璃板相位。 (a) 上表面横条纹;(b) 下表面横条纹;(c) 横条纹展开相位;(d) 上表面竖条纹;(e) 下表面竖条纹;(f) 竖条纹展开相位
Figure 12. Transparent glass plate phase. (a) Horizontal fringes on the upper surface; (b) Horizontal fringes on the lower surface; (c) Horizontal fringe unwrapped phase; (d) Vertical fringes on the upper surface; (e) Vertical fringes on the lower surface; (f) Vertical fringe unwrapped phase
图 13 计算方法对比。 (a) 上表面初始值对比;(b) 下表面初始值对比;(c) 多频相移法上表面;(d) 多频相移法下表面;(e) 多频法上表面;(f) 多频法下表面
Figure 13. Comparison of solution methods. (a) Comparison of initial values of the upper surface; (b) Comparison of initial values of the lower surface; (c) Multi-frequency phase-shifting method on the upper surface; (d) Multi-frequency phase shifting method lower surface; (e) Multi-frequency method upper surface; (f) Multi-frequency method lower surface
图 14 透明玻璃板表面梯度。(a) 上表面x方向;(b) 上表面y方向;(c) 下表面x方向;(d) 下表面y方向
Figure 14. Surface gradient of transparent glass panels. (a) x direction of the upper surface; (b) y direction of the upper surface; (c) x direction of the lower surface; (d) y direction of the lower surface
图 15 透明玻璃板上下表面三维形貌。 (a) 上表面形貌;(b) 下表面形貌
Figure 15. Three-dimensional morphology of upper and lower surfaces of transparent glass plate. (a) Upper surface morphology; (b) Lower surface morphology
图 16 不同厚度玻璃板的测量结果。 (a) 6 mm;(b) 6 mm横截面;(c) 12 mm;(d) 12 mm横截面
Figure 16. Measurement results of glass plate with different thickness. (a) 6 mm; (b) 6 mm cross-sectional; (c) 12 mm; (d) 12 mm cross-sectional
图 17 (a) 平凸透镜;(b) 横条纹寄生反射;(c) 竖条纹寄生反射
Figure 17. (a) Plano-convex lens; (b) Parasitic reflection of horizontal fringe; (c) Parasitic reflection of vertical fringe
图 18 透镜折叠相位。 (a) 上表面横条纹;(b) 下表面横条纹;(c) 上表面竖条纹;(d) 下表面竖条纹;
Figure 18. Calculation and comparison of lens phase. (a) Horizontal fringes on the upper surface; (b) Horizontal fringes on the lower surface; (c) Vertical fringes on the upper surface; (d) Vertical fringes on the lower surface
表 1 x、y梯度值及绝对误差
Table 1. x, y gradient values and absolute error
Actual value True value Gradient difference x 0.00467 0.00468 –0.00001 y 0.00598 0.00601 –0.00003  下载: 导出CSV
表 2 透明玻璃板上表面测量结果
Table 2. Measurement results of upper surface of transparent glass plate
Method comparison RMSE/mm PV/mm Traditional method 0.0324 0.1246 Proposed method 0.0051 0.0207
下载: 导出CSV
-
[1] 伏燕军, 韩勇华, 陈元等. 基于相位编码的三维测量技术研究进展 [J]. 红外与激光工程, 2020, 49(3): 0303010. Fu Y J, Han Y H, Chen Y, et al. Research progress of 3D measurement technology based on phase coding [J]. Infrared and Laser Engineering, 2020, 49(3): 0303010. (in Chinese) [2] 王月敏, 张宗华, 高楠. 基于全场条纹反射的镜面物体三维面形测量综述 [J]. 光学精密工程, 2018, 26(5): 1014-1027. doi: 10.3788/OPE.20182605.1014 Wang Y M, Zhang Z H, Gao N. Review on three-dimensional surface measurements of specular objects based on full-field fringe reflection [J]. Optics and Precision Engineering, 2018, 26(5): 1014-1027. (in Chinese) doi: 10.3788/OPE.20182605.1014 [3] Tao S, Zheng W W, Yu Y J, et al. Determination of surface profiles of transparent plates by means of laser interferometry with wavelength tuning [J]. Optics and Lasers in Engineering, 2019, 115: 59-66. doi: 10.1016/j.optlaseng.2018.11.008 [4] 王张颖, 张宁宁, 高楠等. 基于单色条纹投影的高动态范围物体表面形貌三维测量 [J]. 红外与激光工程, 2023, 52(8): 20230327. Wang Z Y, Zhang N N, Gao N, et al. 3D surface shape measurement of high dynamic range object based on monochrome fringe projection [J]. Infrared and Laser Engineering, 2023, 52(8): 20230327. (in Chinese) [5] 朱坡, 张宗华, 高楠等. 彩色高反光物体表面三维形貌测量技术 [J]. 红外与激光工程, 2023, 52(7): 20220761. Zhu P, Zhang Z H, Gao N, et al. Three-dimensional surface topography measurement technology of color highly reflective objects [J]. Infrared and Laser Engineering, 2023, 52(7): 20220761. (in Chinese) [6] 张宗华, 刘小红, 郭志南等. 基于结构光的镜面/漫反射复合表面形貌测量 [J]. 红外与激光工程, 2020, 49(3): 0303015. Zhang Z H, Liu X H, Guo Z N, et al. Shape measurement of specular/diffuse complex surface based on structured light [J]. Infrared and Laser Engineering, 2020, 49(3): 0303015. (in Chinese) [7] 吴雨祥. 基于光学三维成像的镜面物体表面质量检测方法研究[D]. 成都: 电子科技大学, 2017. Wu Y X. Study on specular surface quality inspection based on optical three dimensional metrology[D]. Chengdu: University of Electronic Science and Technology of China, 2017. (in Chinese) [8] Huang L, Xue J P, Gao B, et al. Zonal wavefront reconstruction in quadrilateral geometry for phase measuring deflectometry [J]. Applied Optics, 2017, 56(18): 5139-5144. doi: 10.1364/AO.56.005139 [9] Wu Y X, Yue H M, Li M Y, et al. Study on the measurement error and scope of analytical gradient model in phase measuring deflectometry [J]. Results in Physics, 2018, 11: 994-998. doi: 10.1016/j.rinp.2018.10.043 [10] 许小波, 段明辉, 范鑫等. 基于条纹调制的透明物体表面缺陷检测方法 [J]. 光学学报, 2023, 43(5): 0512003. doi: 10.3788/AOS221593 Xu X B, Duan M H, Fan X, et al. Surface defect detection of transparent objects using fringe modulation [J]. Acta Optica Sinica, 2023, 43(5): 0512003. (in Chinese) doi: 10.3788/AOS221593 [11] 于雪. 透明物体三维轮廓的偏振测量方法研究[D]. 沈阳: 沈阳工业大学, 2022. Yu X. Research on polarization measurement method of transparent object with 3-D profile[D]. Shenyang: Shenyang University of Technology, 2022. (in Chinese) [12] Häusler G, Faber C, Olesch E, et al. Deflectometry vs interferometry[C]//Optical Measurement Systems for Industrial Inspection VIII. International Society for Optics and Photonics, 2013, 8788: 87881C1. [13] Yuk C L, Li L C. Untangling parasitic reflection in phase measuring deflectometry by multi-frequency phase-shifting [J]. Applied Optics, 2022, 61(1): 208-222. doi: 10.1364/AO.443274 [14] Wang R Y, Li D H, Xu K Y, et al. Study on eliminating the effect of parasitic reflection on deflectometry measurement of planar optical element surface figure[C]//Proceedings of SPIE, International Symposium on Advanced Optical Manufacturing and Testing Technologies: Meta-Surface-Wave and Planar Optics, 2019: 1084119. [15] Zheng W X, Li D H, Wang R Y, et al. Front and back surface measurement of the transparent planar element based on multi-frequency fringe deflectometry [J]. Optics Express, 2022, 30(20): 35409-35430. doi: 10.1364/OE.470304 [16] Huang L, Asundi K A. Phase retrieval from reflective fringe patterns of double-sided transparent objects [J]. Measurement Science and Technology, 2012, 23(8): 085201. doi: 10.1088/0957-0233/23/8/085201 [17] Tao S W, Yue H M, Chen H L, et al. Elimination of parasitic reflections for objects with high transparency in phase measuring deflectometry [J]. Results in Physics, 2019, 15: 102734. doi: 10.1016/j.rinp.2019.102734 [18] Ye J Q, Niu Z Q, Zhang X C, et al. Simultaneous measurement of double surfaces of transparent lenses with phase measuring deflectometry [J]. Optics and Lasers in Engineering, 2021, 137(3): 106356. [19] Li Z H, Hu C P, Zhang J W, et al. Smoothed-truncated-sine (STS) pattern for accuracy improvement in sinusoidal fringe projection profilometry [J]. IEEE Transactions on Instru Mentation and Measurement, 2023, 72: 5015312. -

 点击查看大图

计量
- 文章访问数: 10
- HTML全文浏览量: 4
- PDF下载量: 5
- 被引次数: 0

