


-
The optical and electronic properties of quantum dots are different from those of large particles or bulk materials [ 1] , and their electron energy levels are discrete [ 2] . Many types of quantum dots emit or absorb light at specific frequencies that can be precisely adjusted by changing their size, shape, and materials. There are some active atoms and suspended bonds on the surface of single material quantum dots, and it easy to form the surface defect state, which will affect the photophysical properties of quantum dots. To reduce the influence, a new type of quantum dots is formed by cladding for another or more materials on the quantum dots, which will have some new characteristics compared with the single-material quantum dots, such as quantum size effect, surface effect, dielectric confinement effect and quantum tunnel effect [ 3] . This core-shell structure can eliminate the suspended bonds on the surface of quantum dots and change the properties of their functional groups, therefore, the physical or chemical properties of quantum dots are changed, and their photophysical properties are improved.
The CdTe core-shell semiconductor quantum dots have aroused widespread attention over the past few decades due to their unique nonlinear optics and ultrafast dynamics characteristics, which endow them with potential applications including solar cells [ 4] , optoelectronic devices [ 5] , biological labeling [ 6] , and optical fiber sensing fields [ 7] .
In this work, the nonlinear optics and ultrafast dynamics properties of colloidal CdTe/CdS quantum dots synthesized by the TGA passivation surface method were studied. Meanwhile, the femtosecond Z-scan and time-resolved transient absorption spectroscopy technology were used to measure the nonlinear absorption, nonlinear refraction and ultrafast dynamics characteristics of CdTe/CdS quantum dots with different sizes of core and shell, and consequently to research the effects of core-shell structure on the nonlinear optics and ultrafast dynamics characteristics of quantum dots.
-
The CdTe/CdS quantum dots were synthesized and improved according to the Ref.[ 8]. Typically, took 500 mL of deionized water and put it into a 1000 mL three-necked flask, then added 0.4565 g of CdCl 2·2.5 H 2O, 0.310 mL of TGA solution, passed in N 2, and stirred. The PH value were respectively adjusted to about 9.0, 10.0 and 11.0 with 1 mol/L NaOH solution. Repeated the above experiment three times, and the reflux time were 30 minutes, 1 h and 2 h, respectively. After the reaction, the three-necked flask was cooled to room temperature quickly with cold water.
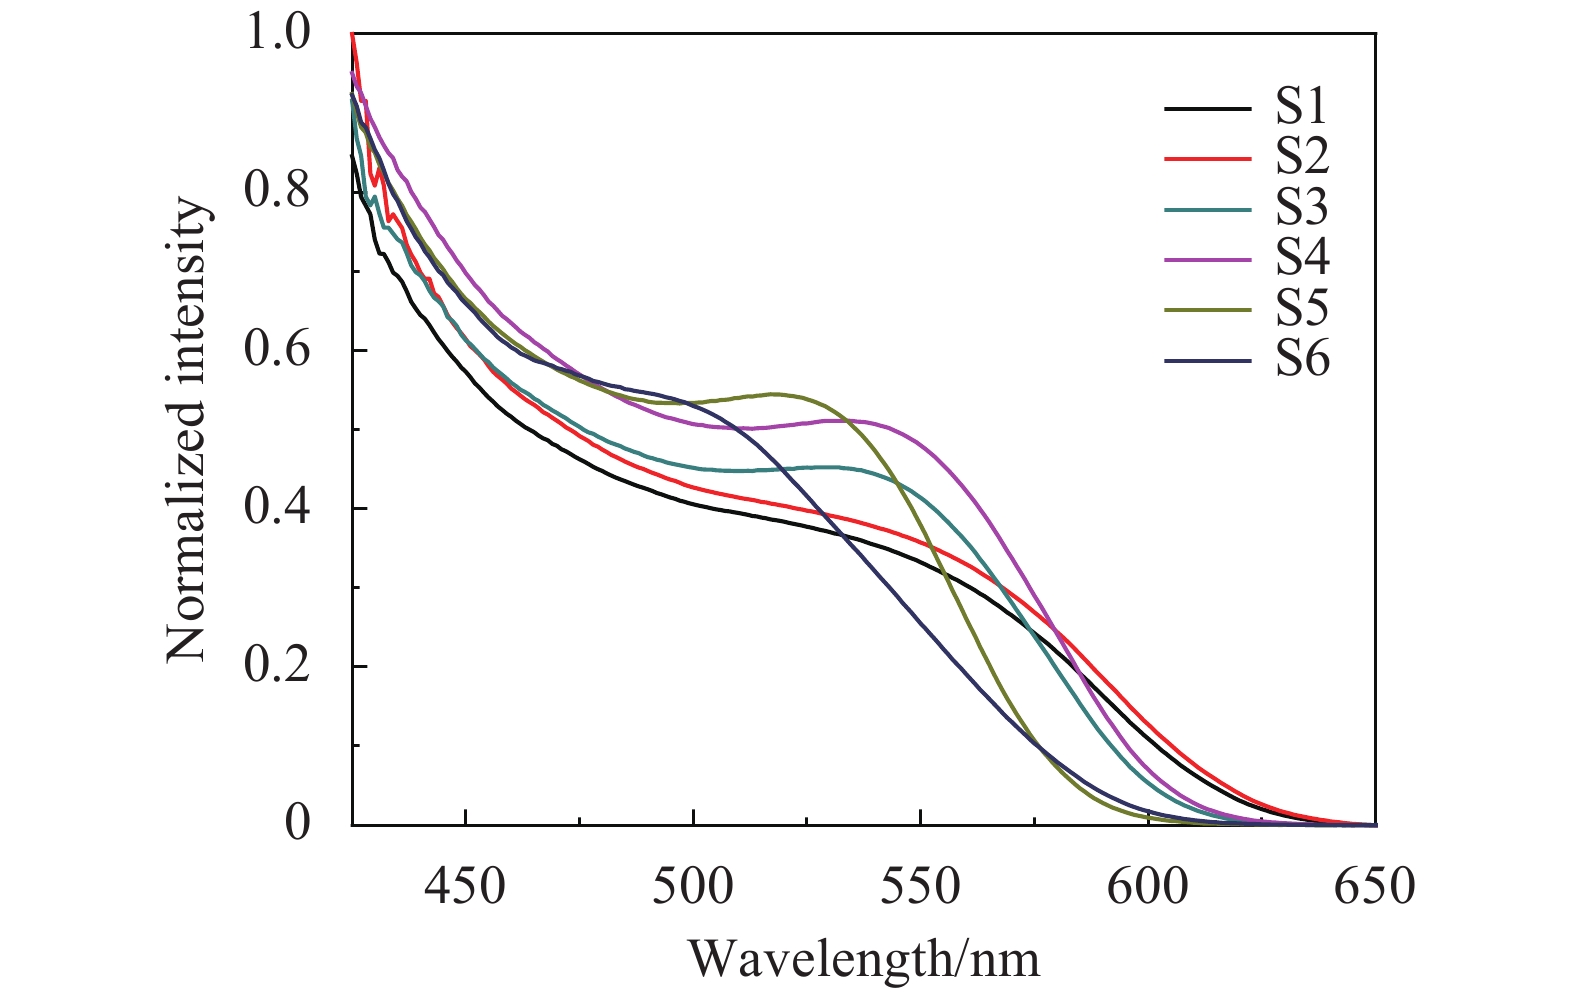
The obtained the CdTe/CdS quantum dot solution was putted into the centrifuge tube, and the ratio of the CdTe/CdS quantum dots to the ethanol in the solution was 1∶2 to 1∶4 (volume ratio), and centrifuged in a high-speed centrifuge, with the rotation speed of 10000 r/min and the time was set for 10 minutes. To sum up, the 6 kinds of water-soluble core-shell quantum dots for UV-Vis absorption spectra are shown in Fig.1.
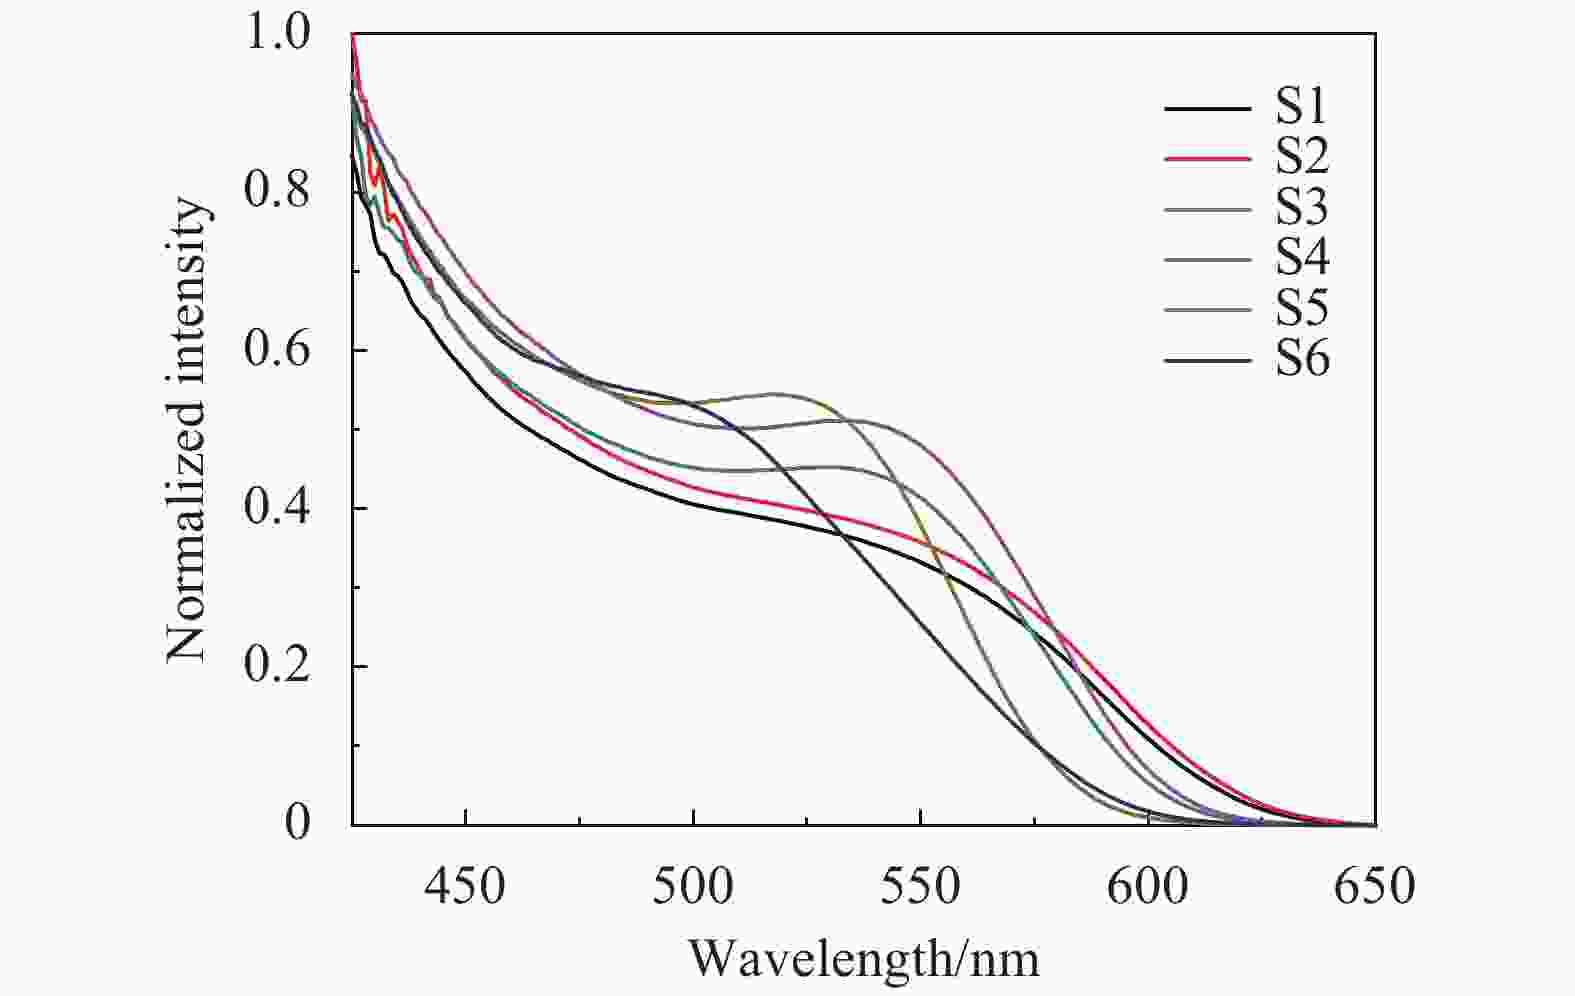
Figure 1. Absorption spectra of the CdTe/CdS quantum dots
Yu's team [ 9] summarized the relationship between the size of quantum dots and the first absorption peak, which can be expressed by Eq.1. The size of sample S1-S6 can be roughly calculated, as shown in Tab.1.
Table 1. Six kinds of the CdTe/CdS core-shell quantum dots
Sample number Quantum dots Size /nm Core color Cladding time S1 CdTe/CdS-1 3.2 Orange 30 min S2 CdTe/CdS-2 3.3 orange 1 h S3 CdTe/CdS-3 3.0 Yellow 30 min S4 CdTe/CdS-4 3.1 Yellow 1 h S5 CdTe/CdS-5 2.6 Green 30 min S6 CdTe/CdS-6 2.7 Green 1 h $$D\! =\! (9.812\;7 \times {10^{ - 7}}){\lambda ^3} \!-\! (1.714\;7 \times {10^{ \!- \!3}}){\lambda ^2} \!+\! 1.006\;4\lambda - 194.84$$ (1) -
The femtosecond Z-scan setup have been described previously in the Ref.[ 10]. The Z-Scan measurements were carried out by a Ti: Sapphire solid femtosecond laser (Coherent Inc, USA), which regenerative amplifer with the repetition of 1 kHz was set to be 130 fs pulse width, and the single-pulse energy was 400 nJ. The central wavelength was 800 nm for this equipment. The laser beam waist radius was measured to be 90 nm by blade method and the linear transmittance of the pin-hole was 0.2 with 2 mm thickness of the sample pool. Three groups of CdTe/CdS quantum dots (S1-S2 of orange core, S3-S4 of yellow core, S5-S6 of green core) with the same cladding material and different core luminescence were selected for comparative testing.
The sample was placed on a movable platform at the focal point of the lens, which moves from the laser to the detector. After the laser pulse passed through the beam splitting, the first beam was reflected to the detector D1, while another beam was transmitted to the detector D2, which were used to measure the nonlinear absorption and refraction coefficients respectively.
The transmittance of the Z-Scan experimental medium can be expressed by Eq.2 and Eq.3, thus the nonlinear absorption coefficient and the nonlinear refraction coefficient can be calculated [ 11] .
$$T(Z) = 1 - \frac{{{q_0}(z,0)}}{{{2^{{3 / 2}}}}} = 1 - \frac{{\beta {I_0}{L_{\rm eff}}}}{{\sqrt 8 (1 + {{{Z^2}} / {Z_0^2)}}}}$$ (2) $$T({\textit{z}},\Delta \varphi ) = 1 + \frac{{4x\Delta \varphi }}{{({x^2} + 1)({x^2} + 9)}}$$ (3) Where, I 0 is the maximum light intensity at the laser focus, E is the laser single pulse energy, ω 0 is the radius of the laser beam waist at the focal point, τ is the pulse width,
${Z_0} = {\pi} {{\omega _0^2} /\lambda }$ is the diffraction length of Rayleigh diffraction, Z is the laser incident depth, β is the nonlinear absorption coefficient,${L_{\rm eff}} = {{(1 - {T_0}) \cdot l} /{( - \ln {T_0})}}$ is the effective length of sample, T 0 is the linear transmittance of solution, l is the sample pool thickness.When the peak and valley asymmetry occurs, the Eq.4 [ 12] can be used for theoretical fitting.
$$T = 1 + 2\Delta \varphi \left[ {\frac{{2x}}{{(1 + {x^2})(9 + {x^2})}}} \right] - 2\Delta \varphi \left[ {\frac{{3 + {x^2}}}{{(1 + {x^2})(9 + {x^2})}}} \right]$$ (4) The nonlinear susceptibility is divided into the real and the imaginary part, which respectively represent the nonlinear refraction and the nonlinear absorption characteristics. According to the Eq.5 to 7, the third-order nonlinear susceptibility ( χ (3)) can be calculated.
$${\chi ^{(3)}} = \chi _R^{(3)} + i\chi _i^{(3)}$$ (5) $${\rm{Re}} {\chi ^{(3)}}({\rm esu}) = \frac{{cn_0^2}}{{720{\pi ^2}}} \cdot \gamma $$ (6) $${\rm{Im}} {\chi ^{(3)}}({\rm esu}) = \frac{{n_0^2{\varepsilon _0}c\lambda }}{{2\pi }} \cdot \beta \cdot \frac{9}{{4\pi }} \times {10^8}$$ (7) -
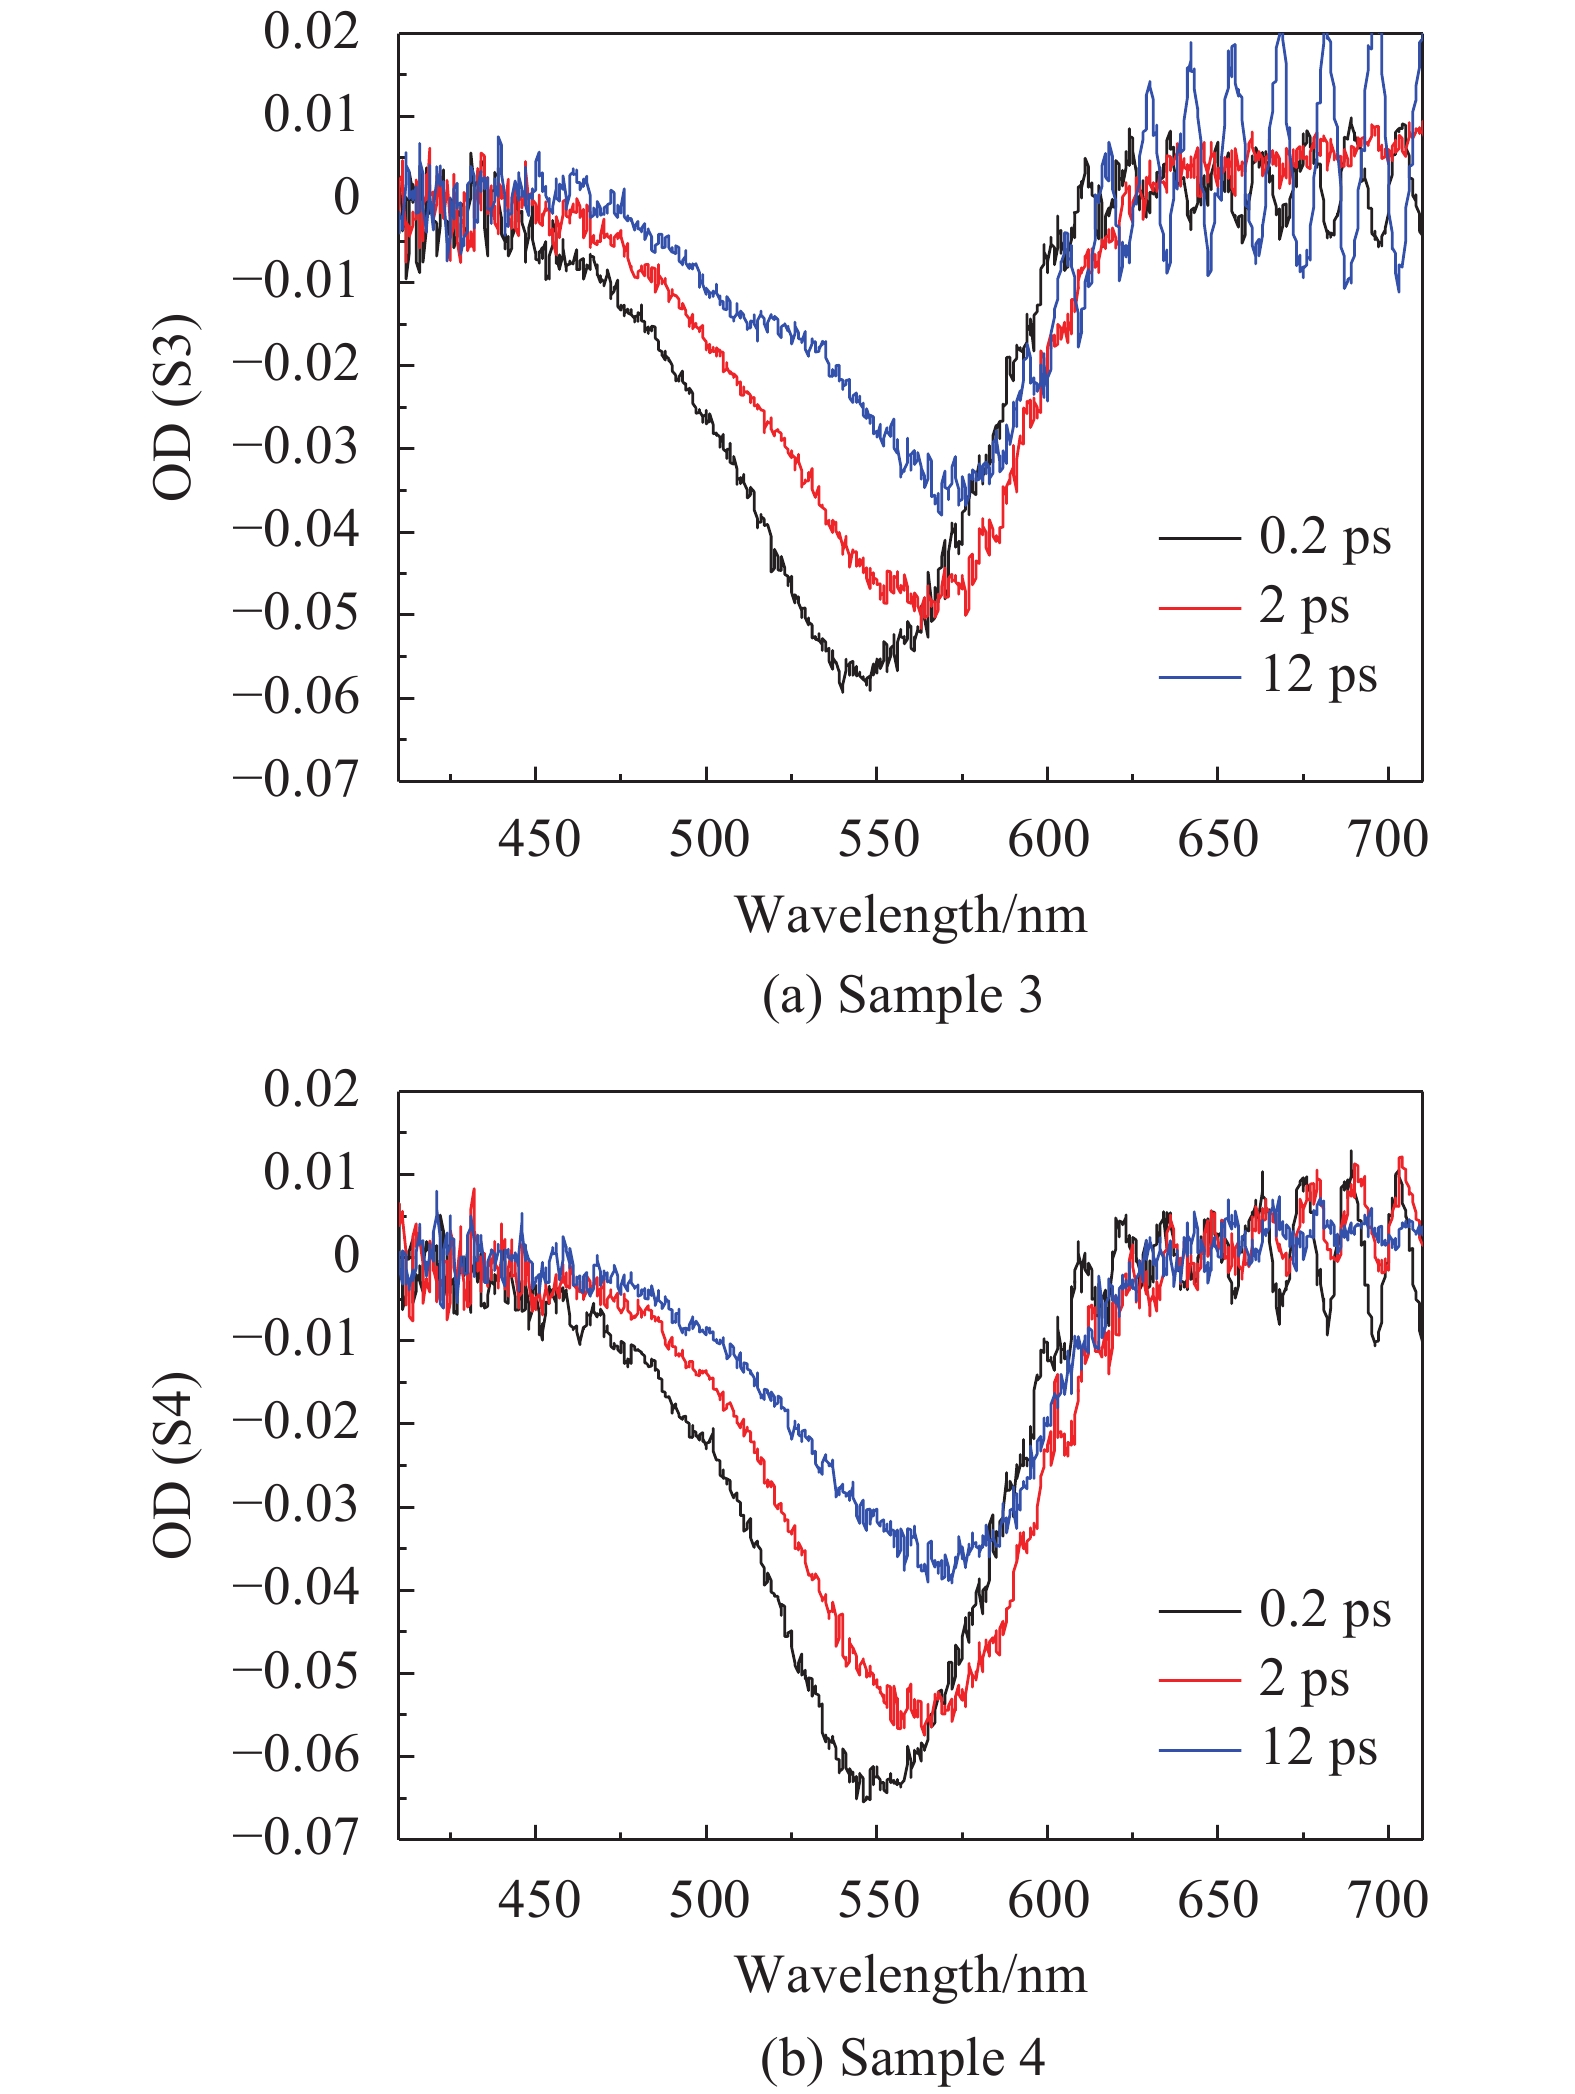
For the purpose of appraising the ultrafast dynamics characteristics of CdTe/CdS quantum dots with different sizes of core and shell, the the ultrafast dynamics process was investigated through femtosecond time-resolved transient absorption spectra technique. The experimental device have been described previously in the Ref.[ 13]. The laser pulse generated by Ti: sapphire regenerative amplifer with the repetition of 1 kHz (Coherent INC, USA) was set to be 130 fs pulse width, and the single-pulse energy was 5 nJ. The sample pool thickness was 2 mm and the central wavelength was 400 nm for this equipment. The fundamental laser beam was split into two and one of them was used as pump beam to excite the sample. The other beam was used as a probe beam to detect the particle distribution of the excited state sample. In Eq.8, the abscissa is the detection wavelength, and the ordinate is the variation of absorbance, which select the delay time of 0.2 ps, 2 ps, and 12 ps for the experimental data, respectively.
$$ \Delta A = \lg {I_{\rm probe}} - \lg {I_{\rm pump - probe}} $$ (8) Where Δ A is the variation of absorbance, I probe is the intensity of probe beam passing through the sample without pump beam, I pump-probe is the intensity of probe beam passing through the sample with the pump beam excitation.
The signal-to-noise ratio (SNR) is greatly improved through the chopper to remove background noise by cutting a half of the pulses. The final signal data can be expressed by Eq.9.
$$ \Delta A = \lg \left( {{I_{\rm probe}} - {I_{\rm noise}}} \right) - \lg \left( {{I_{\rm pump - probe}} - {I_{\rm noise - pump}}} \right) $$ (9) Where I noise is a noise signal that blocks both the pump and the probe beam, while
I noise -pump is a noise signal that blocks only the probe beam. -
Selecting the CdTe/CdS sample S1-S6, of which the core color of the CdTe was orange, yellow and green, and the core size of different colors was different. The cladding time were 30 mins and 1 h respectively, which was to differ the thickness of the shell. With the increase of the cladding time, the thickness increases gradually. The linear transmittance was 95% and the monopulse energy was 400 nJ.
The Z-Scan experimental data of S1 to S6 were shown in Figs.2 to 4 through open aperture and closed aperture Z-Scan measurements. From the experimental data of S1 and S2, it observed that the open aperture Z-Scan experimental plot showed all shaped like valleys, indicated that the nonlinear absorption was the reverse saturation absorption and the nonlinear absorption coefficient was positive. Correspondingly, a valley followed by a peak in closed aperture Z-Scan experimental trace was the mark for the positive nonlinear refraction of the sample which is an indication of self-focusing effect. By fitting the experimental data, the nonlinear absorption coefficient, the nonlinear refraction coefficient and the third-order nonlinear susceptibility can be obtained. The results showed that the nonlinear absorption of the samples was reverse saturation absorption and accompanied by two-photon absorption.
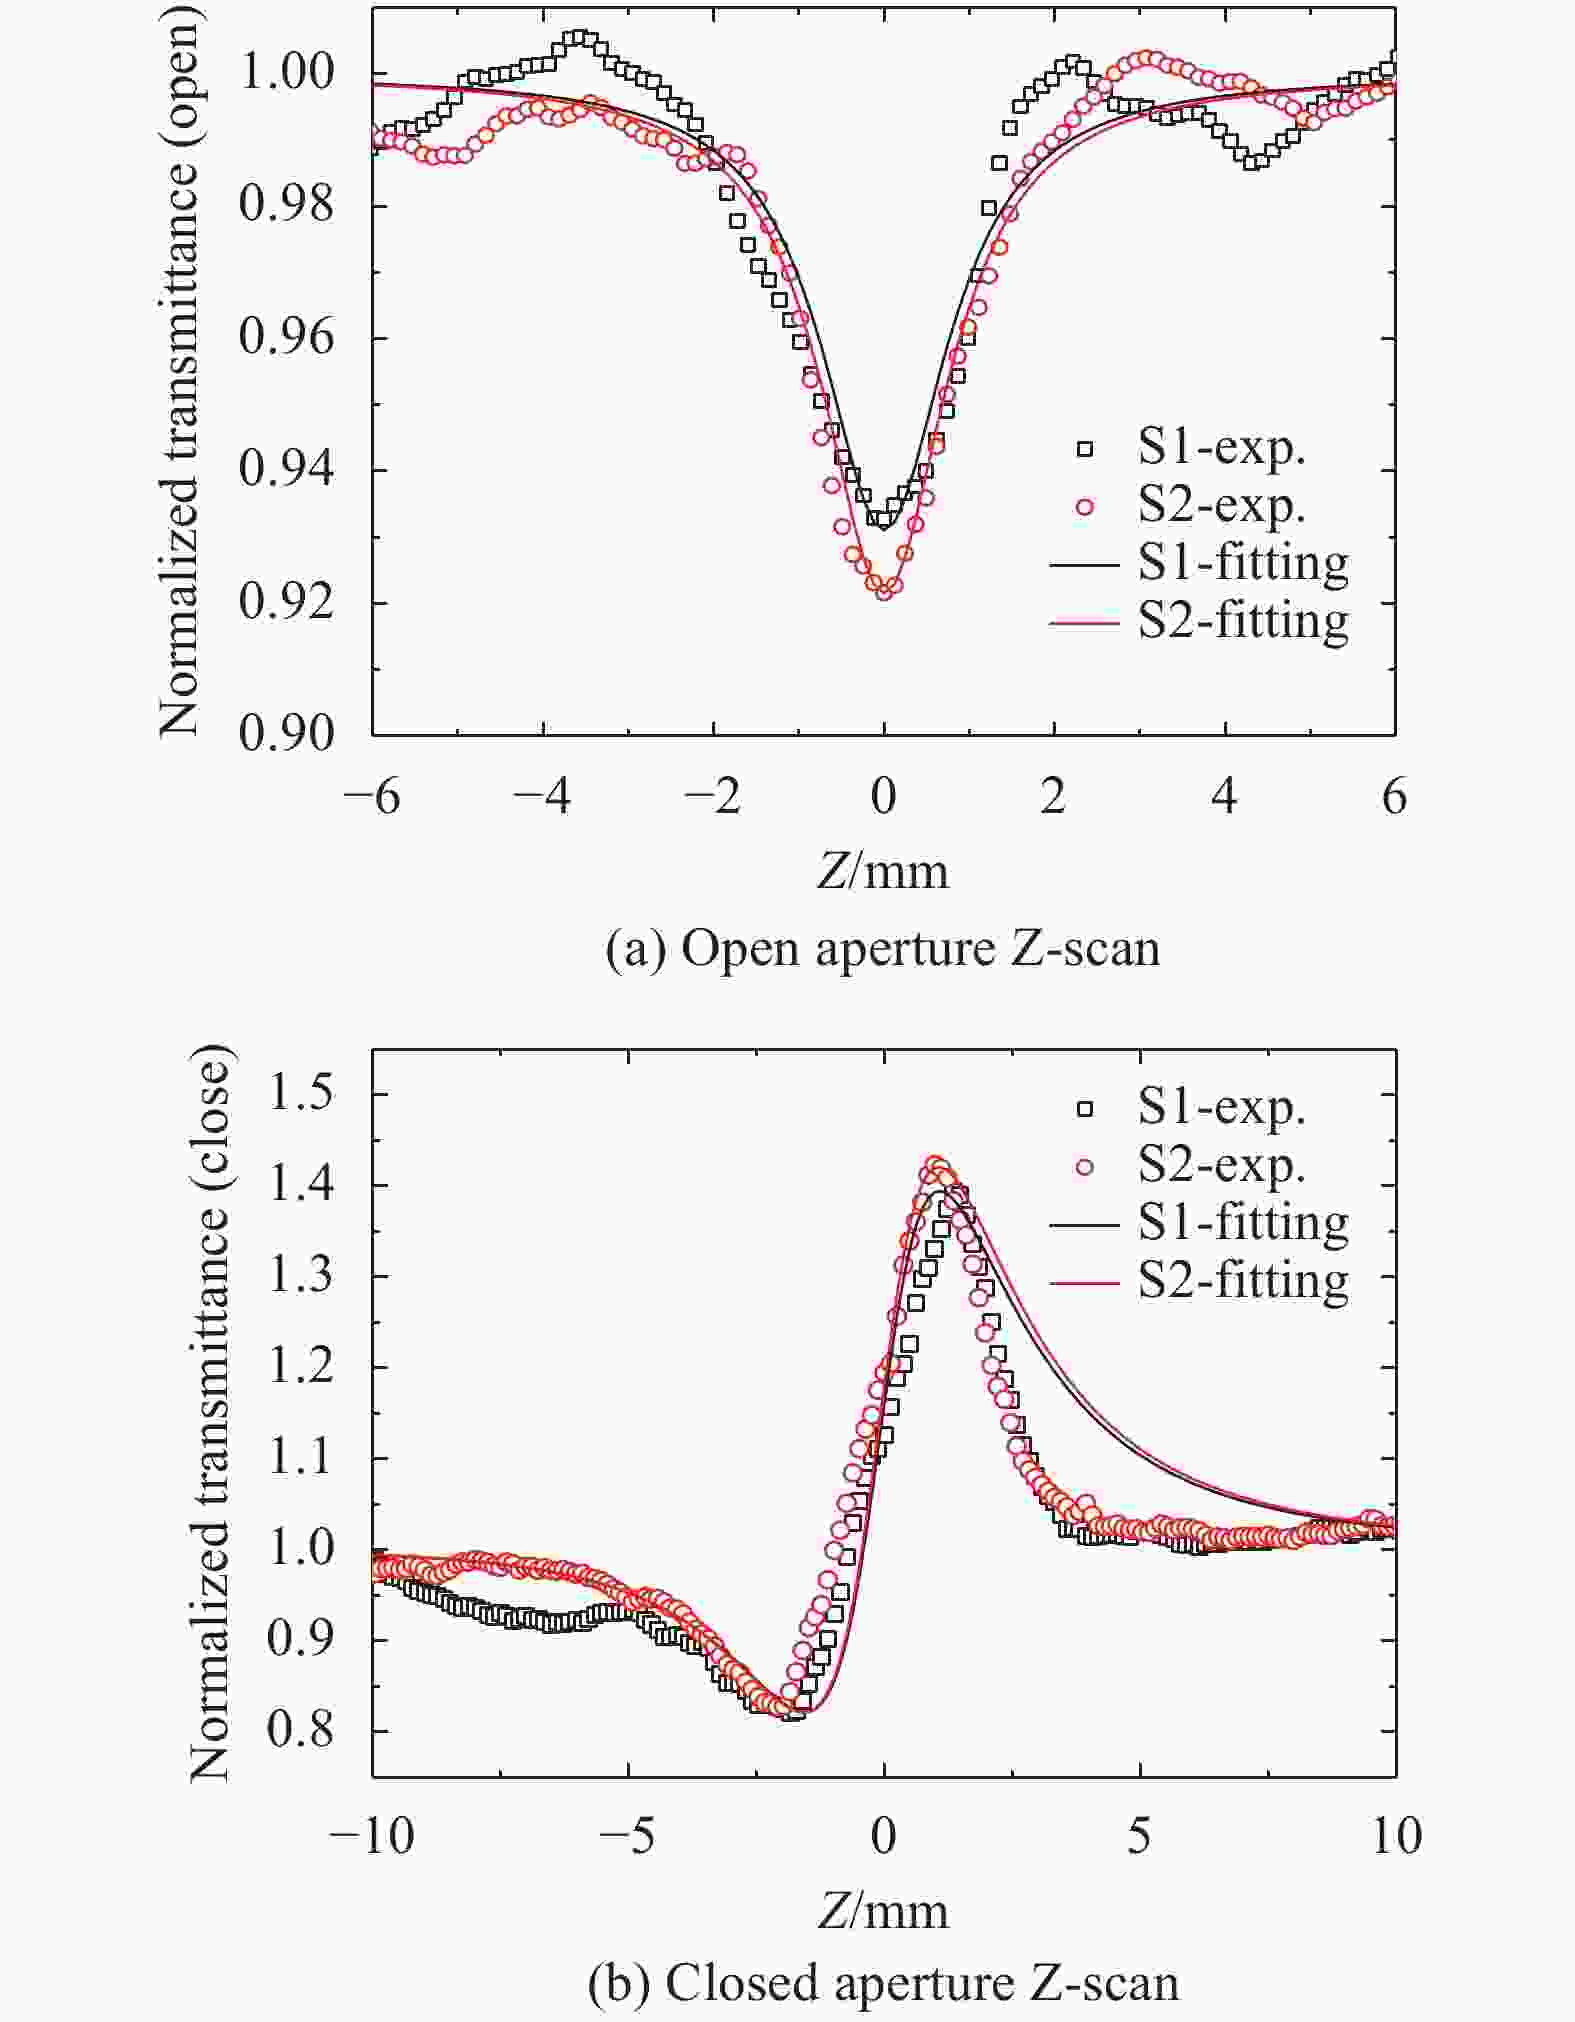
Figure 2. Open/closed aperture Z-scan normalized transmittance curves of water-soluble CdTe/CdS, S1-S2 quantum dots

Figure 4. Open/closed aperture Z-scan normalized transmittance curves of water-soluble CdTe/CdS, S5-S6 quantum dots

Figure 3. Open/closed aperture Z-scan normalized transmittance curves of water-soluble CdTe/CdS, S3-S4 quantum dots
Since the sample was the water-soluble quantum dots, the linear refractive index of the sample can be replaced by solution with a value of 1.33. The data calculated by fitting were shown in Tab.2.
Table 2. Nonlinear optical parameters obtained from Z-scan measurement data for CdTe/CdS quantum dots
Sample name Core color Shell Size/nm β/10 -13 m·W -1 n 2/10 −12esu χ 3/10 −14esu S1 Orange CdS-30 min 3.2 4.39 1.42 3.85 S2 Orange CdS-1 h 3.3 5.01 1.49 4.12 S3 Yellow CdS-30 min 3.0 5.07 1.38 3.90 S4 Yellow CdS-1 h 3.1 5.29 1.85 4.92 S5 Green CdS-30 min 2.6 5.23 1.18 3.58 S6 Green CdS-1 h 2.7 6.42 1.73 4.92 It is obvious that the core size of green is the smallest compared with the other color for the same of cladding material and time in the Tab.2. That is because of that the luminescence produced redshift by the increase of the core size under the ultraviolet radiation. As a result, the nonlinear absorption in the same shell thicknesses, such as the sample of S1, S3, and S5, stronger with the smaller of core size. It is obvious that the influence of the core size on the nonlinear refraction coefficient is irregular, so that the core size of CdTe/CdS core-shell quantum dots mainly affect the nonlinear absorption characteristics. The size of particles increases with the cladding time, such as S1 and S2 samples, which the cladding time were 30 min and 1 h respectively, as given in Tab.2. This means that the shell thickness has the particular influence on the nonlinear absorption, nonlinear refraction and third-order nonlinear susceptibility.
-
The femtosecond transient absorption spectra of CdTe/CdS quantum dots as shown in Figs.5- 7.
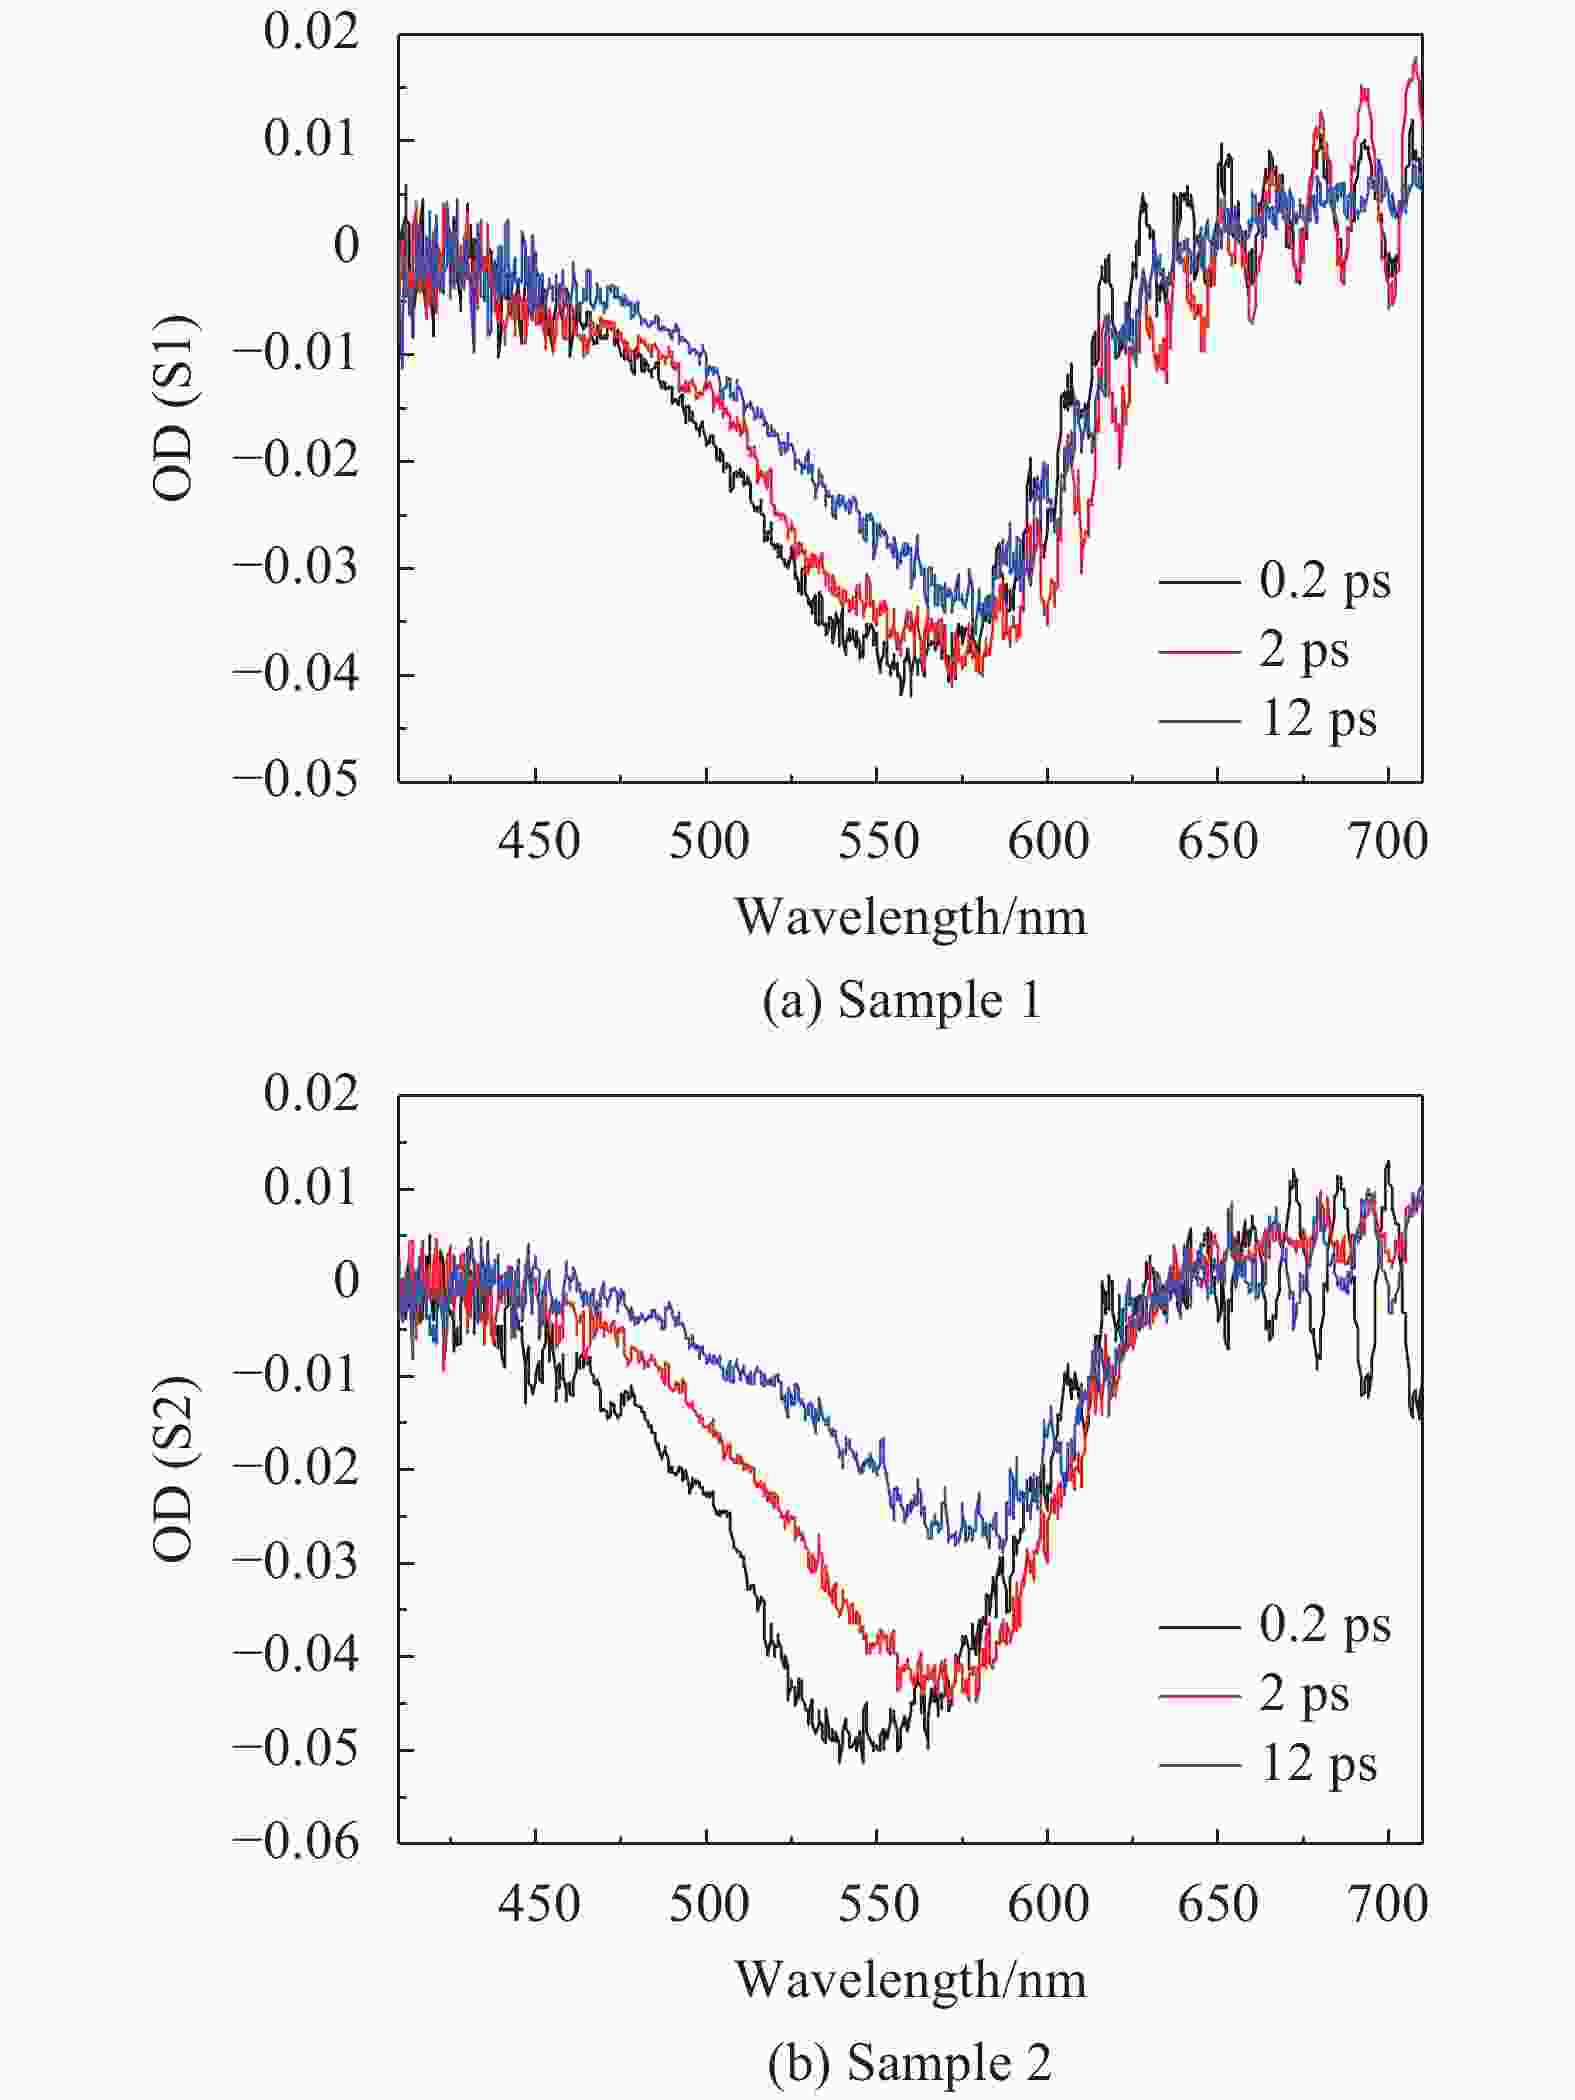
Figure 5. Transient absorption spectra of water-soluble CdTe/ CdS, S1-S2 quantum dots
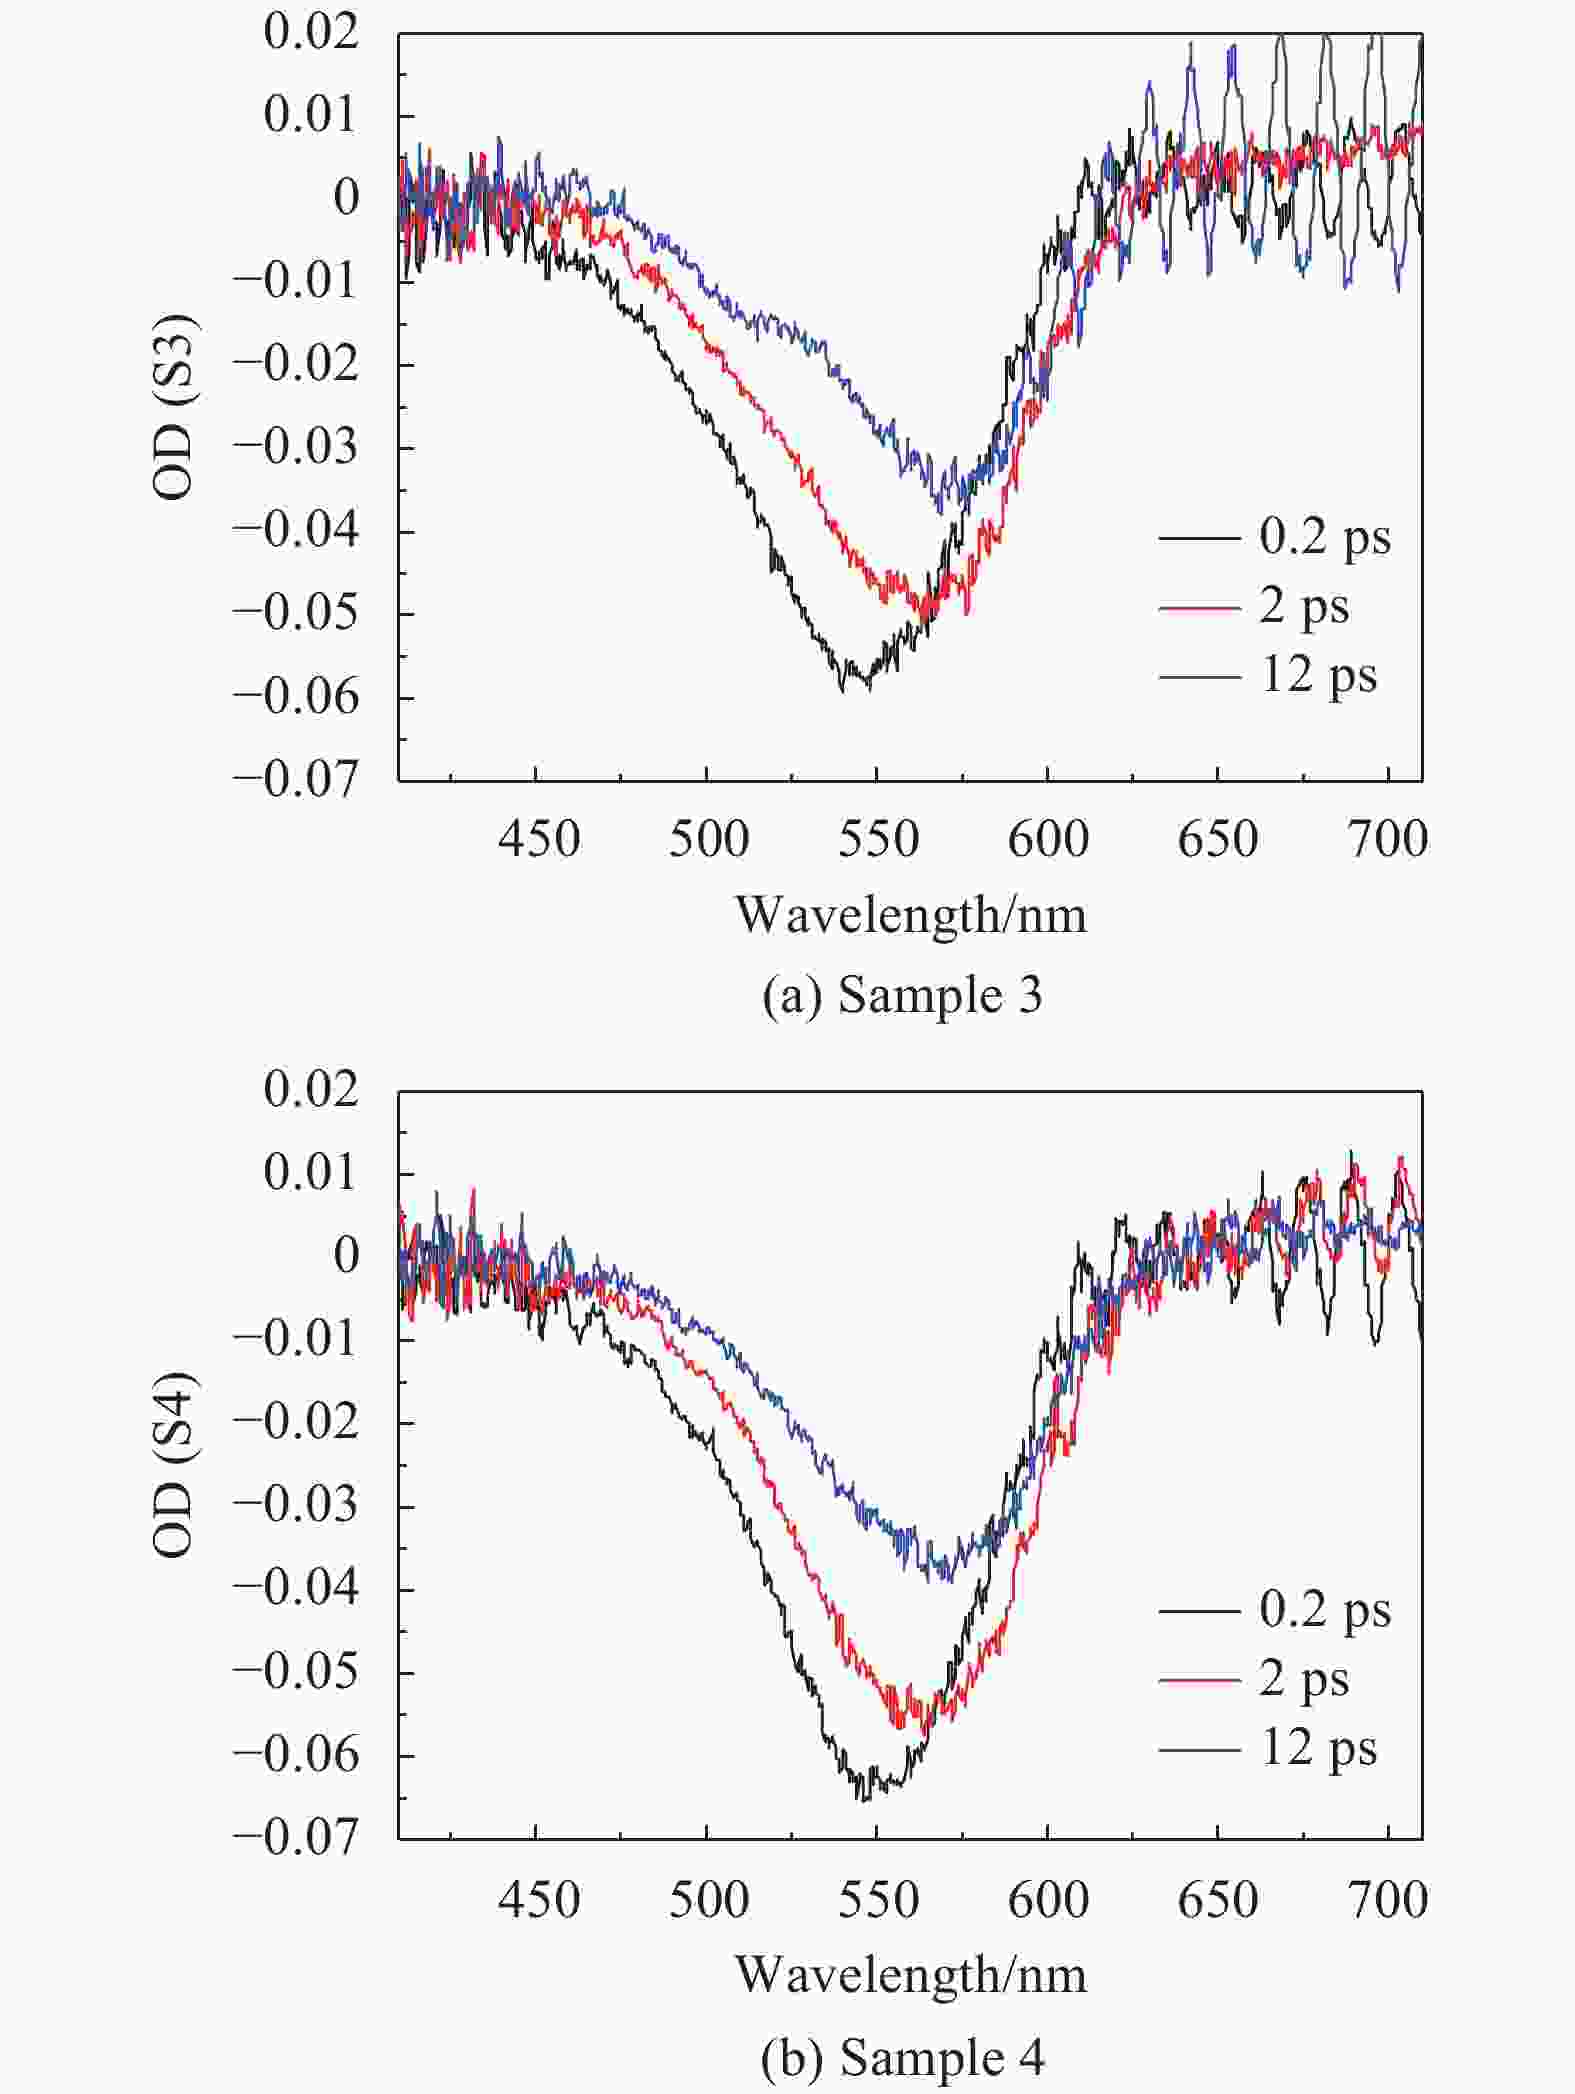
Figure 6. Transient absorption spectra of water-soluble CdTe/ CdS, S3-S4 quantum dots

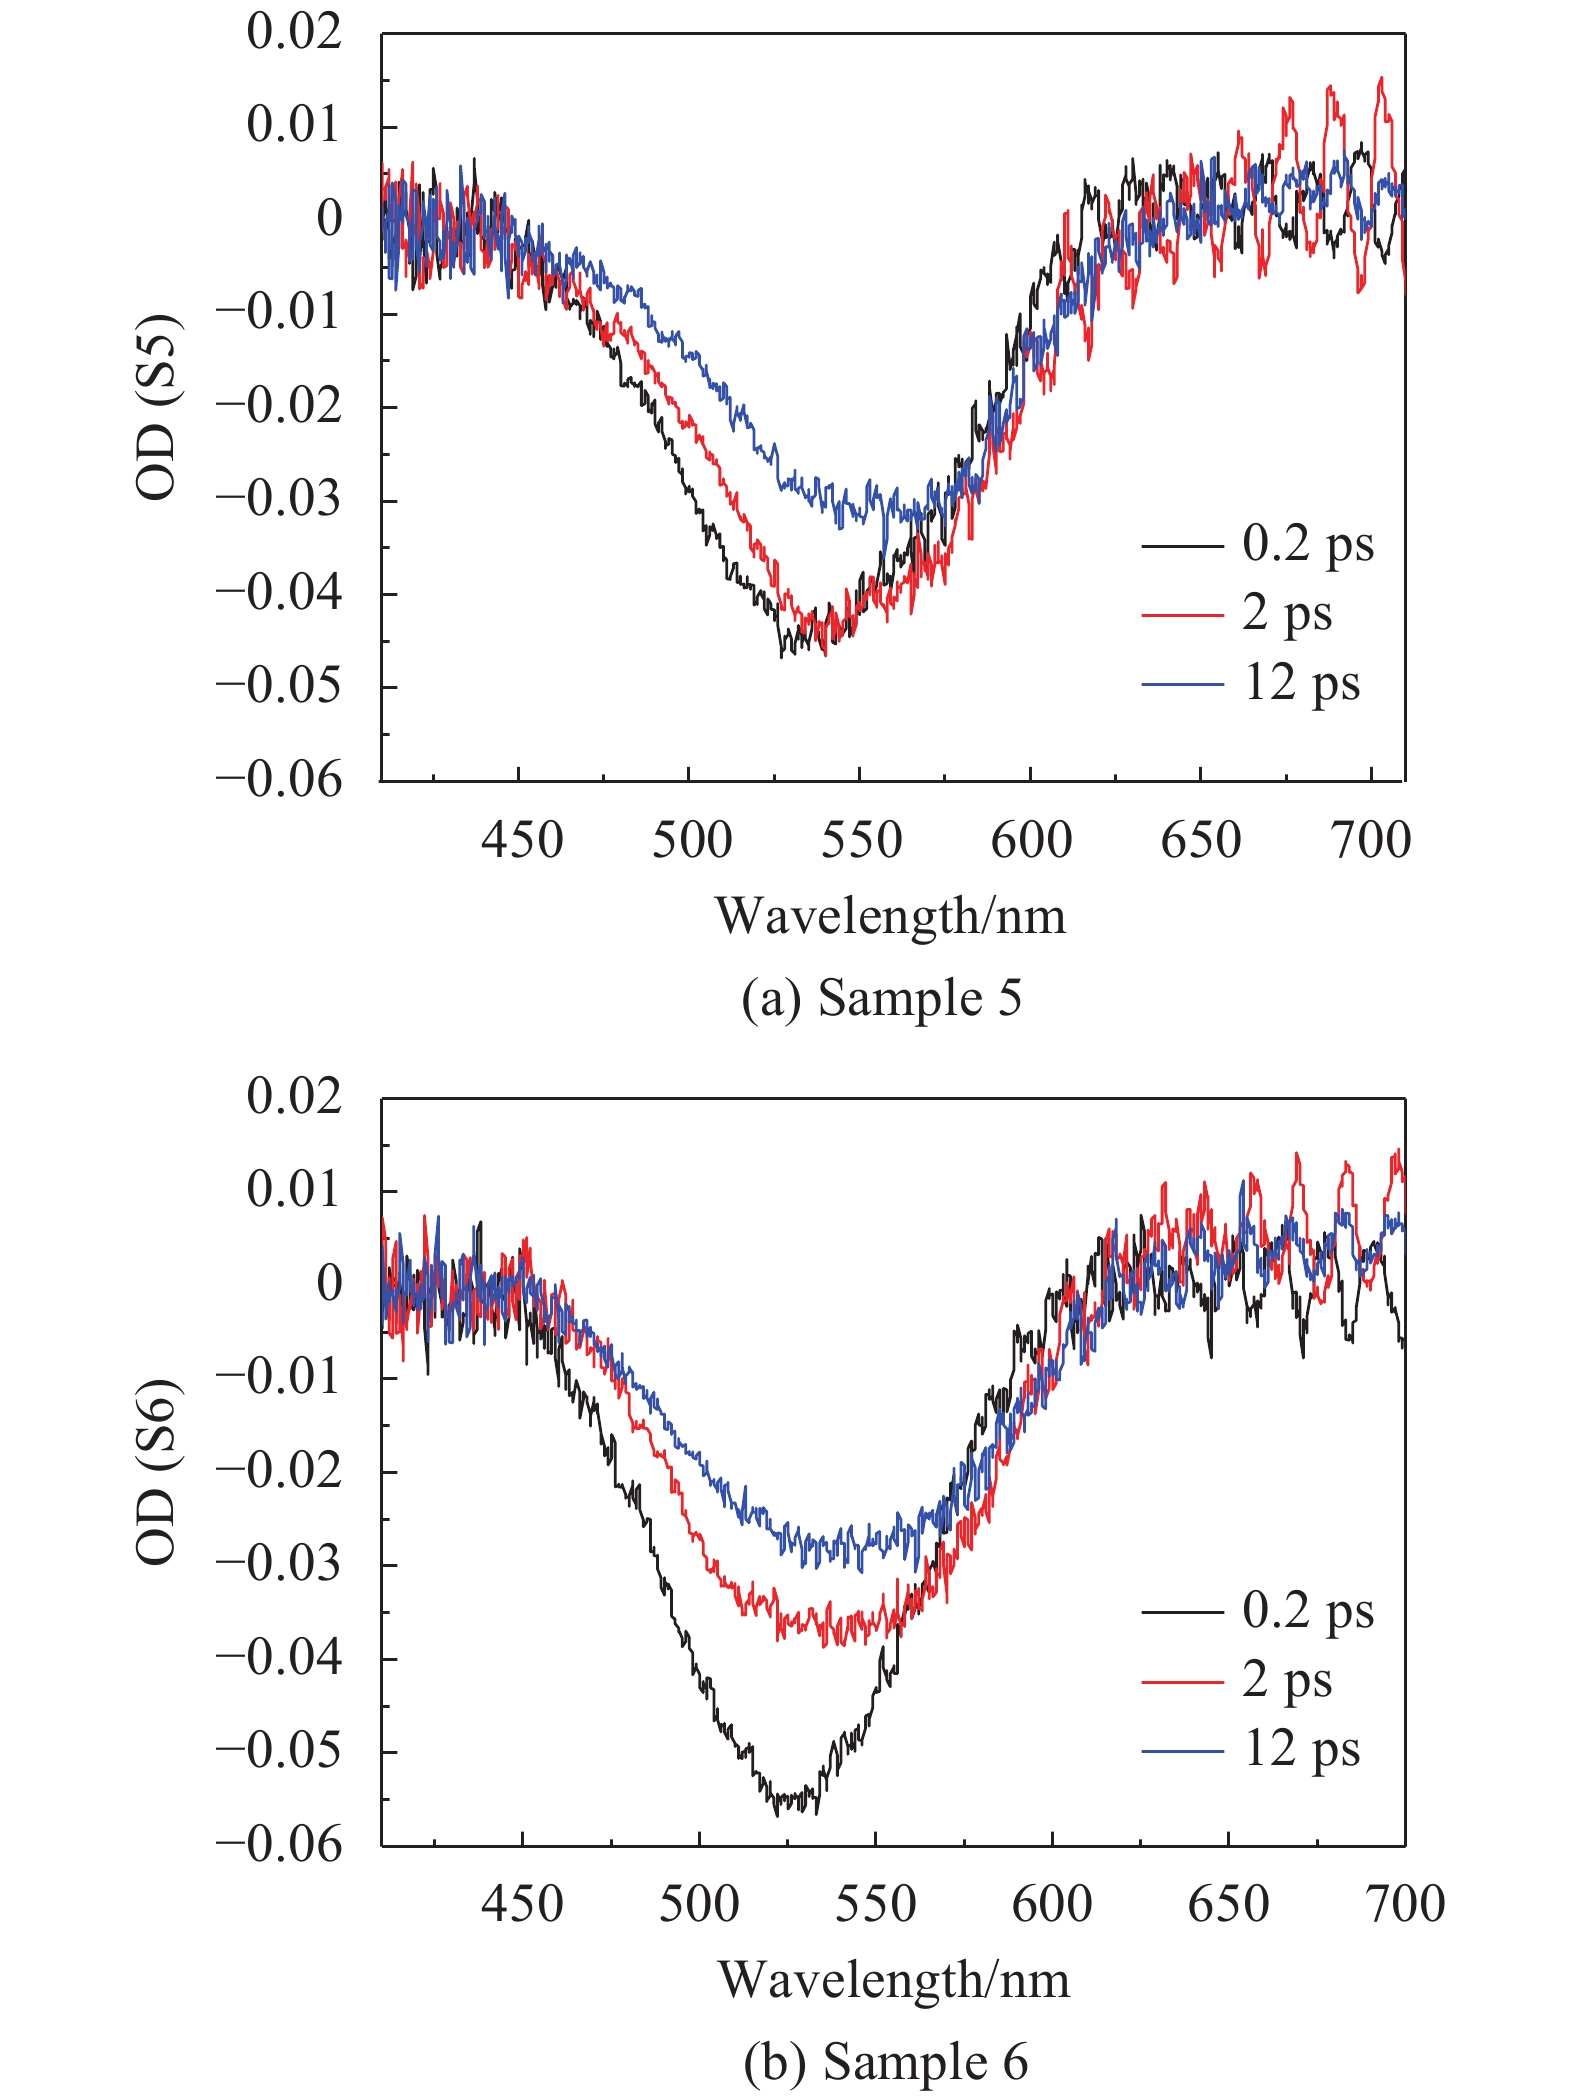
Figure 7. Transient absorption spectra of water-soluble CdTe/ CdS, S5-S6 quantum dots
As shown in Fig.6, a bleaching of ground state was clearly observed in transient absorption spectra. As the delay time increases, the bleaching peaks of S1 to S6 produced the redshift. At the same time, in contrast to the position of the UV-VIS spectrum where also produced the redshift. In Fig.5, there was a short wavelength range of the pump beam induced absorption in the left of the bleaching peak when the delay time is 0.2 ps. And as the delay time increases, absorption band of long wavelength appearing on the right side. Correspondingly, as the size of quantum dots decreases, for example, from S2 to S1, the position of the bleaching peaks appeared blue shift. The femtosecond laser wavelength of 400 nm is large than the band gap of the quantum dot (S1 to S6), which makes the photon of the pump beam energy relatively large. And the part of excess energy is lost by a certain form, which like the heat energy. One can see that the bleaching of ground states are gradually decreased when the delay time changes from 0.2 ps to 2 ps and then to 12 ps. This is a process of the exciton recombination in the quantum dots. The absorption band of the long wavelength on the right side gradually strengthens, indicating the conversion of photon energy into heat energy.
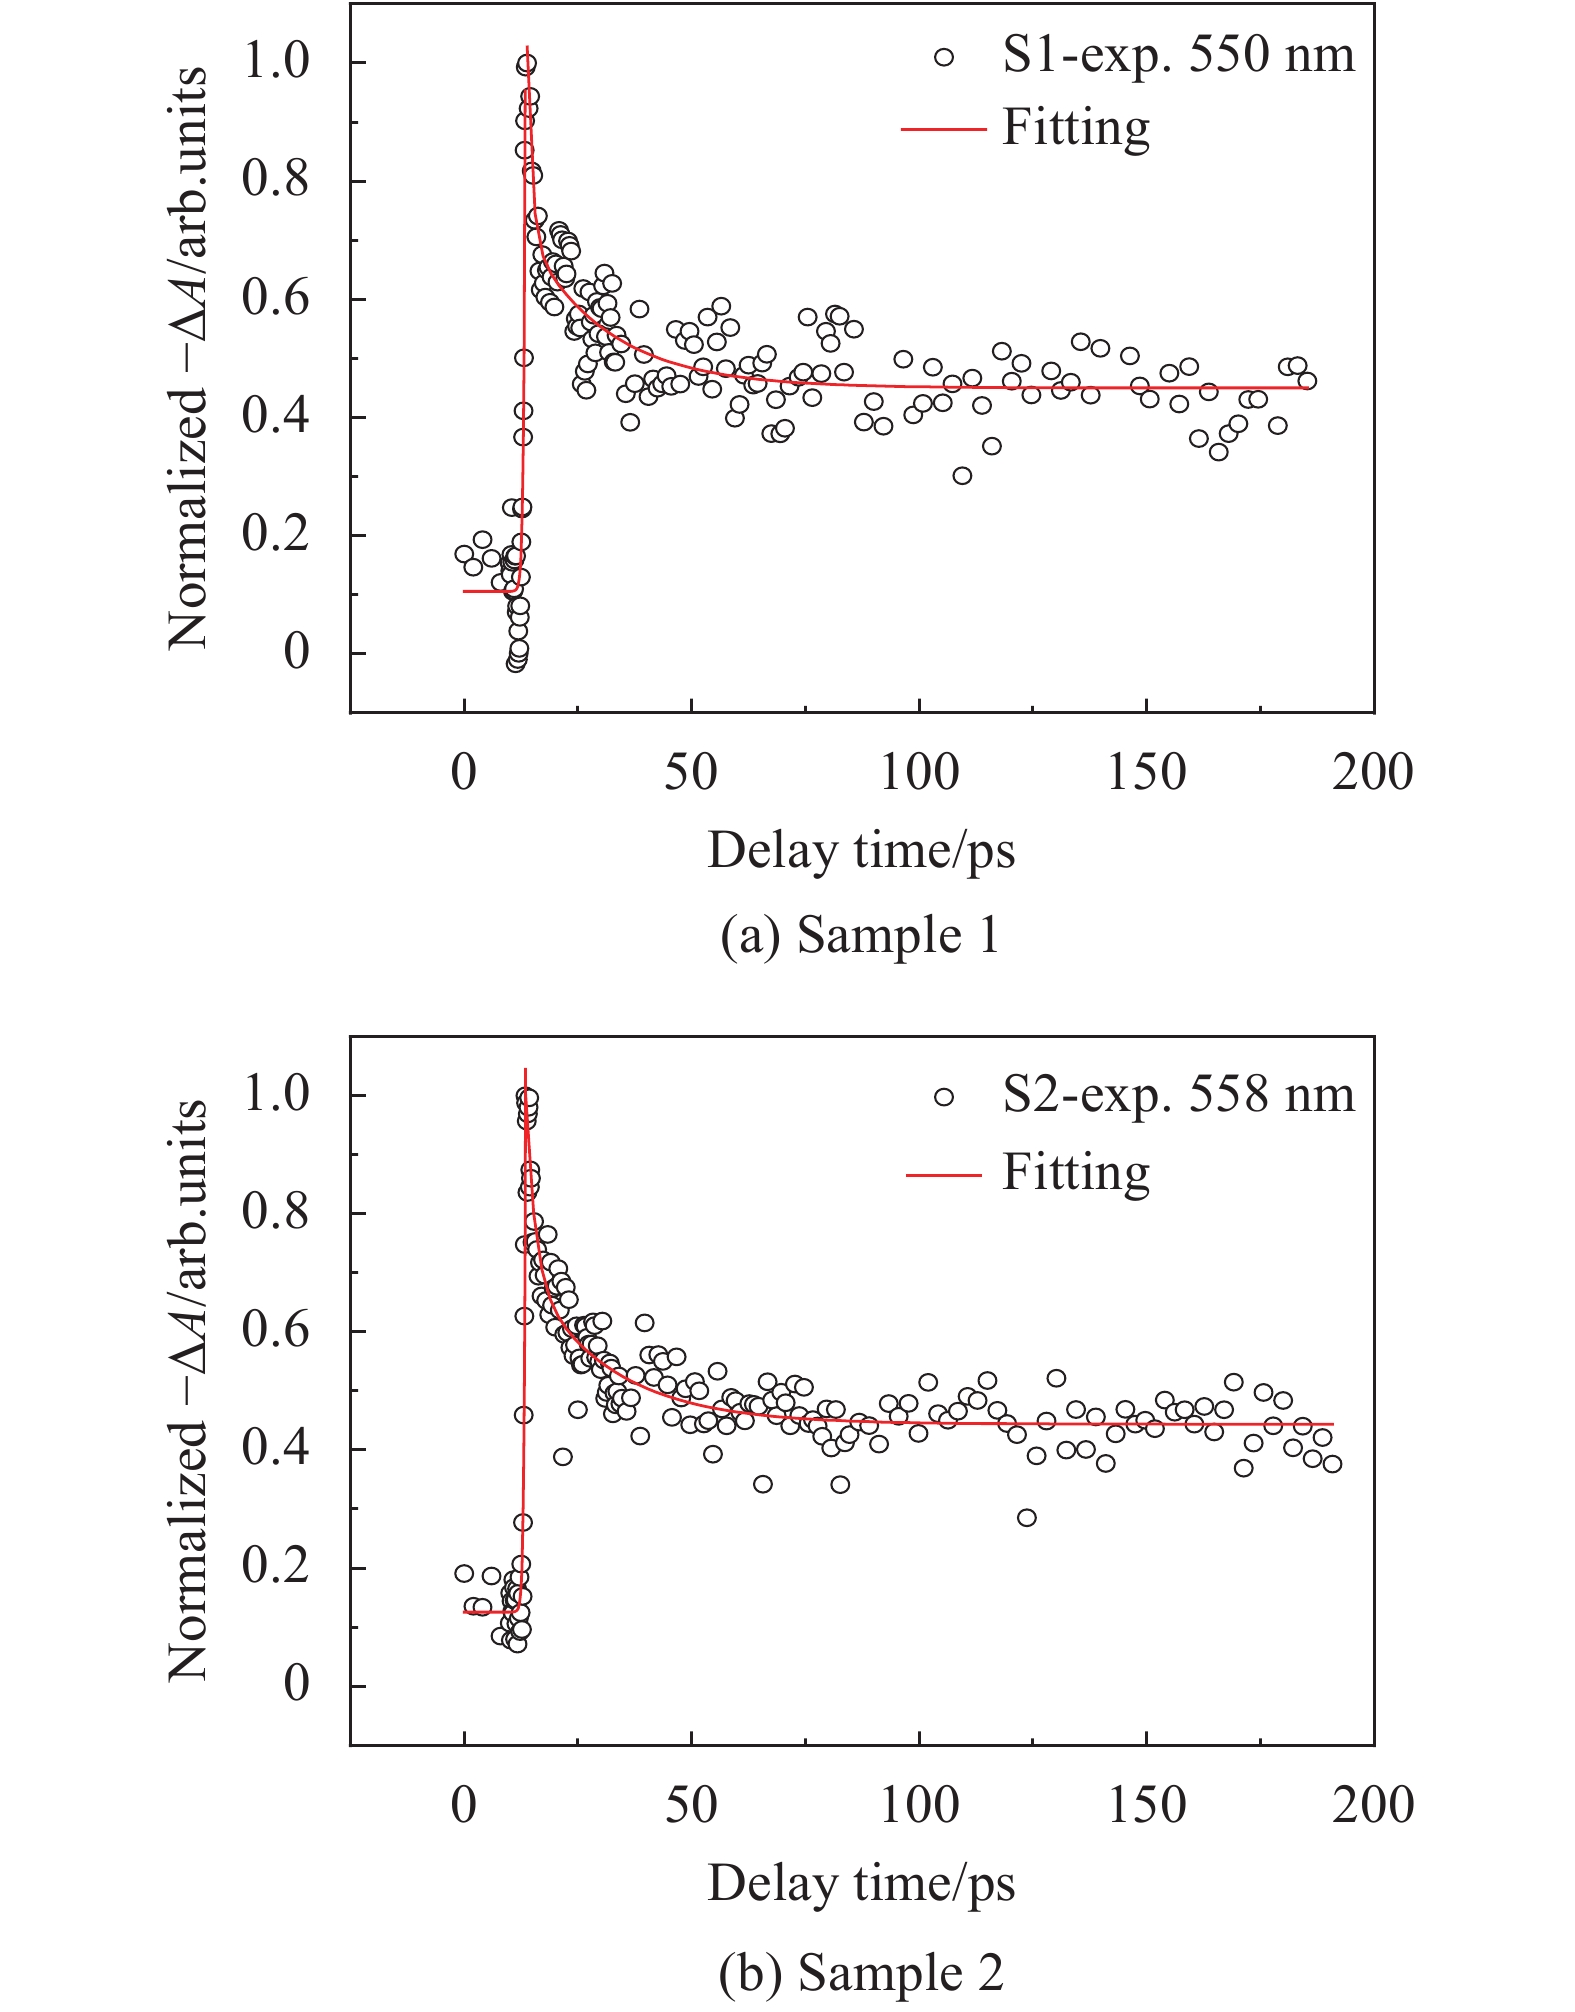
Selecting the absorption peak wavelength to draw the kinetic curves on the basis of the UV-VIS absorption spectra of the sample. The absorption peaks of S1 to S6 are 550 nm, 555 nm, 540 nm, 545 nm, 510 nm and 515 nm, respectively. The abscissa is the delay time, and the ordinate is the variation of the normalization in absorbance, as shown in Fig.8 to 10.
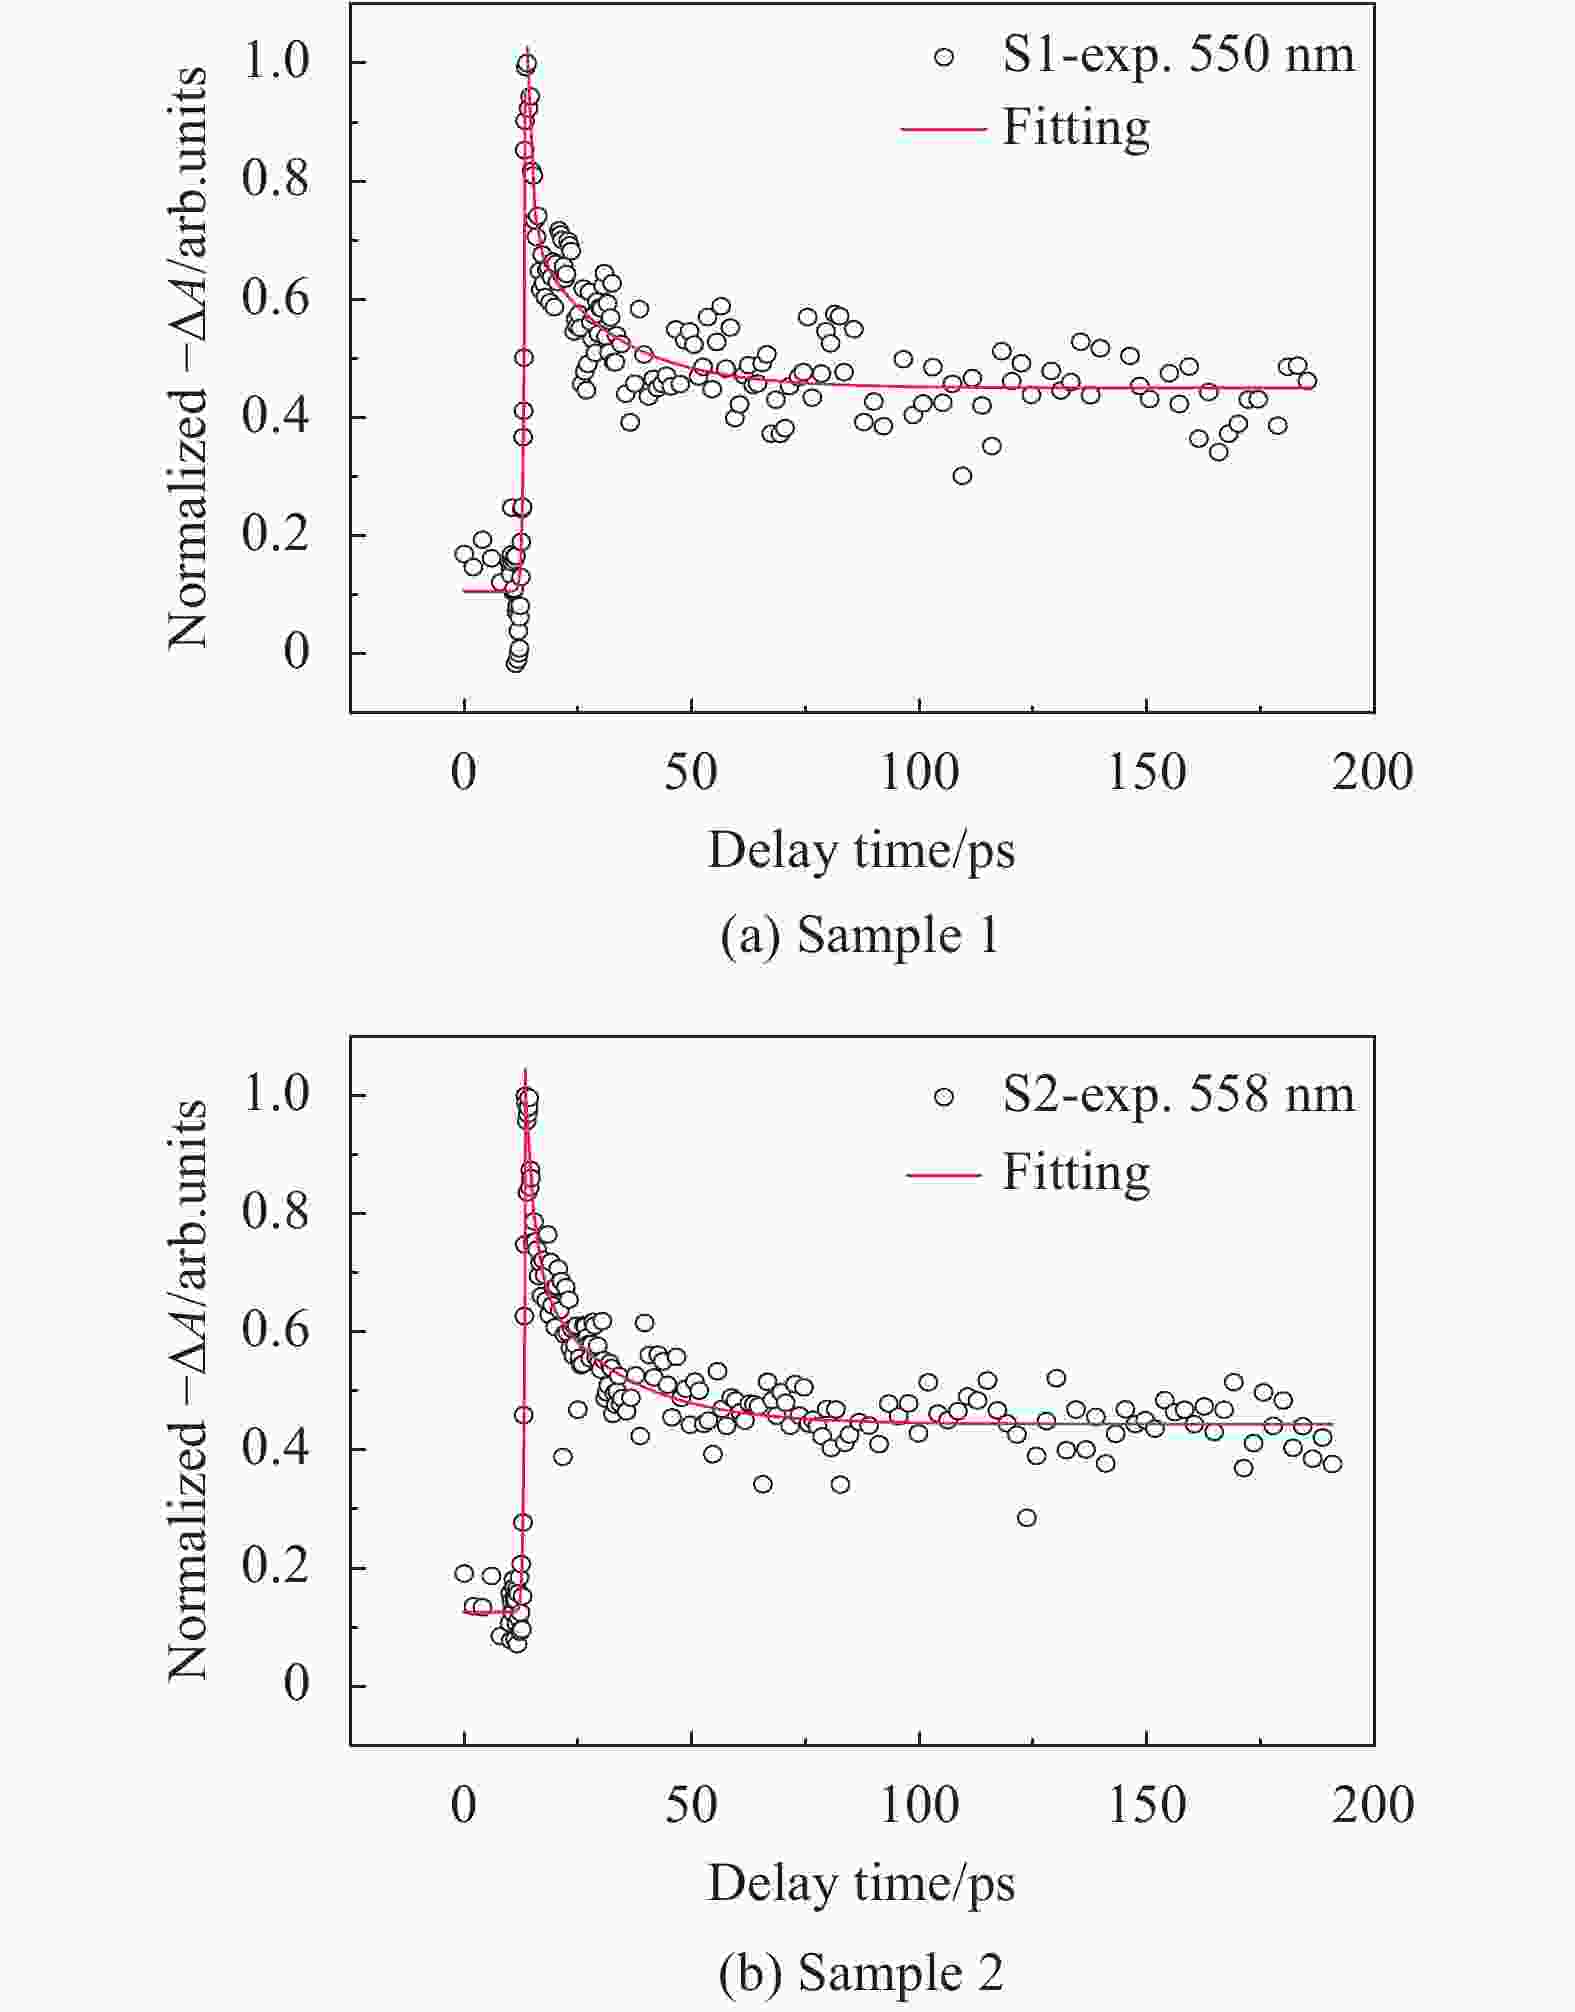
Figure 8. Ultrafast kinetic curves of water-soluble CdTe/CdS, S1-S2 quantum dots
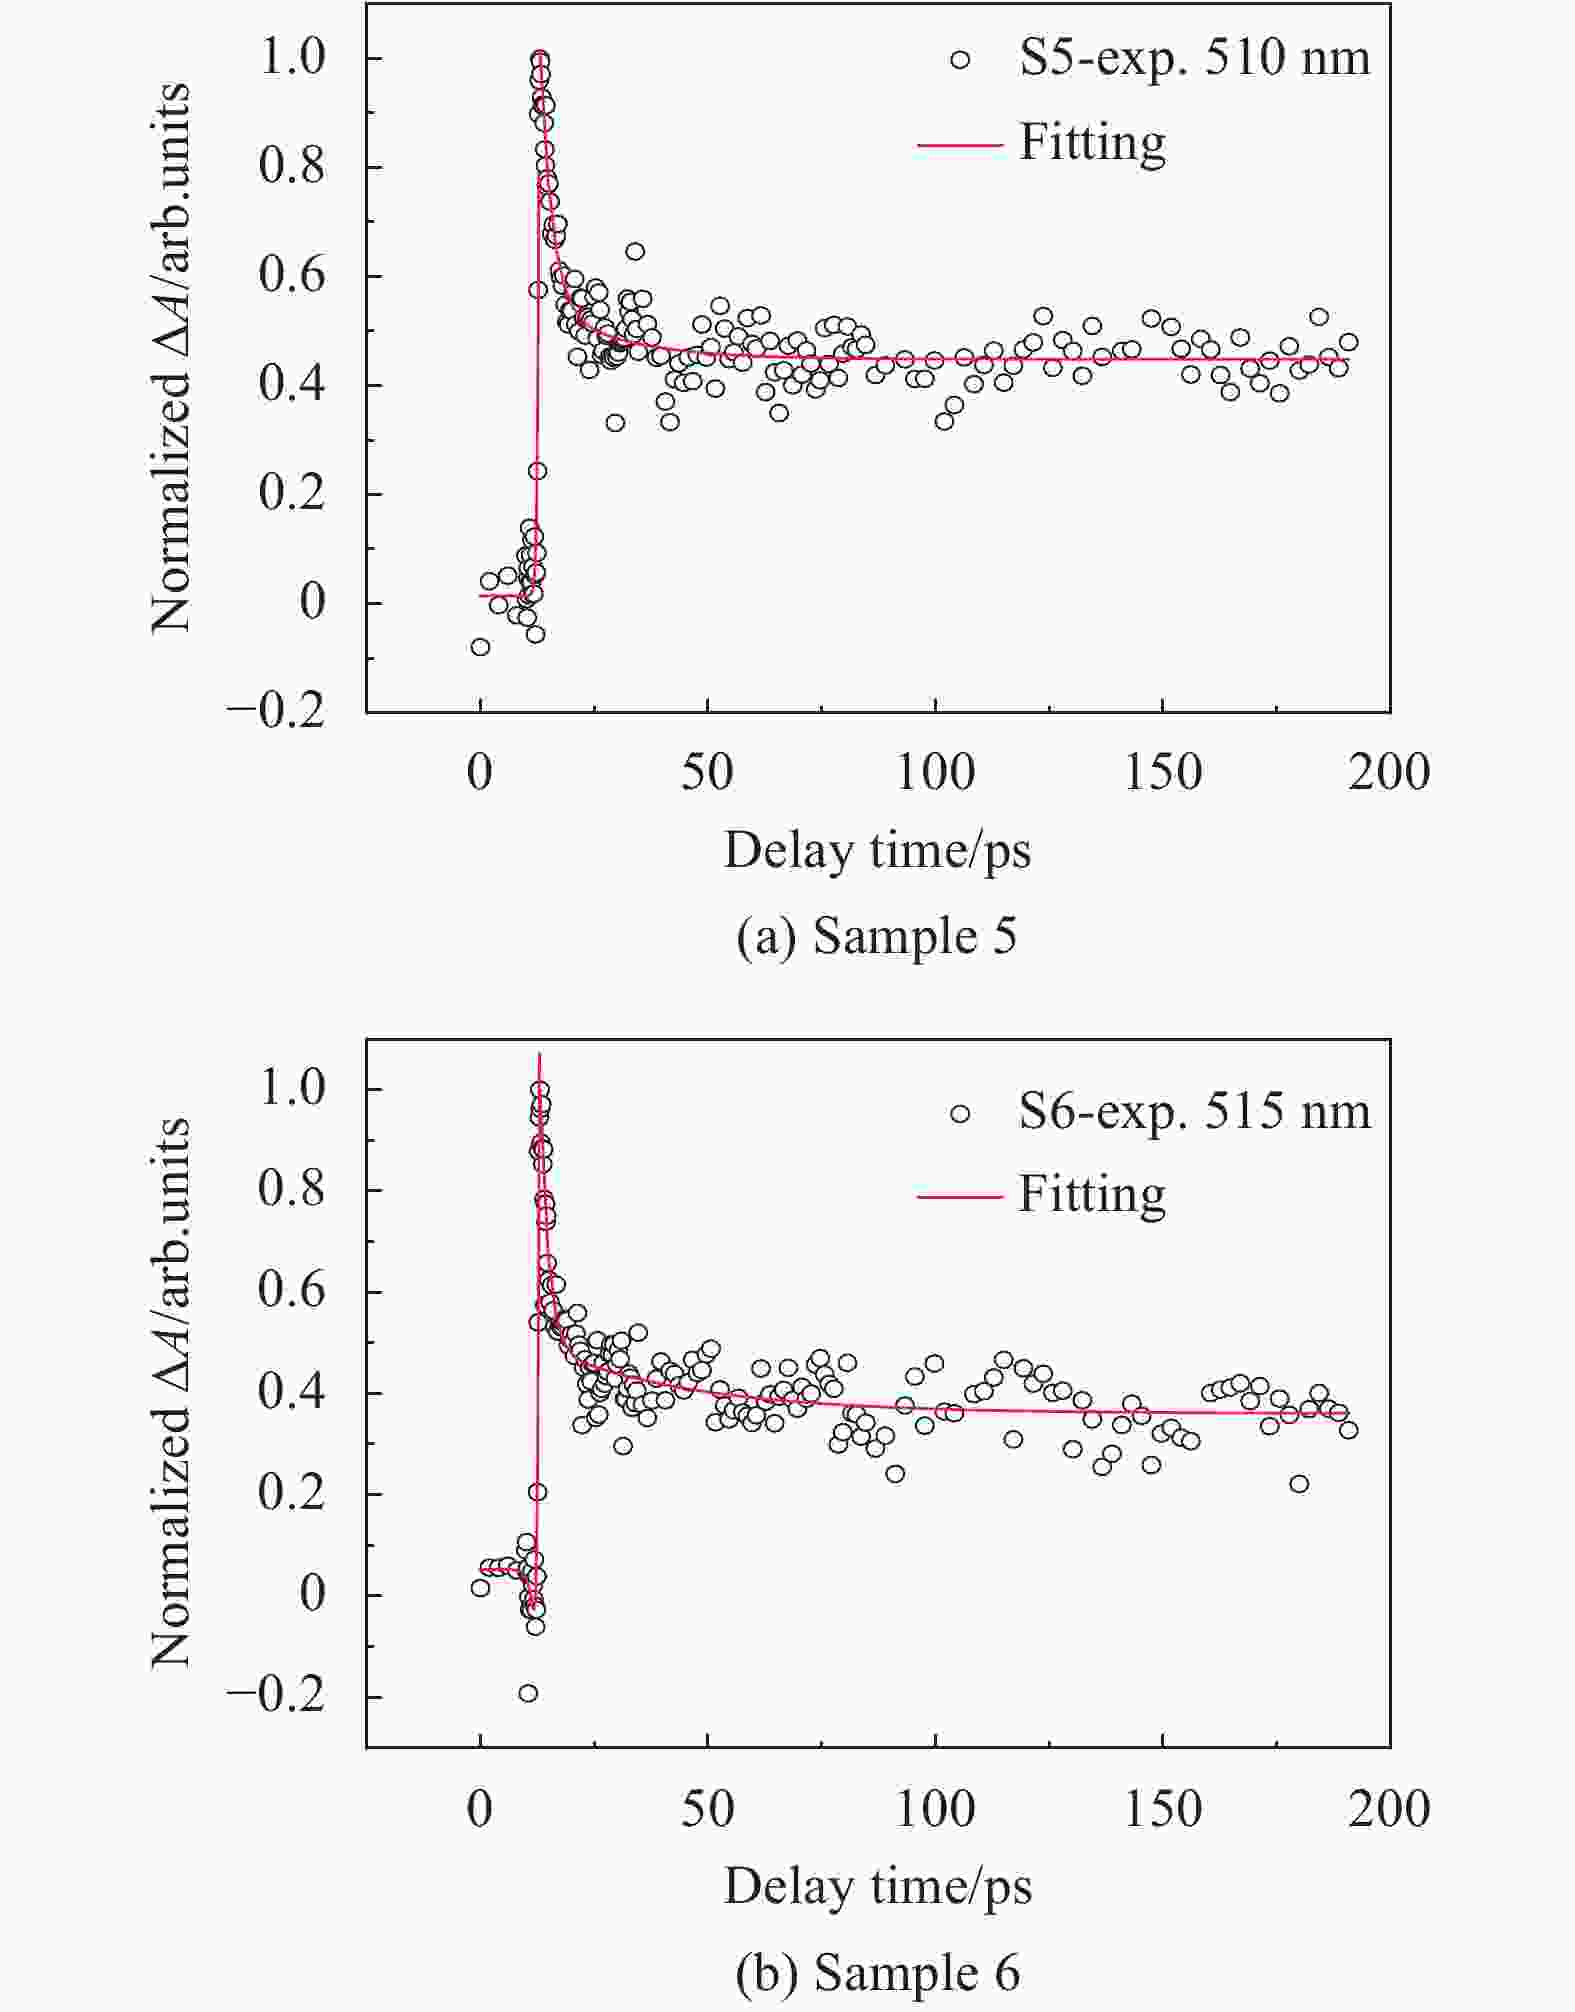
Figure 10. Ultrafast kinetic curves of water-soluble CdTe/CdS, S5-S6 quantum dots
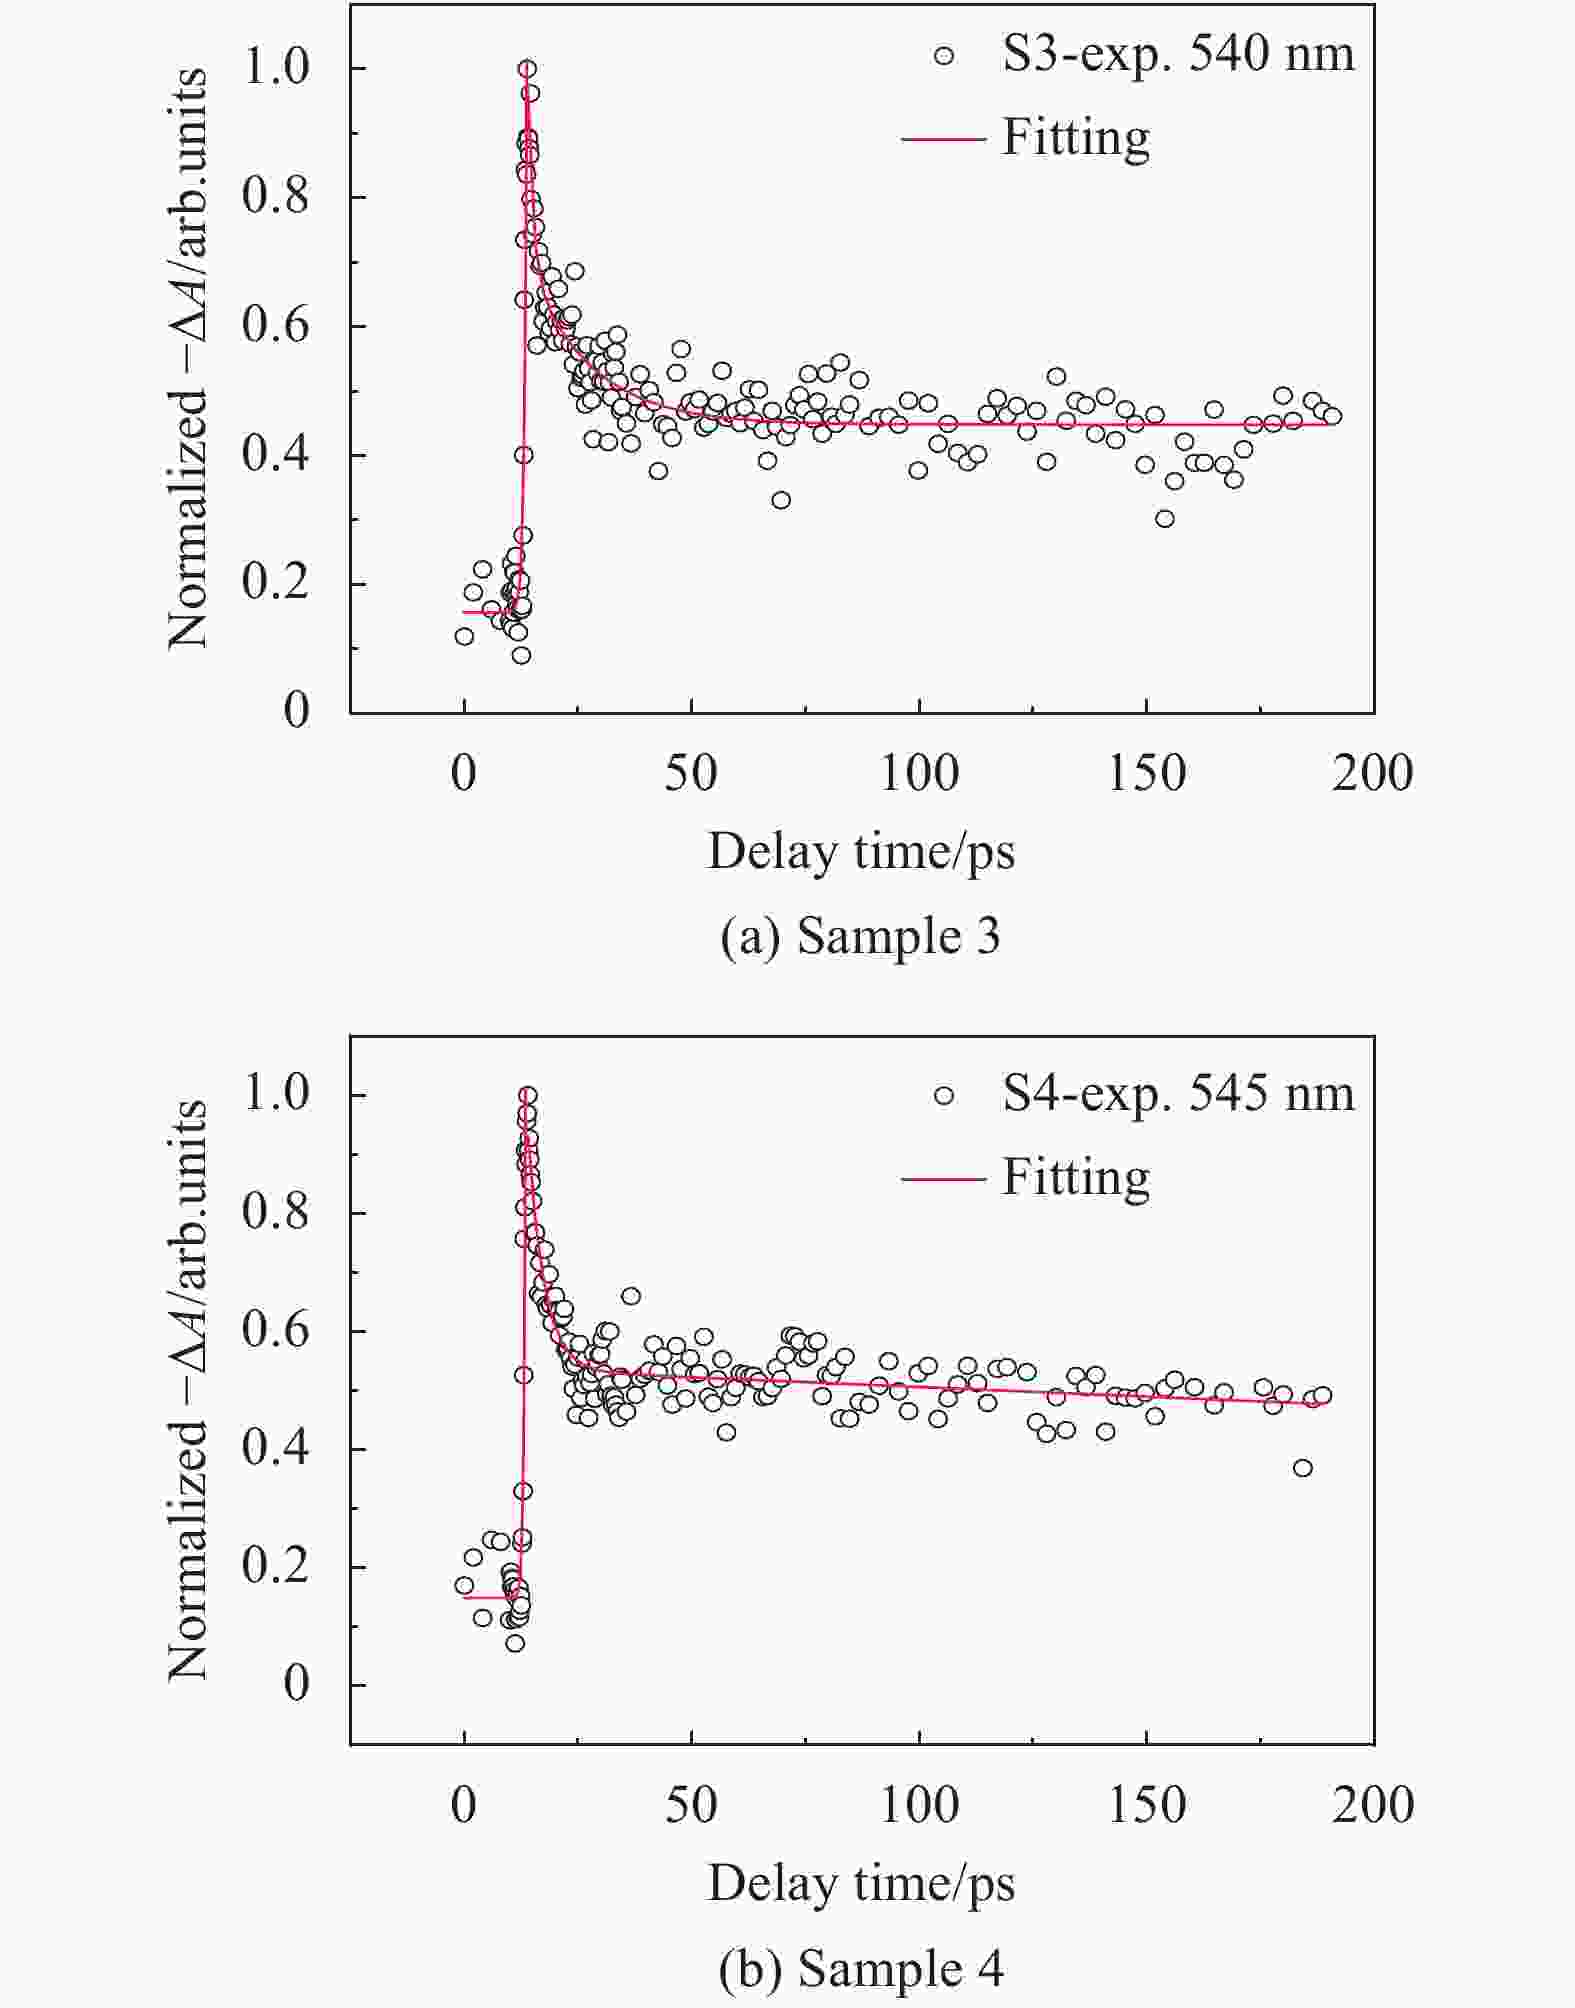
Figure 9. Ultrafast kinetic curves of water-soluble CdTe/CdS, S3-S4 quantum dots
In the Fig.8 to 10 , all the time zeros were 13.3 ps. These ultrafast kinetics curves were fitted by biexponential decay (
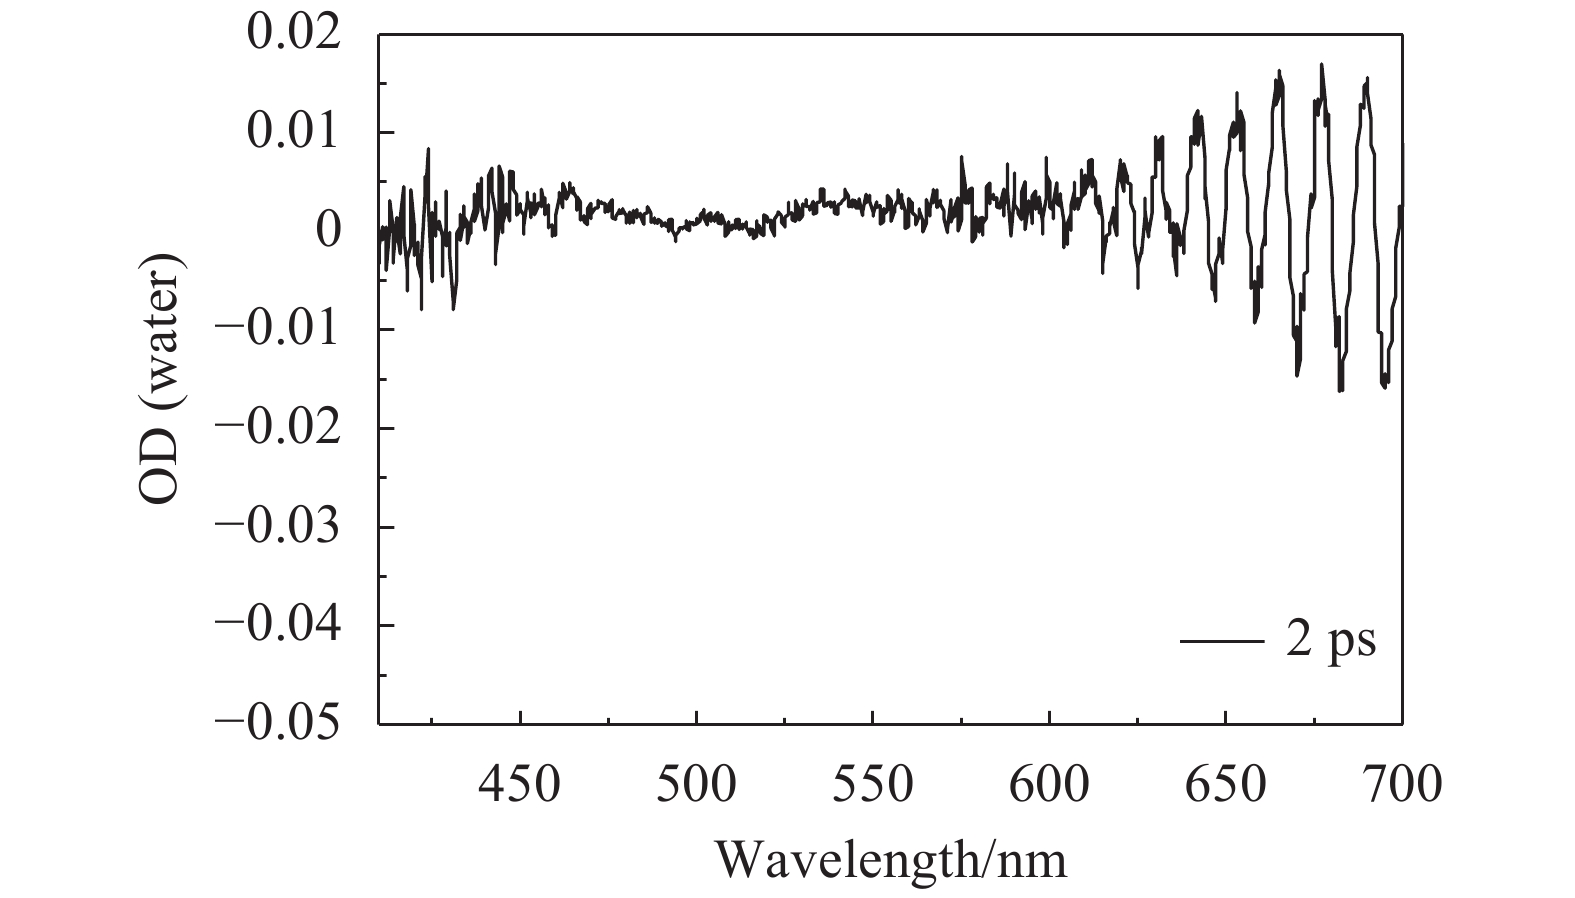
$y = {A_1}{{\rm e}^{\frac{{ - x}}{{{\tau _1}}}}} + {A_2}{{\rm e}^{\frac{{ - x}}{{{\tau _2}}}}}$ ). We obtained the rising, fast-decay and slow-decay process of the pumping bleaching signal, as shown in Tab.3. In order to exclude the influence of solvent effect, the experiment of transient absorption was also carried out for the cuvette and water. The results show that there was no solvent effect in the transient absorption spectrum, as shown in Fig.11.Table 3. CdTe/CdS quantum dots fitting parameters
Sample name Size τ - rise/ps τ 1/ps τ 2/ps S1 3.2 0.34 1.06 17.81 S2 3.3 0.33 1.98 18.43 S3 3.0 0.35 1.13 13.79 S4 3.1 0.59 2.13 38.24 S5 2.6 0.31 1.74 12.77 S6 2.7 0.32 1.79 16.78 
Figure 11. Transient absorption spectrum of the solvent water
The fit parameters are summarized in Tab.3. As shown in the table, the τ -rise was the time of rising to the bleaching maximum. The τ 1 refered to the time of fast-decay process, which depended on the relaxation time of the electrons captured on the surface of the CdTe core [ 14] . The τ 2 refered to the time of slow-decay process, which corresponded to the recombination time between the electrons and the holes in the surface-bound [ 15] . In addition, the exciton recombination and the carrier annihilation exist in the slow-decay process, beyond the experiment.
In Tab.3, the τ -rise increased with the the shell thickness, such as the samples of S1 and S2. Overall, the τ 1 and τ 2 increased with the shell thickness, such as the samples of S1 and S2; at the same time, the τ 1 increased with the core size, such as the samples of S1, S3, and S5. The existence of the CdS shell effectively weakens the influence of surface effect. When the shell thickness was very thin, the electrons were captured on the surface, which was the main reason for above-mentioned phenomenon. With the increase of the shell thickness, the electrons of the core were transferred, and the electron distribution of the shell increased. At this time, electron hole pairs were separated in the space, and the carrier relaxation at the interface between the core and the shell was the main factor. Hence, it’s going to be longer for the time of two decay processes. The time of rising to the bleaching maximum increased with the shell thickness. It is indicates that the time for electron hole pairs to separate in the space was greater than the time required for recombination, and their time difference increased with the shell thickness.
-
In this paper, the water-soluble colloidal CdTe/CdS quantum dots were synthesized by the TGA passivation surface method. The femtosecond Z-Scan measurement and time-resolved transient absorption spectroscopy technique were used to study the influence on the different sizes of core-shell structures in the nonlinear absorption, nonlinear refraction and ultra-fast dynamics characteristics of CdTe/CdS quantum dots.
The Z-scan results show that the shell thickness affects the nonlinear absorption and refraction, which increase with the shell thickness. The core size mainly affects the nonlinear absorption coefficient, which decreases with the increase of the core size. It is obvious that the influence of the core size on the nonlinear refraction coefficient is irregular. The nonlinear absorption characteristics of CdTe/CdS quantum dots with the same shell thickness enhance with the decrease of core size. Correspondingly, the core size that the nonlinear refraction characteristics are affected less. But the nonlinear refraction coefficient increase with the shell thickness. The core size of CdTe/CdS core-shell quantum dots mainly affects the nonlinear absorption characteristics, while the shell thickness that the nonlinear absorption characteristics, nonlinear refraction characteristics and third-order nonlinear susceptibility are produced the regular influence. It is obvious that there are three values increased with the shell thickness. Indicating, as the shell thickness increases, the nonlinear optical properties are enhanced within 2 h of cladding time. After that, the samples of quantum dots were tested by femtosecond time-resolved transient absorption spectroscopy. The results suggested that the rising time of bleaching signal increases with the shell thickness. The decay time of the fast process increases with the shell thickness and core size. And the decay time of the slow process increases with the shell thickness. By studying the ultrafast kinetic curves of different absorption wavelengths, it is found that the exciton lifetime of quantum dots at the absorption peak is longer than the non-absorption peak. Indicating that the exciton lifetime of quantum dots is related to the absorption wavelength.
Nonlinear optics and ultrafast dynamics characteristics of CdTe/CdS quantum dots with different core sizes and shell thickness
-
摘要: CdTe核壳结构半导体量子点具有特殊的非线性光学和超快动力学特性,使其在太阳能电池、光电子器件、生物标记和光纤传感领域有着广泛的应用前景。主要研究了6种不同核心尺寸、不同壳层厚度CdTe/CdS核壳结构半导体量子点的非线性光学和超快动力学特性。在波长400 nm、脉冲宽度130 fs激光脉冲作用下采用Z-Scan技术测量了样品的非线性吸收和非线性折射系数。实验结果表明,CdTe/CdS核壳结构量子点的壳层厚度影响非线性吸收和非线性折射特性,非线性吸收和非线性折射系数均随壳层厚度增加而增大。核心尺寸主要影响非线性吸收特性,非线性吸收系数随核心尺寸的增大而减小。在波长400 nm、脉冲宽度130 fs、频率1 kHz、单脉冲能量400 nJ条件下采用飞秒时间分辨瞬态吸收光谱技术测量了样品的超快动力学特性,得到了瞬态吸收光谱和超快动力学曲线。结果表明漂白信号上升过程时间随壳层厚度的增加而变大。快过程衰减时间随着壳层厚度的增加而变大,同时随着核心尺寸增加而增长;慢过程衰减时间随着壳层厚度的增加而变大。研究揭示了CdTe核壳结构量子点的核心尺寸、壳层厚度对非线性光学和超快动力学的影响规律,为核壳结构量子点的制备和光物理特性研究提供了理论基础。Abstract: CdTe core-shell semiconductor quantum dots are being widely explored due to their special nonlinear optics and ultrafast dynamics characteristics that include solar cells, optoelectronic devices, biological labeling, and optics fiber sensing fields. In this work, the six kinds of CdTe/CdS core-shell quantum dots were researched in the different core sizes and shell thicknesses for the nonlinear optics and ultrafast dynamics characteristics. The nonlinear absorption and refraction coefficients of the samples were measured by using Z-scan technology under the action of 400 nm wavelength and 130 fs laser pulse width. The experimental results show that the shell thickness of CdTe/CdS core-shell quantum dots affects the nonlinear absorption and refraction characteristics, in which the nonlinear absorption and refraction coefficients increase with the shell thickness. And the core size mainly affects the nonlinear absorption characteristics, while the nonlinear absorption coefficient decreases with the increase of the core size. At the same time, femtosecond time-resolved transient absorption spectroscopy technology was used to measure the ultrafast dynamics characteristics of the samples under the conditions of 400 nm wavelength, 130 fs pulse width, 1 kHz frequency, and 400 nJ single-pulse energy. The transient absorption spectra and ultrafast dynamics curves were obtained. The results suggest that the rising time of bleaching signal increases with the shell thickness. The decay time of the fast process increases with the shell thickness and core size. The decay time of the slow process increases with the shell thickness. The research reveals the influence of the core size and shell thickness of CdTe core-shell quantum dots on the nonlinear optics and ultrafast dynamics, providing a theoretical basis for the preparation of core-shell quantum dots and the research of the photophysical properties.
-
Figure 2. Open/closed aperture Z-scan normalized transmittance curves of water-soluble CdTe/CdS, S1-S2 quantum dots
Figure 4. Open/closed aperture Z-scan normalized transmittance curves of water-soluble CdTe/CdS, S5-S6 quantum dots
Figure 3. Open/closed aperture Z-scan normalized transmittance curves of water-soluble CdTe/CdS, S3-S4 quantum dots
Table 1. Six kinds of the CdTe/CdS core-shell quantum dots
Sample number Quantum dots Size /nm Core color Cladding time S1 CdTe/CdS-1 3.2 Orange 30 min S2 CdTe/CdS-2 3.3 orange 1 h S3 CdTe/CdS-3 3.0 Yellow 30 min S4 CdTe/CdS-4 3.1 Yellow 1 h S5 CdTe/CdS-5 2.6 Green 30 min S6 CdTe/CdS-6 2.7 Green 1 h  下载: 导出CSV
Table 2. Nonlinear optical parameters obtained from Z-scan measurement data for CdTe/CdS quantum dots
Sample name Core color Shell Size/nm β/10 -13 m·W -1 n 2/10 −12esu χ 3/10 −14esu S1 Orange CdS-30 min 3.2 4.39 1.42 3.85 S2 Orange CdS-1 h 3.3 5.01 1.49 4.12 S3 Yellow CdS-30 min 3.0 5.07 1.38 3.90 S4 Yellow CdS-1 h 3.1 5.29 1.85 4.92 S5 Green CdS-30 min 2.6 5.23 1.18 3.58 S6 Green CdS-1 h 2.7 6.42 1.73 4.92
下载: 导出CSV
Table 3. CdTe/CdS quantum dots fitting parameters
Sample name Size τ - rise/ps τ 1/ps τ 2/ps S1 3.2 0.34 1.06 17.81 S2 3.3 0.33 1.98 18.43 S3 3.0 0.35 1.13 13.79 S4 3.1 0.59 2.13 38.24 S5 2.6 0.31 1.74 12.77 S6 2.7 0.32 1.79 16.78
下载: 导出CSV
-
[1] Alivisatos A P. Semiconductor clusters, nanocrystals, and quantum dots [J]. Science, 1996, 271(5251): 933-937. doi: 10.1126/science.271.5251.933 [2] Kastner M A. Artificial atoms [J]. Physics Today, 1993, 46(1): 24-31. doi: 10.1063/1.881393 [3] Zhang Danning , Li Dingyun, Sun Qizhuang , et al. Review and prospect of preparation quantum dots [J]. Journal of Bohai University(Natural Science Edition), 2010, 31(2): 104-111. [4] Marandi M, Mirahmadi F S. Aqueous synthesis of CdTe-CdS core shell nanocrystals and effect of shell-formation process on the efficiency of quantum dot sensitized solar cells [J]. Solar Energy, 2019, 188: 35-44. [5] Liang Jing, Zhou Liangliang, Li Bin, et al. Research on the preparation, structure and infrared properties of Sb2Te3 quantum dots [J]. Infrared and Laser Engineering, 2020, 49(1): 0103002. (in Chinese) [6] Tan Liju, Fu Hailu, Shi Tian, et al. Molecularly imprinted based on CdTe quantum dots for the determination of sulfonamide residues in water [J]. Optics and Precision Engineering, 2018, 26(9): 2253-2260. (in Chinese) doi: 10.3788/OPE.20182609.2253 [7] Ding Liyun, Ruan Yinlan, Li Tao, et al. Nitric oxide optical fiber sensor based on exposed core fibers and CdTe/CdS quantum dots [J]. Sensors and Actuators B: Chemical, 2018, B273: 9-17. [8] Gu Z, Zou L, Fang Z, et al. One-pot synthesis of highly luminescent CdTe/CdS core/shell nanocrystals in aqueous phase [J]. Nanotechnology, 2008, 19(13): 135604. [9] Xu Q, Sharp I D, Yuan C W, et al. Large melting-point hysteresis of Ge nanocrystals embedded in SiO 2 [J]. Physical Review Letters, 2006, 97(15): 155701. [10] Song Yinglin, Li Zhongguo. Ultrafast nonlinear refractive effect and mechanism of solvent nitrobenzene [J]. Infrared and Laser Engineering, 2017, 46(5): 0502001. (in Chinese) [11] Sheikbahae M, Said A A, Wei T H. Sensitive measurement of optical nonlinearities using a single beam [J]. IEEE Journal of Quantum Electronics, 1990, 26(4): 760-769. doi: 10.1109/3.53394 [12] Ganeev R A, Ryasnyansky A I, Tugushev R I, et al. Investigation of nonlinear refraction and nonlinear absorption of semiconductor nanoparticle solutions prepared by laser ablation [J]. Journal of Optics A Pure & Applied Optics, 2003, 5(4): 409-417. [13] Zeng F, Han Y, Hou Q, et al. Ultrafast carrier dynamics of aluminum-doped silicon film irradiated by femtosecond laser pulse [J]. European Physical Journal Applied Physics, 2017, 77(3): 30301. [14] Chuang C H, Lo S S, Scholes G D, et al. Charge separation and recombination in CdTe/CdSe core/shell nanocrystals as a function of shell coverage: Probing the onset of the quasi type-Ⅱ regime [J]. Journal of Physical Chemistry Letters, 2010, 1(17): 2530-2535. doi: 10.1021/jz1008399 [15] Padilha L A, Neves A A R, Cesar C L, et al. Recombination processes in CdTe quantum-dot-doped glasses [J]. Applied Physics Letters, 2004, 85(15): 3256-3258. doi: 10.1063/1.1801683 -

 点击查看大图
计量
- 文章访问数: 578
- HTML全文浏览量: 148
- PDF下载量: 36
- 被引次数: 0


