


-
气动光学效应导致的目标图像偏移对于飞行器的影响很大。飞行器高速运动产生的头部非均匀流场会使测量的目标位置偏离实际的目标位置,导致飞行器的瞄准点出现误差,严重影响飞行器的制导精度[1]。
一些学者对气动光学的成像偏移与影响因素进行了理论和实验研究。殷兴良[2]指出在相同的飞行速度情形下,随着飞行高度的增加图像偏移程度减小;在相同的飞行高度情形下,随着飞行速度的增加,图像偏移程度增加。Xu等[3]认为,飞行高度和马赫数等物理量不直接影响成像偏移。他指出这些因素影响了弹体周围的气体密度,从而导致射线的传播路径发生变化,进而导致了成像偏移。江涛等[4-5]分析了马赫数、迎角、高度、入射角和入射波长对光学传输效应的影响,并提出30 km以下,气动光学效应对光学成像影响较大;Xu等[6]提出减小成像偏移应考虑的三个与流场相关的因素:非均匀流场中的传播距离、自由流边界的入射角、非均匀流场中沿传播路径的密度分布。王乃祥等[7]对比分析了不同攻角下流场对光学系统性能的影响,随着攻角的增大,窗口周围产生的流场对光学性能的影响也增大;Xu等人[8]分析了追踪步长对成像偏移的影响:步长越小,光线追踪精度越高,步长越小会导致追踪计算增加;Yao等[9]提出视线角对气动光学成像偏移的影响:随着视线角的增大,成像偏移在逐渐减小;Wang等[10]研究了高度对半球形光学圆顶的气动光学成像质量退化的影响:在相同飞行条件下,随着高度的增加,气动光学效应对成像质量下降的影响逐渐减弱;陈曦[11]首次将视线滚转角引入气动光学效应的研究中:随着视线滚转角的增大,成像偏移减小;Zhang等[12]分析了不同尺度的湍流结构引起的气动光学效应,通过将大涡破碎成小于0.018
$\delta $ ,有望提高气动光学的抑制效果;张紫叶[13]进行了0~25 km气动光学成像偏移的研究:随着高度的增加,成像偏移减小。文献[7]研究的攻角对光学窗口的影响为之后的窗口优化提供了理论依据,文献[10]和[13]都得出了随着高度的增加,气动光学效应减小的结论。和以往的文献对比,文中重点分析了不同高度对0°~15°攻角气动光学成像偏移的影响,研究了不同飞行工况的成像偏移数据下高度和攻角变化引起的气动光学效应。
-
衡量光学系统瞄准程度的量是瞄视误差(Bore-Sight Error, BSE)。它的定义是在有、无干扰两种情况下,目标图像形心的位置差值,也就是由测量得到的目标位置与实际目标位置的差别。从瞄视误差的概念来看,使用像平面上的成像位置差值来衡量瞄视误差时,这个值就是成像偏移。
成像偏移既可以是实际目标图像中心点与视在目标中心点与基准坐标的角度偏移之差,也可以是角度偏移乘以目标与本机距离换算为弧长,进而近似表示为实际目标位置和虚假目标位置之间的欧氏距离。还可以是假设有和无气动光学流场的情况下,光线经非均匀流场偏折传播与直线传播这两种情况落在笔者定义的计算成像平面上的成像位置之欧氏距离差。虽然以上三种成像偏移定义不同,但他们本质都在描述气动光学流场对光传播的偏折,描述的是同一物理过程。
文中计算的是上述第三种成像偏移。在确定的几何模型中,上述三种成像偏移量值都很容易通过几何关系互相转换。必须明确的是,上述三种成像偏移量都描述的是气动光学流场带来的成像偏移,都是以该流场的尽头即光学窗口外表面为成像计算平面,而得到的成像偏移数值[14]。
-
使用计算力学软件对实际问题进行分析计算时,一般可以分为前处理、求解器迭代计算、后处理三个部分。主要流程如图1所示。
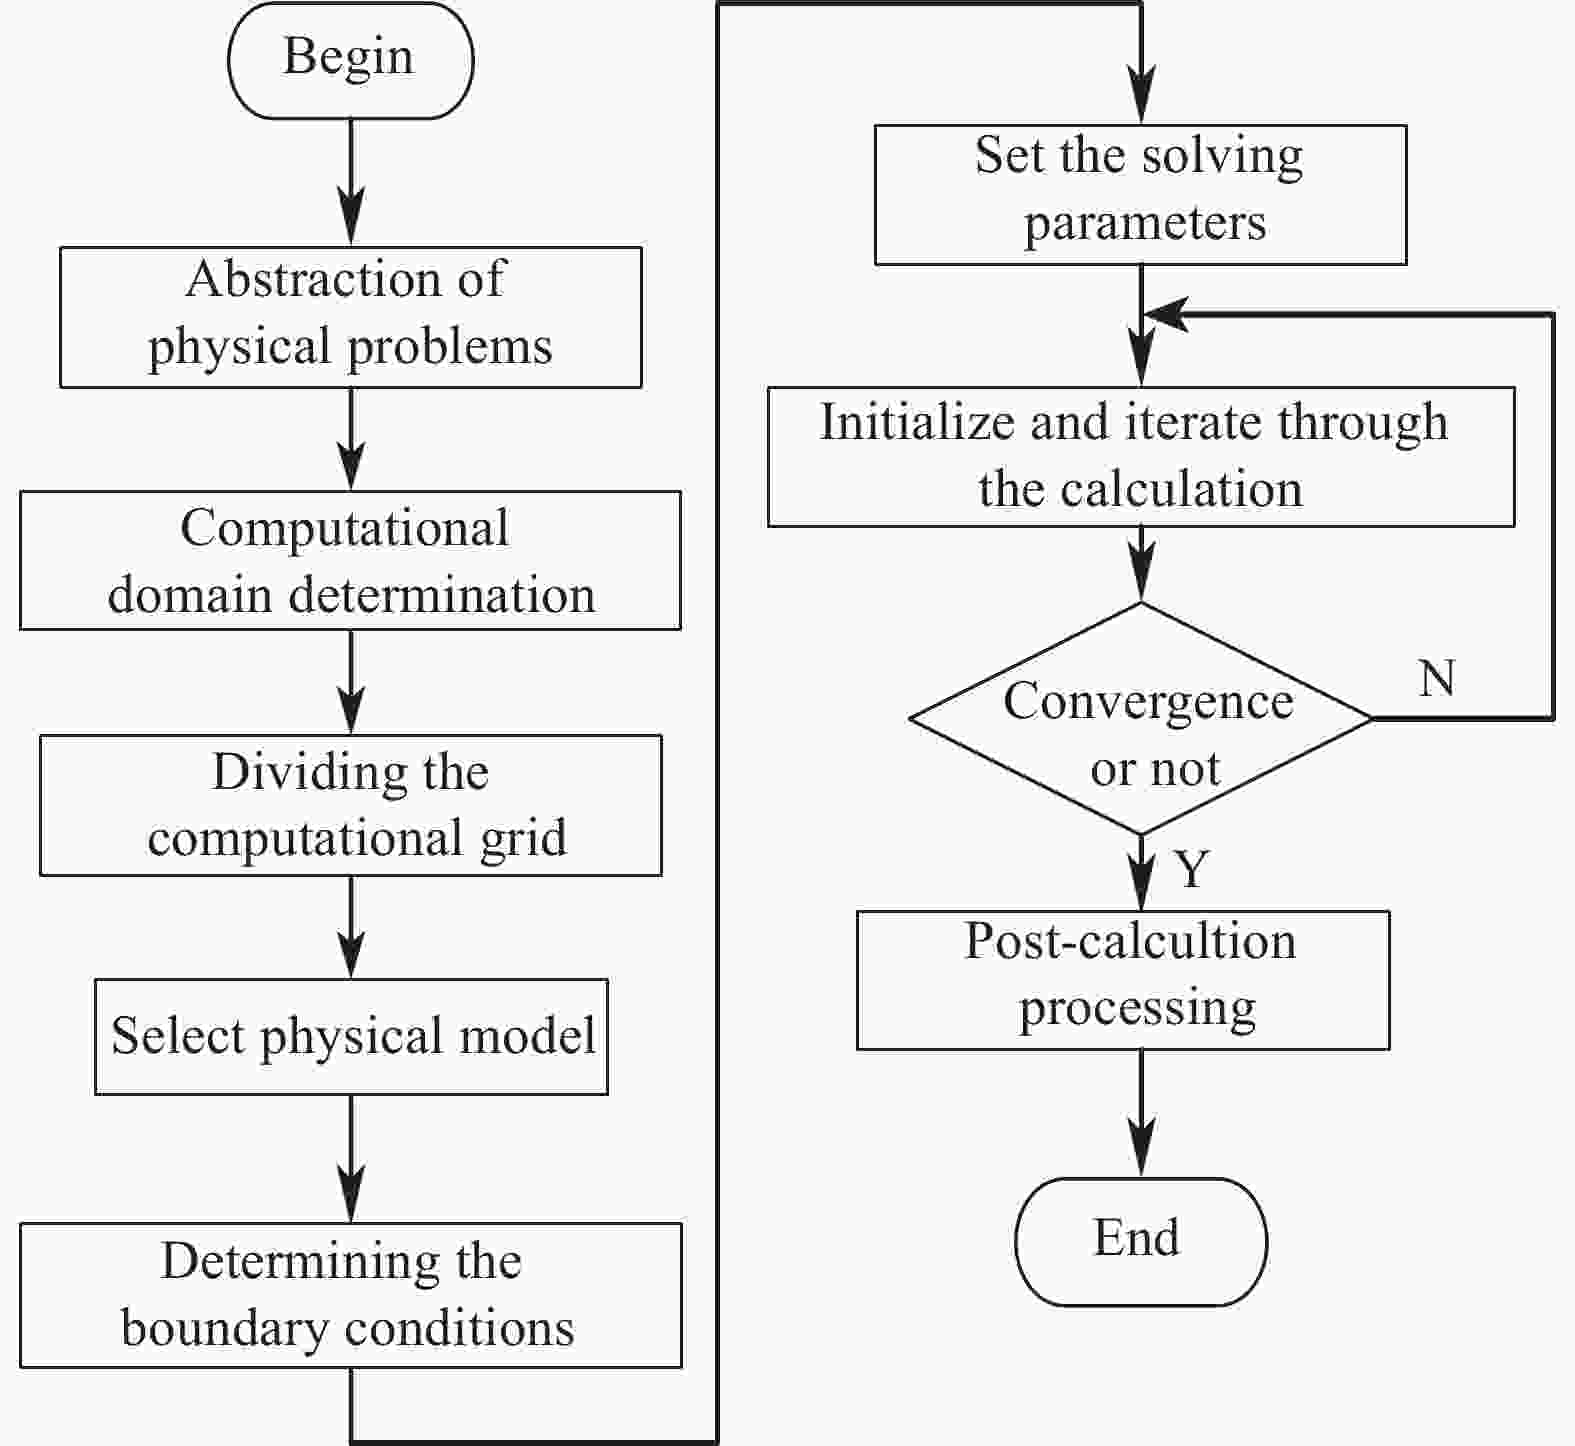
图 1 计算流体力学数值模拟流程图
Figure 1. Flowchart of numerical simulation of computational fluid dynamics
-
由于流体运动方程组是非线性的微分方程组,目前还没有办法求出方程的解,只能通过离散的方法对其进行数值的计算。直接数值模拟法可以直接对控制方程进行求解,但是直接求解对计算机的性能和内存要求过高;大涡模拟法通过近似模型进行计算,该方法提高了精确的计算,但对计算机的性能要求仍然很高;Reynolds平均法通过求解时均控制方程求解流场,模型建立比较方便,在保证精度的前提下计算速度快,在实际工程上应用最广泛[15-16]。文中选择Rey-nolds平均法的Realizable
$k - \varepsilon $ 两方程模型,该模型满足对雷诺应力的约束条件,因此可以在雷诺应力上与真实湍流保持一致,这个特点在计算中的好处就是:可以更精确地模拟平面和原形射流的扩散速度,计算结果更符合真实情况。文中使用软件对典型的钝头飞行器进行建模和网格划分,通过大量的模拟计算获得了飞行器周围的流场密度。建模的2D模型如图2(a)所示,3D模型如图2(b)所示。网格划分的结果如图2(c)所示,为了提高模拟精度,对光学窗口周围的网格进行网格加密,一共包含621 730个网格单元。

图 2 (a) 2D模型;(b) 3D模型;(c) 3D模型网格划分
Figure 2. (a) 2D model; (b) 3D model; (c) Meshing of 3D model
-
通过仿真计算得到流场的密度后,还需要计算流场气体的折射率。光波的传输主要受到折射率分布的影响,研究光的传输特性,应当求解流场的折射率。影响气体介质折射率的影响因素有很多,气体的温度、密度及气体组成部分等都会对折射率产生一定的影响[17-18]。一般情况下,气体的折射率大小主要取决于气体的密度。气体密度与气体折射率之间的关系的转换关系,目前应用最广泛的是洛伦兹—洛伦茨(Lorentz-Lorenz)公式,如公式(1)所示:
$$ \left( {\frac{{{n^2} - 1}}{{{n^2} + 2}}} \right)\frac{1}{\rho } = \frac{2}{3}{K_{GD}} $$ (1) 式中:
$\;\rho $ 为流场中气体的密度分布;$n$ 为气体折射率;${K_{GD}}$ 为Gladstone-Dale常数。密度
$\;\rho $ 的单位为${\rm kg/{m^3}}$ ,波长$\lambda $ 的单位为$\text{μ} \rm m$ 时,Gladstone-Dale常数可由公式(2)表示[19]:$$ {K_{GD}} = 2.23 \times {10^{ - 4}}\left( {1 + \frac{{7.52 \times {{10}^{ - 3}}}}{{{\lambda ^2}}}} \right) $$ (2) -
给定飞行器的飞行海拔高度后,当前大气的密度
$\;\rho $ (${\rm{kg}}/{{\rm{m}}^3}$ )、压力$p$ (${\rm{kg}}/{{\rm{m}}^2}$ )和温度$T$ (${\rm{K}}$ )等参数都可以通过大气参数表查询得到,如表1所示。表 1 压力、温度、密度随海拔高度的分布
Table 1. Distribution of pressure, temperature, and density with altitudes
${{Z/\rm km} }$ ${{p/\rm Pa} }$ ${{T/\rm K} }$ $\rho /{\rm{kg} }\cdot{ {\rm{m} }^{-3}}$ 0 1.01325×10⁵ 288.150 1.2250 5 5.4048×10⁴ 255.676 7.3643×10⁻¹ 10 2.6499×10⁴ 223.252 4.1351×10⁻¹ 15 1.2111×10⁴ 216.650 1.9476×10⁻¹ 20 5.5293×10³ 216.650 8.8910×10⁻² 25 2.5492×10³ 221.552 4.0084×10⁻² -
从简化波动方程可以推导出光线在两点间光程的函数——程函,其近似形式如公式(3)所示:
$$ {\left( {\nabla S} \right)^2} = {n^2} $$ (3) 为了推导光线方程,将公式(3)作梯度处理,有公式(4):
$$ 2\nabla S \cdot \nabla \nabla S=2n\nabla n $$ (4) 定义算子相乘为张量算子。用公式(3)的微分形式,如公式(5)、(6)所示:
$$ n \cdot \frac{{\rm{d}}{\boldsymbol{r}}}{{\rm{d}}s}=\nabla S $$ (5) $$ \frac{\rm d}{{\rm{d}}s}={\displaystyle \sum _{i}\frac{{\rm{d}}{x}_{i}}{{\rm{d}}s}} \cdot \frac{\partial }{\partial {x}_{i}}=\frac{{\rm{d}}{\boldsymbol{r}}}{{\rm{d}}s} \cdot \nabla $$ (6) 联合公式(5)、(6),公式(4)可转化成公式(7):
$$ \frac{{\rm{d}}}{{{\rm{d}}s}}\nabla S = \nabla n $$ (7) 将公式(5)对
$S$ 求导数,并用公式(7)得到光线微分公式(8):$$ \frac{\rm d}{{\rm{d}}s}\left(n \cdot \frac{{\rm{d}}{\boldsymbol{r}}}{{\rm{d}}s}\right)=\nabla n $$ (8) 式中:
$s$ 为光线传播路径上的弧长;${\boldsymbol{r}}$ 为光线矢径;$n$ 为折射率;$\nabla n$ 为折射率梯度。公式(8)在大部分情况下是没有解析解的,通常要用数值方法计算,这是因为光线传播轨迹不是直线而是曲线,只有在极少数情况下可以求得介质中光线方程的解析解。这时必须通过其他方法对光线进行追迹,如泰勒级数展开法、欧拉法以及龙格—库塔法等。其中四阶龙格—库塔法的求解精度高,故文中选择使用该法对光线传输进行追迹。
根据几何光学原理,采用光线追迹的方法对光线在光学窗口外高速流场的传输进行计算。在光线追迹时,顺着光线传播方向的追迹称为正向追迹;与之相应的,逆着光线传播方向的追迹称为反向追迹。文中采用反向光线追迹方法,光线追迹的起点设置在窗口内部,反向追迹的终点由一个停止追迹准则来确定,使光线追迹停止在流场边界处,减小传统正向追迹时在自由流中的多余计算。
反向光线追迹停止准则可由公式(9)定义:
$$ \left| {{n_{p + q}} - {n_f}} \right| \leqslant \delta ,q = 0,1, \cdots ,m $$ (9) 式中:
${n_{p + q}}$ 为第$p + q$ 步追迹时的折射率;${n_f}$ 为当地自由流的折射率;$\delta $ 是一个很小的正数,通常取${10^{ - 4}}$ ;$m$ 为额外追迹的步数,正整数$m$ 的取值由光线追迹的推进几何步长$\Delta s$ 决定,一般取为$\left[ {0.003/\Delta s} \right] + 1$ [8]。 -
飞行器(Missile)与目标(Target)的三维相对运动几何关系如图3所示。其中XYZ为惯性坐标系,建立在飞行器的初始位置,X轴正方向为飞行方向,
$\theta $ 为目标与飞行器轴线的夹角,代表飞行器的视线倾角(Line of Sight Angle, LOS angle),$\varphi $ 为目标绕X轴旋转后与X轴所经过铅垂面的夹角,代表飞行器的视线滚转角(Line of Sight Roll Angle, LOSR angle)[11,20]。
图 3 飞行器与目标的三维相对运动关系
Figure 3. Three-dimensional relative motion relationship between the missile and the target
-
使用Fluent对飞行器周围的气动光学流场进行计算,使用基于密度的求解器并开启能量方程,湍流模型选择Reynolds平均法的Realizable
$k - \varepsilon $ 两方程模型,边界条件设置为压力远场和恒温壁面,设置二阶精度离散格式处理湍动能和湍流耗散率。在不同高度(Altitude)、马赫数(Mach Number)、攻角(Angle of Attack,AOA)组合的飞行工况下,对钝头飞行器流场进行了大量的仿真计算。飞行高度设置为0~25 km,马赫数0.5~3 Ma,攻角0°~15°,视线滚转角5°,视线倾角35°。计算的飞行参数取值范围覆盖了该飞行器光学系统工作时的大多数情况。飞行参数的取值情况见表2。
表 2 仿真计算的飞行参数取值范围
Table 2. Range of flight parameters calculated by simulation
Flight parameters Range Interval Altitude 0-25/km 5 Mach number 0.5-3 0.5 AOA 0-15/(°) 1 LOSR angle/(°) 5 LOS angle/(°) 35 随机挑选6组不同的飞行工况用来展示平均密度流场、折射率分布、成像偏移和飞行器在不同高度对0°~15°攻角的气动光学成像偏移斜率,随机挑选的飞行工况设置条件如表3所示。
表 3 飞行工况
Table 3. Flight condition
Sample Altitude/
kmMach
number/MaAOA/
(°)LOSR
angle/(°)LOS
angle/(°)1 0-25 1.5 5 5 35 2 10 3 2 0 4 1.5 0-15 5 2 6 3 -
文中随机挑选了2组飞行工况来展示0~25 km高度变化对平均流场密度的影响。从图4、图5中可以看出随着高度的增加,飞行器周围的大气密度降低,飞行器的头部流场密度最大值和最小值都在减小,并且不同高度的流场结构是相似的。无攻角时,飞行器的流场结构关于飞行器轴线对称;有攻角时,飞行器迎风面的气动光学流场变薄,飞行器流场截面轴线上方的非均匀流场厚度逐渐增加。

图 4 不同高度飞行器头部平均流场密度分布图 (Sample 1)
Figure 4. Average flow field density distribution in the head of the vehicle at different altitudes (Sample 1)

图 5 不同高度飞行器头部平均流场密度分布图 (Sample 2)
Figure 5. Average flow field density distribution in the head of the vehicle at different altitudes (Sample 2)
-
图6是不同高度在反向光线追迹时的折射率分布图,X轴是归一化步长,Y轴是折射率,Z轴是海拔高度。光线追迹起点位于窗口内部传感器上,追迹步长设为0.8 mm。当光线进入气动光学流场后,传播路径上的折射率会先增大后减小。光线追迹从窗口内部的起点开始,逆着光线入射方向经过非均匀流场的折射率先升高再降低,最后到达自由流折射率降低直到追迹结束。光学窗口附近的非均匀流场折射率度随着高度的增加而减小,尽管不同高度的光线传播路径折射率分布图有着相同的变化趋势,但是却有着不一样的变化程度。高度越大,光线传播路径上的折射率分布越平坦,成像偏移越小。
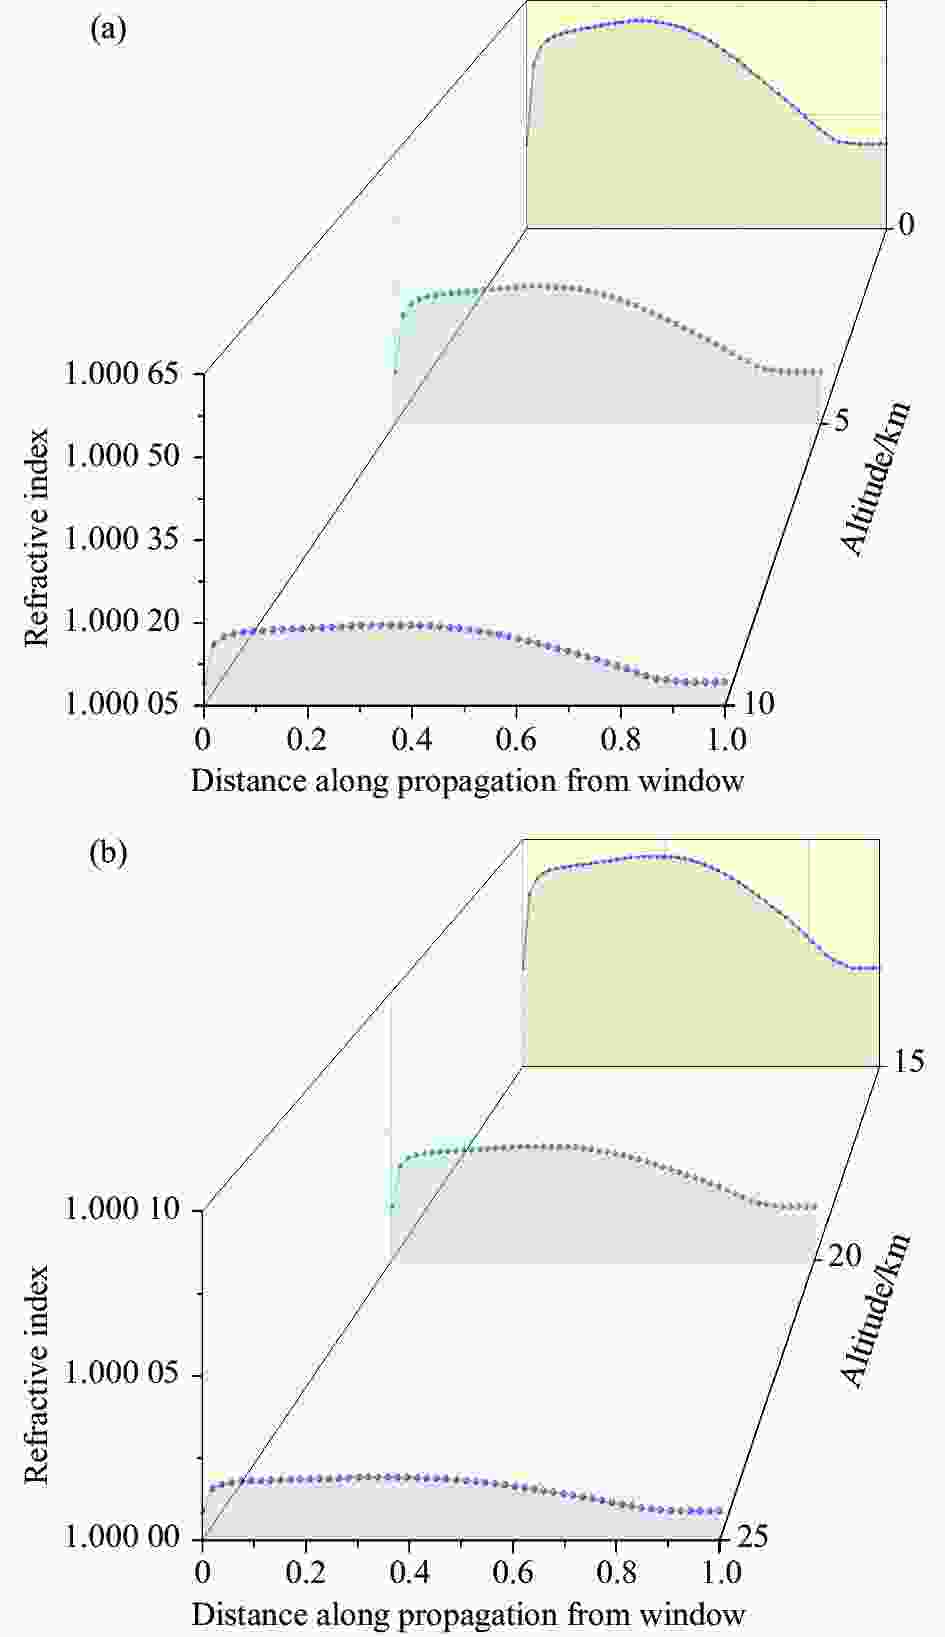
图 6 不同高度的反向光线追迹折射率分布图(Sample 3)
Figure 6. Refractive index distributions of backward ray tracing at different altitudes (Sample 3)
-
成像偏移斜率是影响系统性能的一个关键参数。它被定义为成像偏移的微小变化除以相关变量的微小变化,成像偏移斜率反映了成像偏移对这个量的敏感程度。
文中采用有限差分法计算了不同高度对0°~15°攻角气动光学成像偏移的斜率。对于序列内的数据,使用具有二阶精度的中心差分格式。以
$d$ 为成像偏移,以$\Delta x$ 为相关变量的步长,$\nabla d$ 为成像偏移斜率,中心差分格式如公式(10)所示:$$ \nabla d = \frac{{{d_{i + 1}} - {d_{i - 1}}}}{{2\Delta x}} $$ (10) 对于序列左边界的数据,采用一阶前向差分格式如公式(11)所示:
$$ \nabla d = \frac{{{d_{i + 1}} - {d_i}}}{{\Delta x}} $$ (11) 对于序列右边界的数据,采用一阶后向差分格式如公式(12)所示:
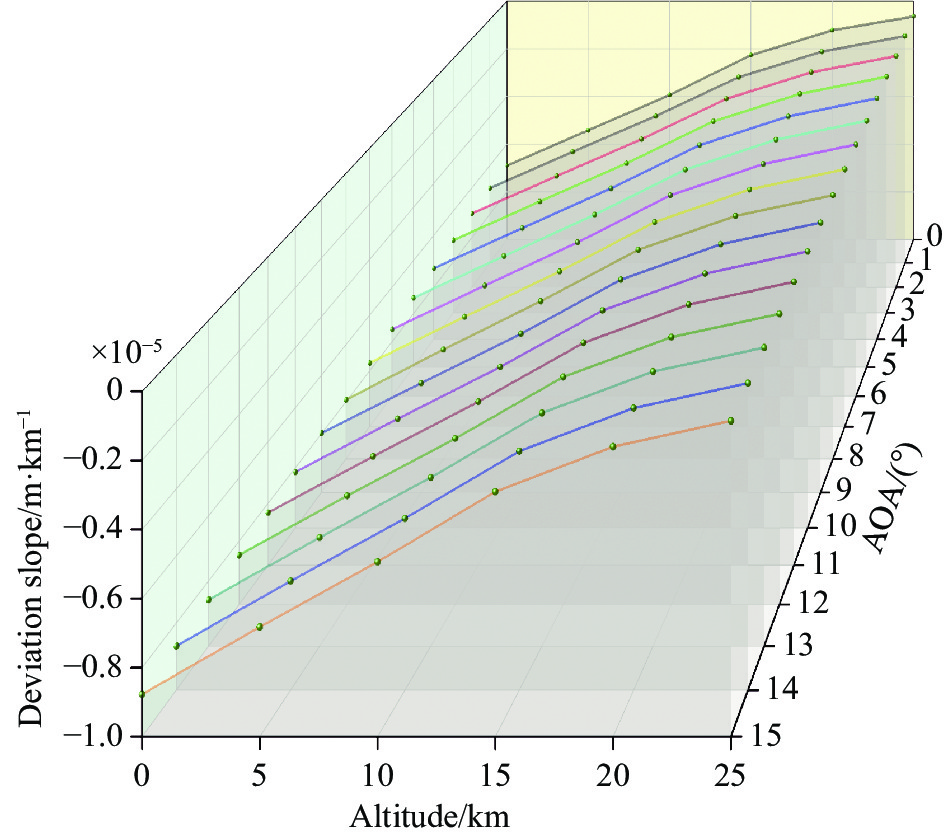
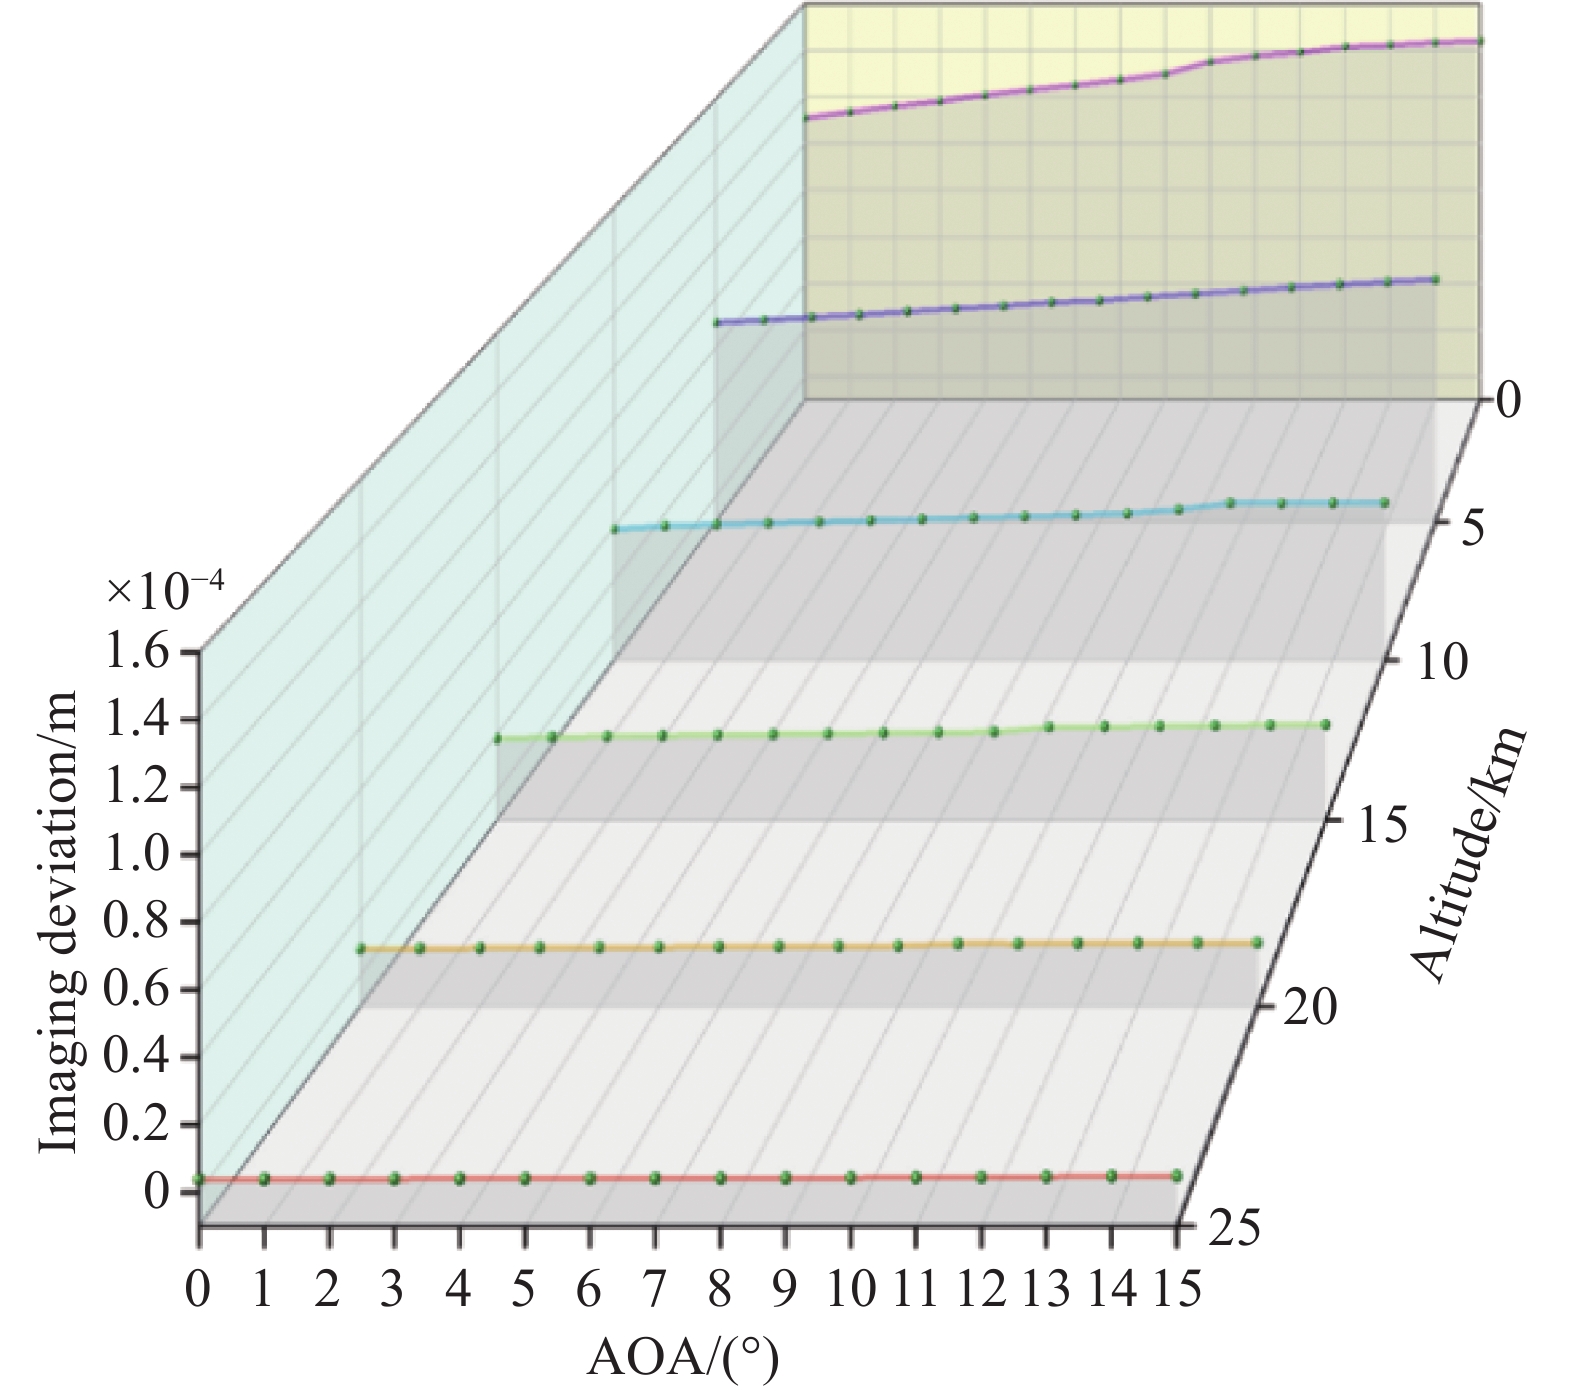
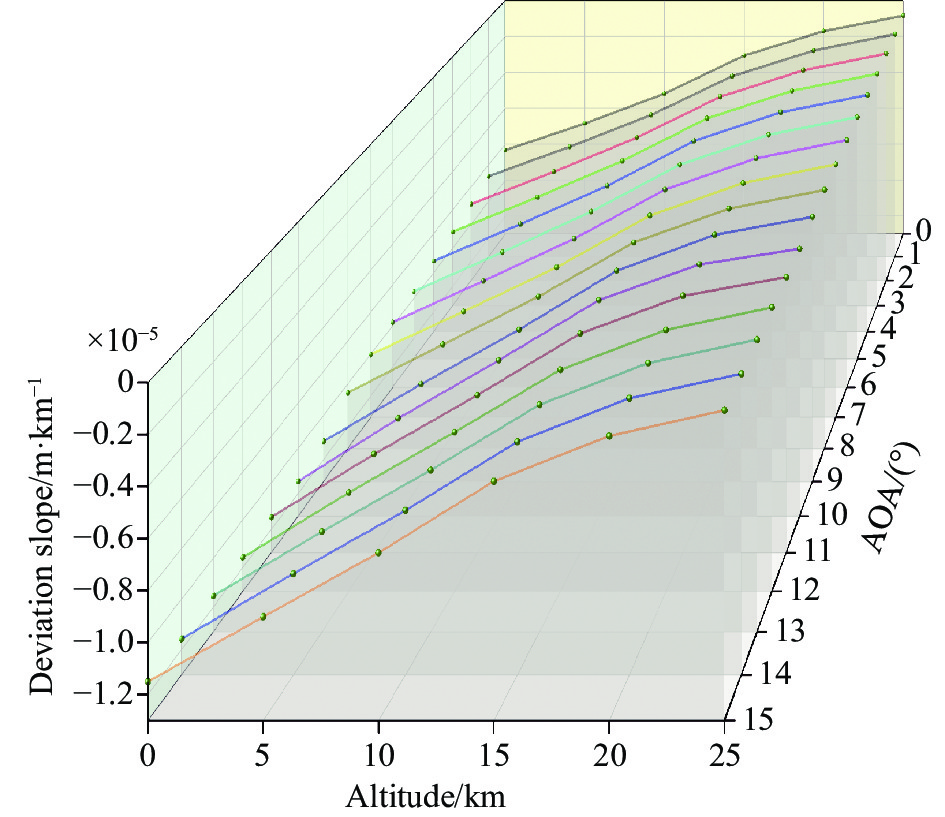
$$ \nabla d = \frac{{{d_i} - {d_{i - 1}}}}{{\Delta x}} $$ (12) 从图7~图12中可以看出:随着高度的增加,成像偏移数值在减小。不同高度的光线传播路径折射率分布图有着相同的变化趋势,却有着不同的变化程度。高度越大,光线传播路径上的折射率分布越平坦,成像偏移越小。0°~15°内,随着攻角的增大,成像偏移也随之增加。从成像偏移斜率来看:在0~25 km内,随着攻角的增加,成像偏移斜率往0的负方向增大,说明较大攻角的变化会导致较大的成像偏移。并且在相同高度条件下,0°攻角的斜率更接近0,这说明0°攻角对偏移值的变化最不敏感。同时,随着高度的增大,同攻角下的偏移斜率从0的负方向逐渐接近于0,这也说明较低高度的变化会引起较大的成像偏移。随着马赫数的增加,相同条件下的成像偏移值和成像偏移斜率都在增大。
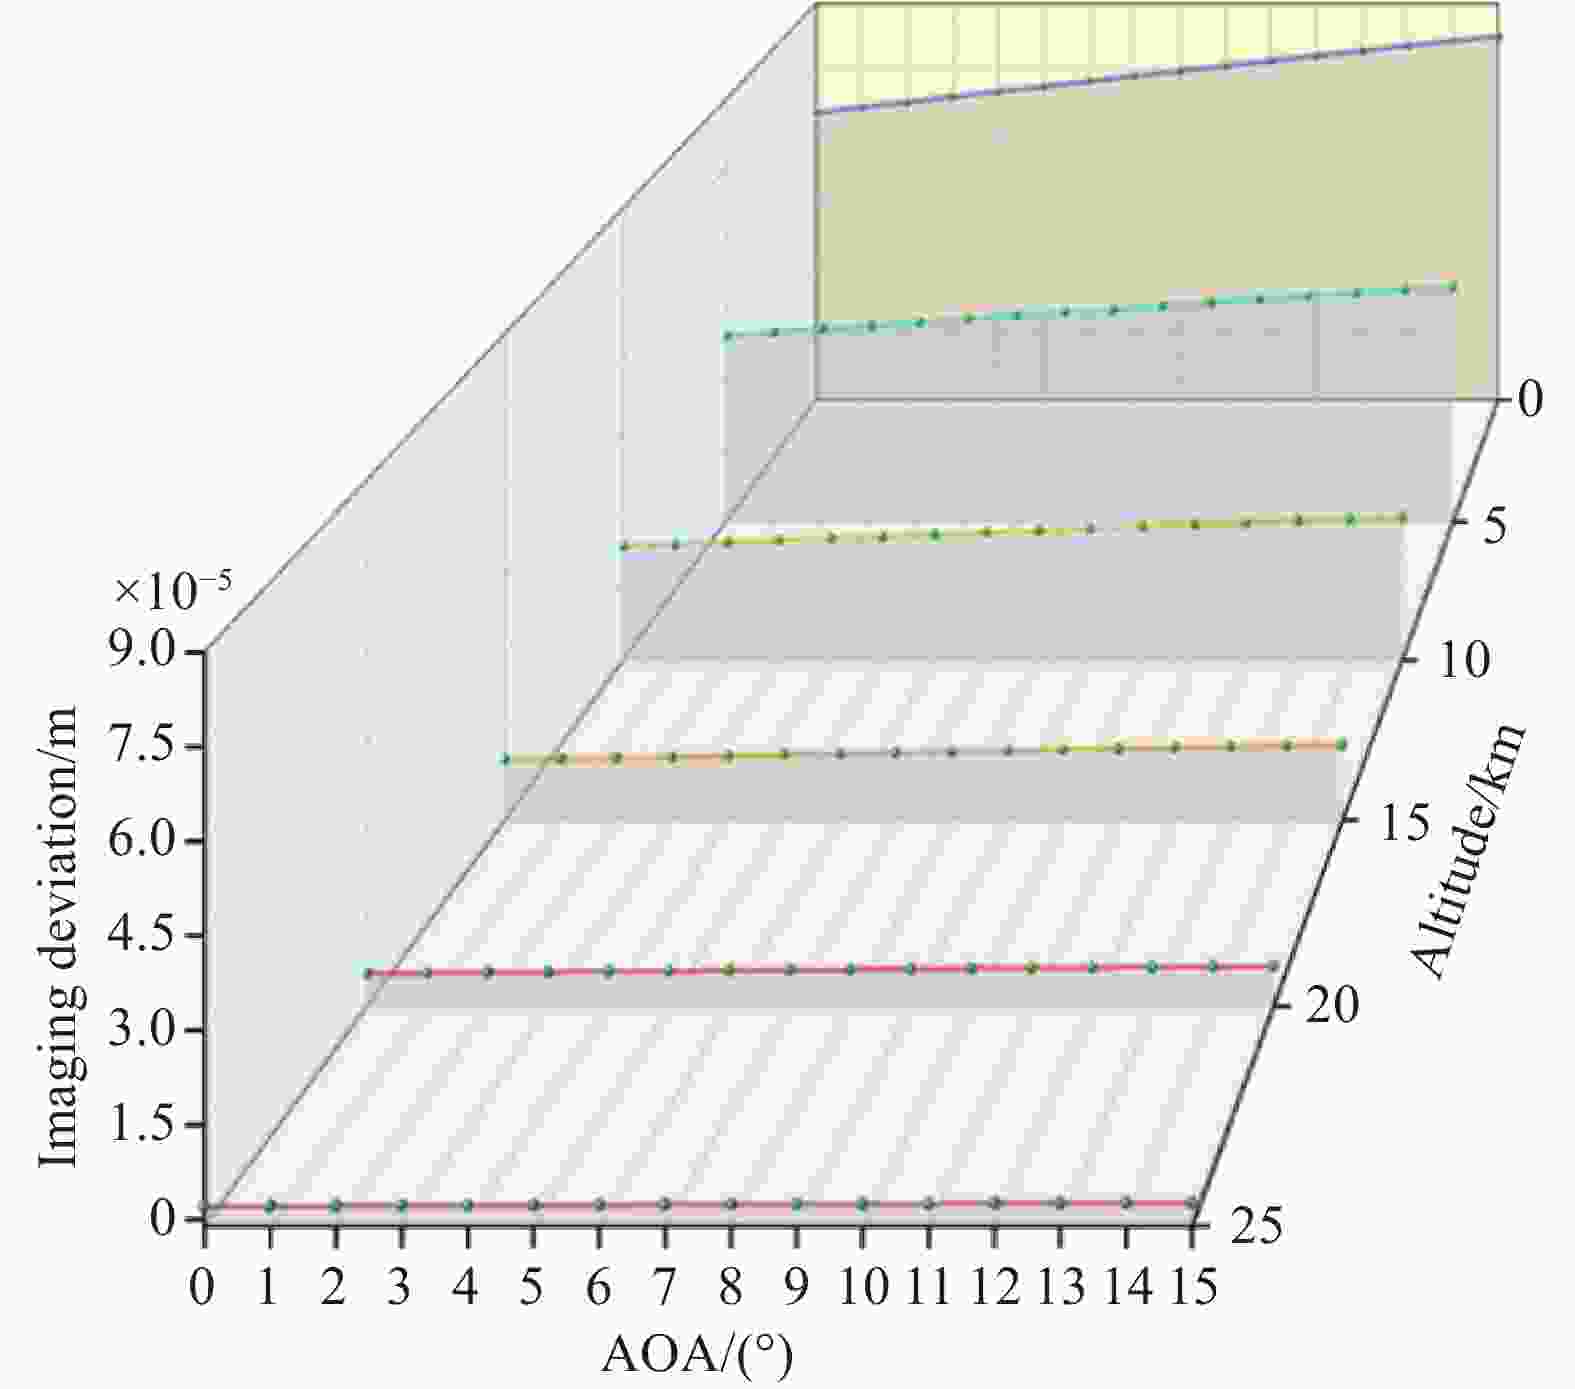
图 7 气动光学成像偏移 (Sample 4)
Figure 7. Aero-optics imaging deviation (Sample 4)

图 8 气动光学成像偏移斜率 (Sample 4)
Figure 8. Aero-optics imaging deviation slope (Sample 4)
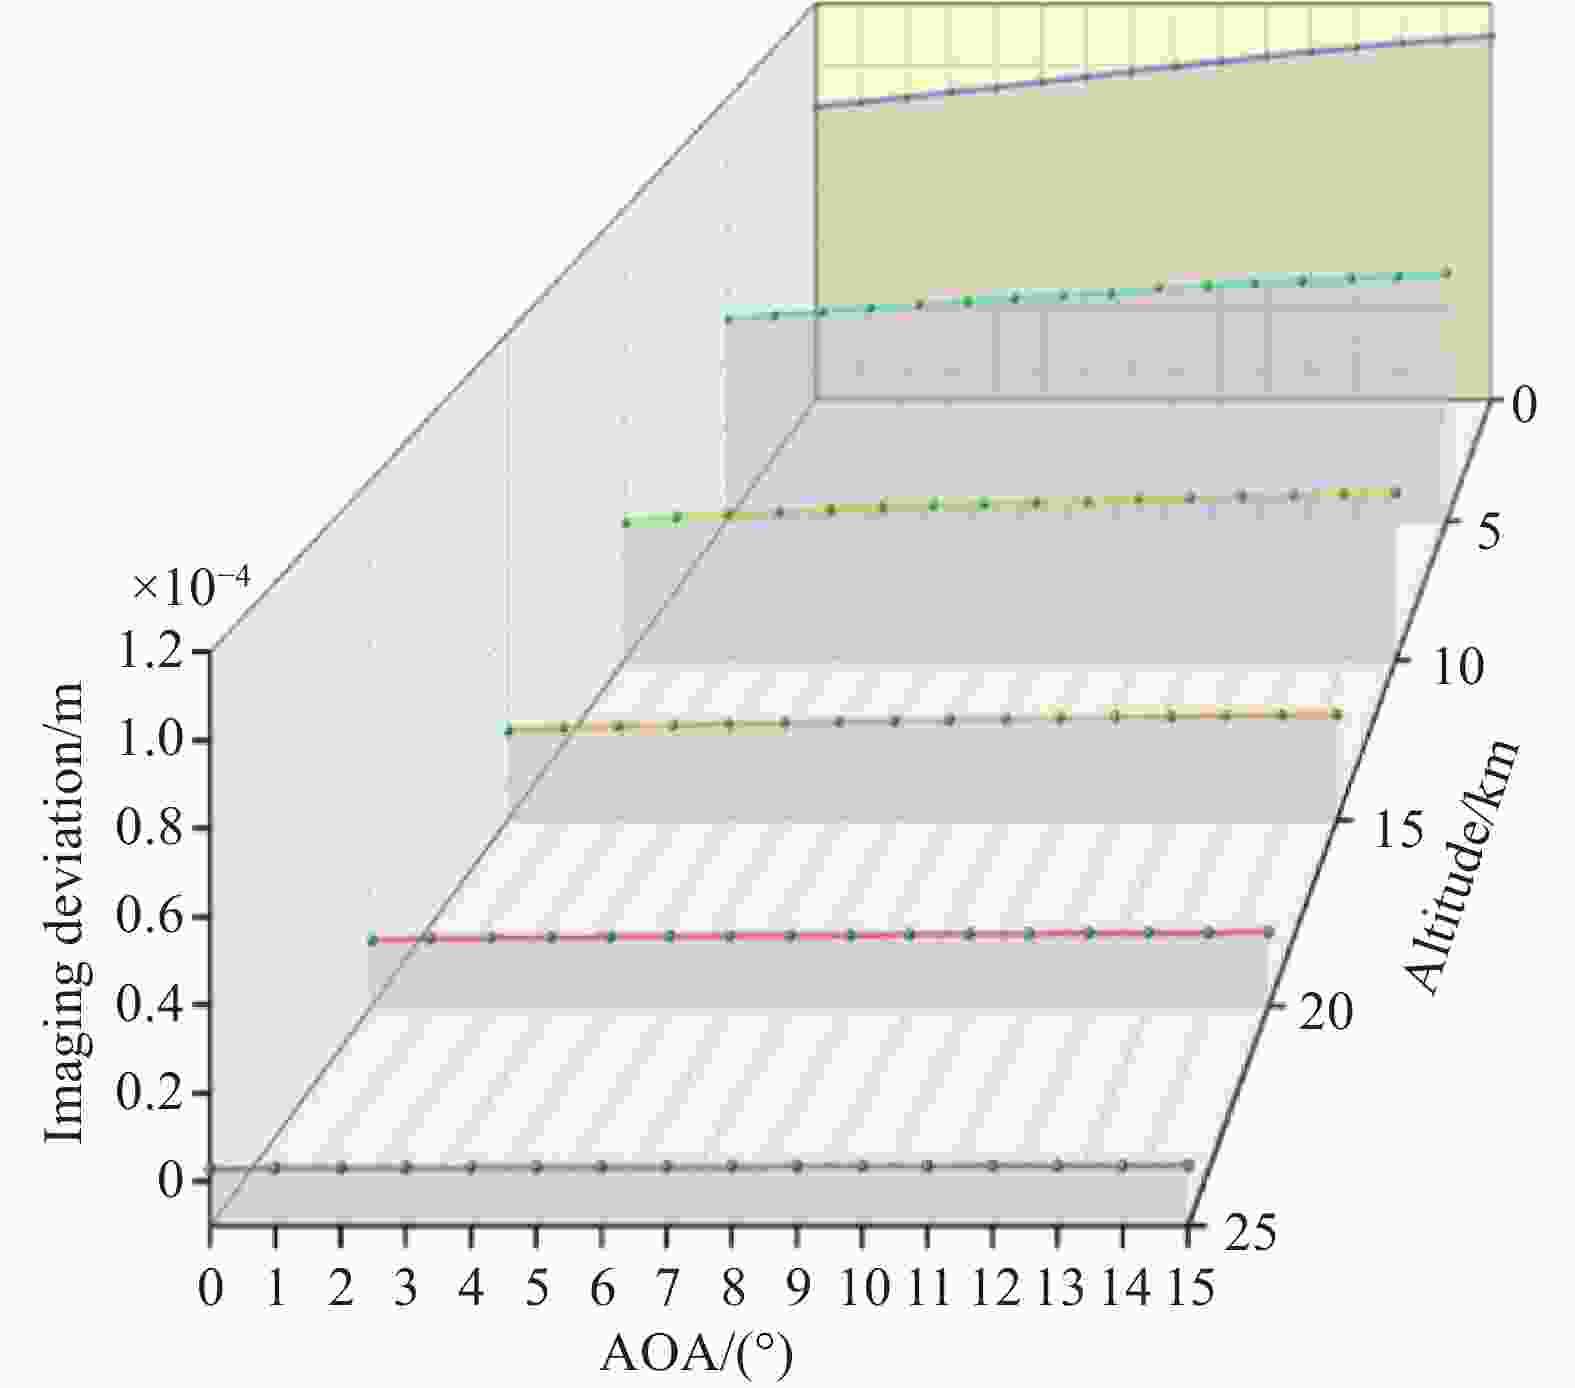
图 9 气动光学成像偏移 (Sample 5)
Figure 9. Aero-optics imaging deviation (Sample 5)

图 10 气动光学成像偏移斜率 (Sample 5)
Figure 10. Aero-optics imaging deviation slope (Sample 5)

图 11 气动光学成像偏移 (Sample 6)
Figure 11. Aero-optics imaging deviation (Sample 6)
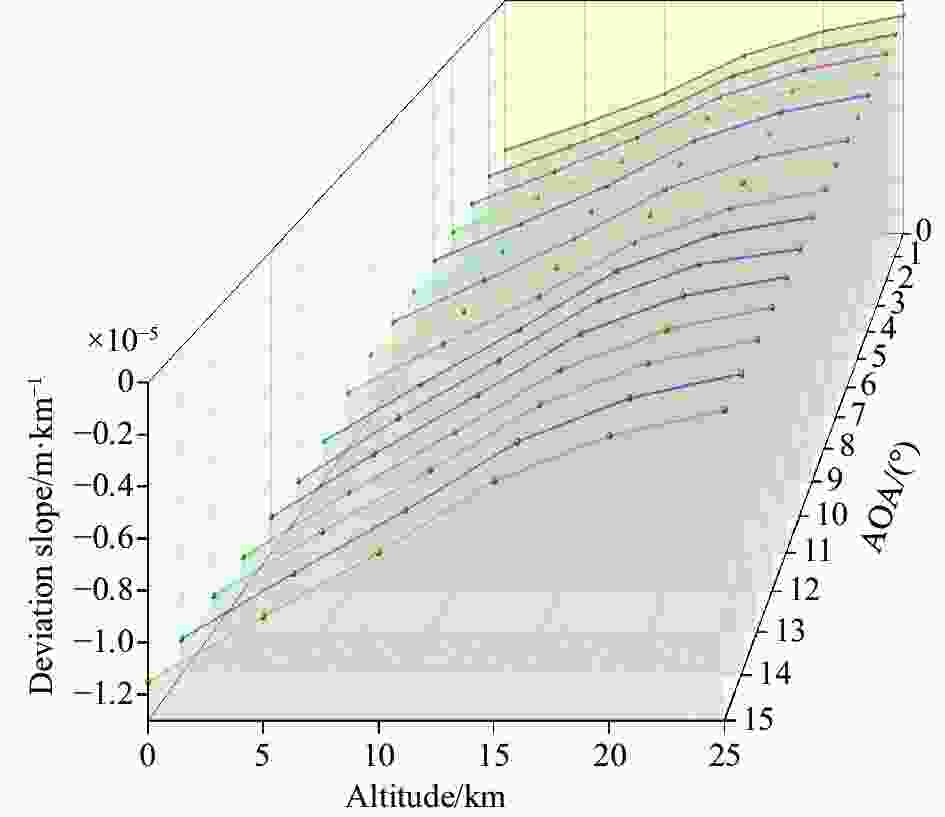
图 12 气动光学成像偏移斜率 (Sample 6)
Figure 12. Aero-optics imaging deviation slope (Sample 6)
-
文中主要研究了不同高度对0°~15°攻角气动光学成像偏移的影响。所得研究结果符合物理规律,也符合以往文献的研究结果,即随着高度的增加,气动光学效应减弱;随着攻角的增大,气动光学效应增强。在以往对攻角的研究中,大多粗略地给定攻角范围,而缺乏细粒度的连续性计算和分析。文中对0°~15°范围每隔1°攻角的成像偏移逐一开展了计算分析,研究结果表明:随着高度的增大,不同高度的光线传播路径折射率分布越来越平坦,成像偏移值减小。随着攻角的增大,光线传播路径上的折射率分布越不平坦,成像偏移随之增加。在飞行高度较高的情况下,成像偏移斜率接近于0。随着攻角的增大,成像偏移斜率在往0的负方向增大。从成像偏移斜率来看,低高度和大攻角都会引起较大的成像偏移值的变化。同时研究结果显示,在25 km处,高马赫数对成像偏移的影响比大气密度大,这一结果有待在未来更多不同工况的高马赫数计算结果中被综合分析,进而探讨相关因素对实际应用的影响,相关成果有望对红外制导飞行器的飞行高度、速度以及成像姿态的综合设计给出理论计算的参考。
Influence of different altitudes on deviation of aero-optics imaging of 0°-15° angle of attack
-
摘要: 飞行器在高速飞行过程中,头部产生湍流流场,该流场使机载光学系统接收的目标图像发生偏移、模糊和抖动,这种气体流场对光学传播和光学成像的影响或作用称为气动光学效应。文中研究了典型钝头飞行器在不同高度对0°~15°攻角气动光学成像偏移的影响。使用软件对一种典型的钝头飞行器进行了建模和网格划分,基于计算流体力学使用Fluent作了大量的模拟计算,获得了飞行器不同工况下的周围的流场密度。通过密度和折射率的对应关系,得到了飞行器周围相应的折射率分布。使用反向光线追迹和停止准则,获得了成像偏移数据。结果表明:随着高度的增加,飞行器周围的大气密度减小。尽管不同高度的光线传播路径折射率分布图有着相同的变化趋势,但却有着不一样的变化程度。高度越大,光线传播路径上的折射率分布越平坦,成像偏移越小。从成像偏移斜率来看,随着高度的增加,成像偏移斜率越接近于0;随着攻角的增加,成像偏移斜率在往0的负方向增大。从成像偏移斜率的角度分析,低高度和大攻角都会引起较大的成像偏移值的变化。Abstract:
Objective Driven by military applications, the new generation of precision-guided weapons continues to develop toward improved guidance and strike accuracy. Imaging deviation is an important indicator of the aero-optics effect, which portrays the deflection effect of the aero-optics flow field on light propagation. The study of the imaging deviation of aero-optics can improve the guidance and strike accuracy of aircraft and provide support for the development of high-end military equipment in China, so it is necessary to conduct an in-depth study of its related problems. Methods A typical blunt-headed vehicle was modeled and meshed using software (Fig.2) and a large number of flow field calculations were made based on the computational fluid dynamics software Fluent to obtain the flow field density around the vehicle under different operating conditions (Fig.5). The corresponding refractive index distribution was obtained by the correspondence between density and refractive index. The light transmission equation was solved using the fourth-order Runge-Kutta method, and the imaging deviation data were obtained using the inverse ray tracing method and the stopping criterion. Results and Discussions The analysis of the refractive index distribution at different altitudes in the reverse light tracing (Fig.6) shows that the refractive index increases and then decreases along the propagation path as the light enters the aerodynamic optical flow field. The light tracing starts from the starting point inside the window, and the refractive index increases and then decreases against the direction of light incidence through the non-uniform flow field and finally reaches the free flow refractive index decreases until the end of the tracing. The refractive index of the non-uniform flow field near the optical window decreases with increasing altitude, and although the refractive index distribution of the light propagation path at different altitudes has the same trend, it has a different degree of change. As the altitude increases, the refractive index distribution on the light propagation path becomes flatter and the imaging shift becomes smaller (Fig.7, Fig.9, and Fig.11). Within 0-25 km, the slope of the imaging deviation increases in the negative direction of 0 as the angle of attack increases, indicating that a larger change in angle of attack results in a larger imaging deviation. The slope of 0° angle of attack is closer to 0 for the same altitude condition, which indicates that 0° angle of attack is the least sensitive to changes in deviation values. Also as the altitude increases, the slope of the deviation at the same angle of attack gradually approaches 0 in the negative direction of 0, which also indicates that a change in lower altitude causes a larger imaging deviation (Fig.8, Fig.10, and Fig.12). Conclusions The effect of different altitudes of 0°-15° angle of attack on the aero-optical imaging deviation of the blunt-headed vehicle was investigated. The computational analysis of the imaging deviation for every 1° angle of attack in the 0°-15° range was carried out one by one. The results of the study show that as the altitude increases, the refractive index distribution of the light propagation path at different altitudes becomes flatter and the imaging deviation value becomes smaller. As the angle of attack increases, the refractive index distribution on the light propagation path becomes more uneven, and thus the imaging deviation increases. The slope of the imaging deviation approaches 0 at higher altitudes and increases in the negative direction of 0 at larger angles of attack. This indicates that the imaging deviation value will show a large variation at low altitudes and a large angle of attack. The results show that the effect of a high Mach number at 25 km on the imaging deviation is greater than that of atmospheric density, and this result is going to be analyzed in the future in a comprehensive analysis of the results of high Mach number calculations for more different operating conditions, and then to explore the influence of related factors on practical applications. The results are expected to give a reference for theoretical calculations for the integrated design of flight altitude, velocity, and imaging attitude of infrared-guided vehicles. -
Key words:
- aero-optics /
- sight error /
- angle of attack /
- imaging deviation
-
图 1 计算流体力学数值模拟流程图
Figure 1. Flowchart of numerical simulation of computational fluid dynamics
图 2 (a) 2D模型;(b) 3D模型;(c) 3D模型网格划分
Figure 2. (a) 2D model; (b) 3D model; (c) Meshing of 3D model
图 3 飞行器与目标的三维相对运动关系
Figure 3. Three-dimensional relative motion relationship between the missile and the target
图 4 不同高度飞行器头部平均流场密度分布图 (Sample 1)
Figure 4. Average flow field density distribution in the head of the vehicle at different altitudes (Sample 1)
图 5 不同高度飞行器头部平均流场密度分布图 (Sample 2)
Figure 5. Average flow field density distribution in the head of the vehicle at different altitudes (Sample 2)
图 6 不同高度的反向光线追迹折射率分布图(Sample 3)
Figure 6. Refractive index distributions of backward ray tracing at different altitudes (Sample 3)
表 1 压力、温度、密度随海拔高度的分布
Table 1. Distribution of pressure, temperature, and density with altitudes
${{Z/\rm km} }$ ${{p/\rm Pa} }$ ${{T/\rm K} }$ $\rho /{\rm{kg} }\cdot{ {\rm{m} }^{-3}}$ 0 1.01325×10⁵ 288.150 1.2250 5 5.4048×10⁴ 255.676 7.3643×10⁻¹ 10 2.6499×10⁴ 223.252 4.1351×10⁻¹ 15 1.2111×10⁴ 216.650 1.9476×10⁻¹ 20 5.5293×10³ 216.650 8.8910×10⁻² 25 2.5492×10³ 221.552 4.0084×10⁻²  下载: 导出CSV
表 2 仿真计算的飞行参数取值范围
Table 2. Range of flight parameters calculated by simulation
Flight parameters Range Interval Altitude 0-25/km 5 Mach number 0.5-3 0.5 AOA 0-15/(°) 1 LOSR angle/(°) 5 LOS angle/(°) 35
下载: 导出CSV
表 3 飞行工况
Table 3. Flight condition
Sample Altitude/
kmMach
number/MaAOA/
(°)LOSR
angle/(°)LOS
angle/(°)1 0-25 1.5 5 5 35 2 10 3 2 0 4 1.5 0-15 5 2 6 3
下载: 导出CSV
-
[1] Xing Zhan, Chen Xiaoyi, Peng Zhiyong, et al. Research progress and thinking of infrared aero-optical effect (Invited) [J]. Infrared and Laser Engineering, 2022, 51(4): 20220228. (in Chinese) doi: 10.3788/IRLA20220228 [2] Yin Xingliang. Principles of Aero-optics[M]. Beijing: China Astronautic Publishing House, 2003. (in Chinese) [3] Xu Liang, Cai Yuanli. Imaging deviation through non-uniform flow fields around high-speed flying vehicles [J]. Optik, 2012, 123(13): 1177-1182. doi: 10.1016/j.ijleo.2011.07.046 [4] Jiang Tao, Ding Mingsong, Gao Tiesuo, et al. Numerical simulation of IR seeker high-speed flow field and its influence on ray transmission [J]. Acta Optics Sinica, 2012, 32(8): 16-20. (in Chinese) [5] Jiang Tao, Ding Mingsong, Gao Tiesuo, et al. Computation and analysis of IR imaging impacted by the high-speed flow-field [J]. Acta Aerodynamica Sinica, 2013, 31(6): 727-732. (in Chinese) [6] Xu Liang, Cai Yuanli. Influence of altitude on aero-optic imaging deviation [J]. Applied Optics, 2011, 50(18): 2949-2957. doi: 10.1364/AO.50.002949 [7] Wang Naixiang, Xu Yulei, Shi Lei, et al. Analysis of the impact of windward and angle of attack to the flow field around the optical window on high Mach condition [J]. Infrared and Laser Engineering, 2015, 44(4): 1267-1272. (in Chinese) [8] Xu L, Xue D, Lv X. Computation and analysis of backward ray-tracing in aero-optics flow fields [J]. Optics Express, 2018, 26(1): 567-576. doi: 10.1364/OE.26.000567 [9] Yao Y, Xue W, Wang T, et al. Influence of LOS angle on aero-optics imaging deviation [J]. Optik, 2020, 202: 163732. doi: 10.1016/j.ijleo.2019.163732 [10] Wang H, Chen S, Du H, et al. Influence of altitude on aero-optic imaging quality degradation of the hemispherical optical dome [J]. Applied Optics, 2019, 58(2): 274-282. doi: 10.1364/AO.58.000274 [11] Chen Xi. Aero-optical imaging deviation and prediction for different line-of-sight roll angles[D]. Tianjin: Tianjin University of Technology, 2021. (in Chinese) [12] Zhang B, He L, Yi S, et al. Multi-resolution analysis of aero-optical effects in a supersonic turbulent boundary layer [J]. Applied Optics, 2021, 60(8): 2242-2251. doi: 10.1364/AO.416947 [13] Zhang Ziye. Study and prediction of 0-25 km aero-optics imaging deviation for blunt head aircraft[D]. Tianjin: Tianjin University of Technology, 2022. (in Chinese) [14] Xu Liang. Research on the aero-optical effects of an advanced infrared guided vehicle[D]. Xi’an: Xi’an Jiaotong University, 2011. (in Chinese) [15] Wang Luyang, Xu Liang, Zhao Shiwei, et al. Influence of 0°–15° attack angle on aero-optical imaging deviation of a blunt-nose vehicle [J]. Applied Optics, 2023, 62(2): 391-397. doi: 10.1364/AO.470738 [16] Xu Liang, Zhang Ziye, Chen Xi, et al. Improved sparrow search algorithm-based BP neural networks for aero-optical imaging deviation prediction [J]. Journal of Optoelectronics · Laser, 2021, 32(6): 653-658. (in Chinese) [17] Zhang Qingpeng. Study on suppression method of aero-optical effect of beam expanding system[D]. Chengdu: The Institute of Optics and Electronics, The Chinese Academy of Sciences, 2020. (in Chinese) [18] Thuerey N, Weißenow K, Prantl L, et al. Deep learning methods for reynolds-averaged Navier–stokes simulations of airfoil flows [J]. AIAA Journal, 2020, 58(1): 25-36. doi: 10.2514/1.J058291 [19] Ding Haolin, Yi Shihe, Zhao Xinhai. Experimental investigation of aero-optics induced by supersonic film based on near-field background-oriented schlieren [J]. Applied Optics, 2019, 58(11): 2948-2962. doi: 10.1364/AO.58.002948 [20] Sun Xiangyu. Integrated design method of guidance and control for hypersonic vehicles[D]. Harbin: Harbin Institute of Technology, 2017. (in Chinese) -

 点击查看大图

计量
- 文章访问数: 158
- HTML全文浏览量: 49
- PDF下载量: 28
- 被引次数: 0


