


-
探测距离是红外系统应用的重要评价指标。红外系统探测距离的主要影响因素有探测器性能,杂散辐射以及目标背景限制影响等。杂散辐射作为主要影响因素之一,会增大系统噪声、降低探测能力[1]。
杂散辐射按照来源分类可分为外部杂散辐射和内部杂散辐射[2-3]。外部杂散辐射是指视场外部辐射经过反射,透射和散射等方式传输到探测器焦平面上的辐射能量;内部杂散辐射又称为自身热辐射,是指光学系统内部器件产生的红外辐射经传输到达探测器焦平面的辐射能量[4]。外部杂散光可通过设置遮光罩或者挡光环等装置进行有效抑制[5],自身热辐射的影响逐渐凸显,冷光学设计是对自身热辐射抑制的有效手段。
目前对自身热辐射研究的主要方向有:进行光学系统自身热辐射的抑制,实现系统结构优化或达到系统工作要求的目的[1, 6-12];分析不同的环境对光学系统内部杂散辐射的影响,提出新的测量方法或对相应的测量方法进行改进[4, 13-16]。对探测能力的研究则多集中在指定背景环境或目标下的探测能力分析和对现有探测能力计算模型进行改进,对系统探测能力分析时总是在焦平面整体或者中心区域讨论[17-22]。也有学者讨论了光学系统内部杂散辐射对探测性能的影响[23],分析了不同温度下自身热辐射对探测能力影响以及图像非均匀性情况。现有对探测距离计算是将探测器焦平面视为整体或提取中心区域,对自身热辐射和背景辐射等影响因素进行平均计算,输入目标参数得到探测距离数据,考虑自身热辐射对焦平面的整体影响进行系统冷光学设计。当目标成像在不同的焦平面区域时,通过上述方式计算得到的探测距离数据不够精确,进行冷光学设计时针对性不强。
针对上述问题,文中建立包含系统噪声项的探测距离计算公式,提出分布式探测距离的分析方法,并通过某透射式红外光学系统进行验证。
-
对于光机系统自身热辐射的研究是以辐射学作为理论基础。光机系统各部分的自身热辐射满足普朗克辐射定律[23-24]:
$$ M = \varepsilon \int_{{\lambda _b}}^{{\lambda _a}} {\frac{{{c_1}}}{{{\lambda ^5}}}} \frac{1}{{\exp [({c_2}/\lambda T) - 1]}}{\rm{d}}\lambda $$ (1) 式中:
$ {\lambda _a} $ ,$ {\lambda _b} $ 为探测器相应波段范围;${c_1}$ 为第一辐射常数$3.741\;8 \times {10^{ - 16}} \;{\rm{W }}\cdot {{\rm{m}}^{ - 2}}$ ;${c_2}$ 为第二辐射常数$1.438\;8 \times {10^{ - 12}}\;{\rm{mK}}$ ;$ \varepsilon $ 为光学元件或机械构件的发射率;T为光学元件或机械构件的温度。光机系统的自身热辐射直接影响到系统噪声项[25],光学背景噪声
$ {n_t} $ 和探测器的空间噪声$ {n_s} $ 如下所示:$$ {n_t} = \sqrt {\eta \cdot {A_d} \cdot {t_{{int} }} \cdot {E_{opt}}} $$ (2) $$ {n_s} = RNU \cdot \eta \cdot {A_d} \cdot {t_{{int} }} \cdot {E_{opt}} $$ (3) 式中:
$ {A_d} $ 为探测器焦平面像元面积;$ \eta $ 为探测器量子效率;$ {t_{{int} }} $ 为积分时间;RNU为探测器焦平面的残余非均匀性,其定义为校正和图像处理后的像元增益的标准差(百分比);$ {E_{opt}} $ 为光机系统自身热辐射到达焦平面的辐照度,是光机系统各部分自身热辐射到达探测器焦平面辐照度之和,则:$$ {E_{opt}} = {E_1} + {E_2} + {E_3} + \cdots + {E_n} $$ (4) 红外系统总噪声为:
$$ \bar n = \sqrt {n_t^2 + n_s^2 + n_r^2} $$ (5) 式中:
$ {n_r} $ 为探测器读出噪声,不受光机系统自身热辐射影响,在文中所指的分析过程中可不予考虑。与探测器噪声直接相关的探测能力指标为噪声等效通量密度(Noise equivalent flux density, NEFD):$$ NEFD = \frac{{hc}}{{{\lambda _{BB}}}}\frac{{\bar n}}{{\eta \cdot {A_{opt}} \cdot {t_{{int} }} \cdot {\tau _{opt}} \cdot EOD \cdot {\eta _e}}} $$ (6) 式中:
$ {\lambda _{BB}} $ 为目标黑体等效波长(单位:m);$ {A_{opt}} $ 为相机通光孔径面积;$ {\eta _e} $ 为考虑振动等因素的过程因子;$ EOD $ 为艾里斑能量分布(不考虑时为1);h为普朗克常数;c为光速。噪声等效通量密度和噪声等效功率(Noise equivalent power, NEP)之间的关系可表示为:
$$ NEP = NEFD \cdot {A_{opt}} = \frac{{hc}}{{{\lambda _{BB}}}}\frac{{\bar n}}{{\eta \cdot {t_{{int} }} \cdot {\tau _{opt}} \cdot EOD \cdot {\eta _e}}} $$ (7) 归一化探测率(
$ {D^*} $ )作为系统探测能力的重要指标,与探测距离(R),噪声等效温差(Noise equivalent temperature difference, NETD)等系统指标之间具有直接关系,其与噪声等效功率之间的关系:$$ {D^*} = \frac{{\sqrt {{A_d} \cdot \Delta f} }}{{NEP}} $$ (8) 式中:
$ \Delta f $ 为噪声等效带宽;$ {A_d} $ 为探测器像元面积。将公式(7)代入公式(8),进一步可得到:$$ {D^*} = \frac{{\sqrt {{A_d} \cdot \Delta f} \cdot {\lambda _{BB}} \cdot \eta \cdot {t_{{int} }} \cdot {\tau _{opt}} \cdot EOD \cdot {\eta _e}}}{{h \cdot c \cdot \bar n}} $$ (9) 红外系统的探测距离是指系统可探测目标的极限距离,其一般方程是由R. D小哈得逊给出的[19]:
$$ R = \sqrt {\frac{{\pi \cdot {D_0} \cdot {D^*} \cdot J \cdot {\tau _a} \cdot {\tau _{opt}} \cdot NA}}{{2 \cdot N \cdot \sqrt {\omega \cdot \Delta f} \cdot SNR}}} $$ (10) 式中:
$ {D_0} $ 为通光口径;J为目标辐射强度;$ {\tau _a} $ 为大气透过率;$ \omega = {A_d}/{f^2} $ 为探测器单个像元对应的瞬时视场;SNR为探测器信号处理信噪比最低要求;NA为系统的数值孔径;$ f $ 为光机系统有效焦距;N为目标所占像元数。将公式(9)代入公式(10)中,
$ NA = {D_0}/2 f $ ,得到探测距离方程为:$$ R = \sqrt {\frac{{\pi \cdot D_0^2 \cdot {\tau _a} \cdot \tau _{opt}^2 \cdot {\lambda _{BB}} \cdot \eta \cdot {t_{{int} }} \cdot J \cdot EOD \cdot {\eta _e}}}{{4 \cdot N \cdot SNR \cdot h \cdot c \cdot \bar n}}} $$ (11) 在不考虑目标弥散,目标为理想点目标,信噪比假设为定值,只考虑自身热辐射影响的情况下,由公式(2)、(3)、(5)可知,系统总噪声与自身热辐射到达焦平面的辐照度
$ {E_{opt}} $ 直接相关。故在上述条件下,公式(11)可表示为自身热辐射到达焦平面的辐照度与探测距离的之间的关系。 -
在进行自身热辐射分析时,可以发现到自身热辐射所产生的辐照度在焦平面上的分布呈现不均匀性。进一步通过探测距离公式(11)可知,当目标成像在焦平面不同区域时,由于自身热辐射到达焦平面辐照度分布的不均匀性,探测距离会随着目标成像区域不同而改变,这种在焦平面上呈现区域分布的探测距离称为分布式探测距离。为对分布式探测距离进行分析和对目标区域的冷光学设计提供指导,通过理论计算和模拟仿真相结合,得到了对分布式探测距离的分析方法,如图1所示,具体分析过程如下:
首先建立光机系统模型,然后设置系统表面参数,最后建立主要表面辐射源,进行光线追迹过程,得到系统焦平面的辐照度数据;其次,通过理论推导过程建立的探测距离计算模型,在确定目标以及相关参数以后,最后进行整体焦平面辐照度及探测距离分析。
图 1 分布式探测距离分析方法
Figure 1. Distributed detection range analysis method
进一步对分布式探测距离分析,需将焦平面辐照度数据进行分区处理。进行分区数据提取时,需考虑分区的原则。表1给出了影响分区原则的主要因素,针对不同的分析环境,需考虑不同的主要影响因素,保证探测距离取值的合理性,进而确定分区原则。
表 1 影响分区原则的主要因素
Table 1. Main factors affecting the zoning principle
Zoning principle main influencing factors Irradiance distribution Irradiance density Irradiance intensity System noise Target temperature Target dispersion size 在只考虑自身热辐射影响的前提下,会有像元接收到的辐照度为0的情况。不考虑读出噪声、确定目标参数的情况下,由探测距离公式(11)可知,系统总噪声
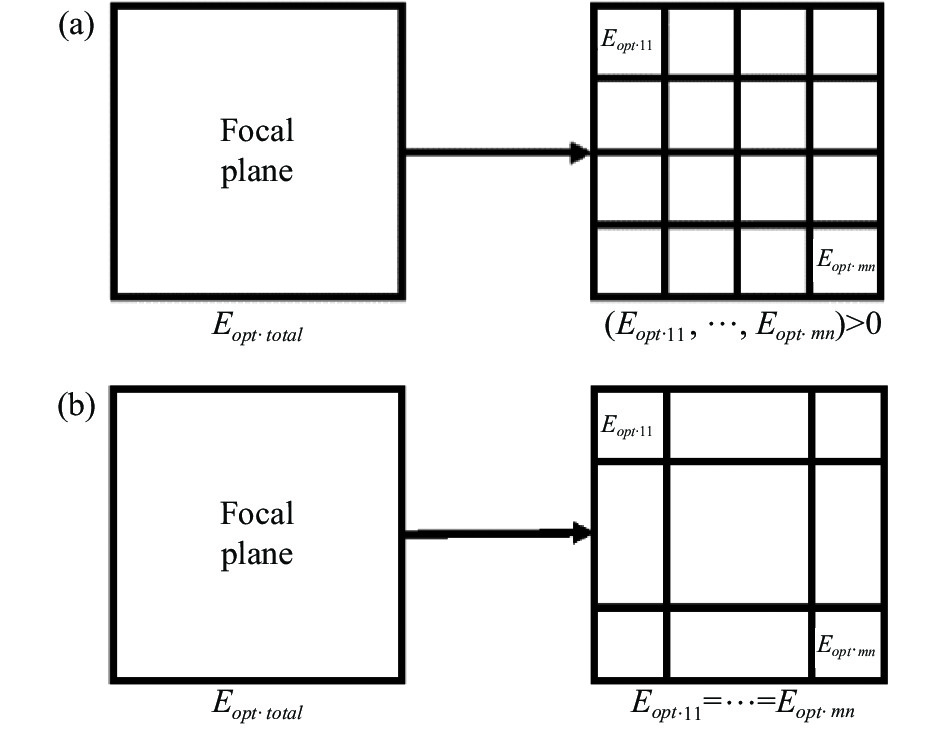
$ \bar n $ 不能为0。因此从辐照强度出发,可进行所接收的辐照度大于0的均匀分区和所接收的辐照度相同的不均匀分区,如图2所示。
图 2 (a) 各区域所接受辐照度大于0的均匀分区;(b) 各区域所接收辐照度相同的不均匀分区
Figure 2. (a) Uniform partitions with irradiance greater than 0 in each region; (b) Nonuniform partitions with the same irradiance in each region
进行不均匀分区时,在不同大小的区域上辐照度相同,所以在进行分布式探测距离分析时没有意义;同时当成像在某一较大区域时,所得的探测距离数据也不够准确。进行均匀分区时,可以得到的各区域辐照度不为0的最小分区,进行分布式探测距离计算时结果更可靠。由此得出对探测器焦平面的分区原则为:在不同的系统工作温度下,当前区域所接收的辐照度大于0的均匀分区。
在进行对焦平面的分区处理后,对分布式探测距离进行分区讨论,分区讨论的思路为:从焦平面辐照度出发,将进行焦平面分区后得到每个区域上的辐照度
$ {E_{opt}} $ ,代入光学背景噪声公式(2)和探测器空间噪声公式(3)中,将公式(5)代入系统总噪声$ \bar n $ 中,通过探测距离公式(11)得到焦平面的分布式探测距离,表示为:$$\begin{split} \left[ {{E_{opt\cdot total}}} \right] \to \left[ {\begin{array}{*{20}{c}} {E_{opt \cdot 11 }}& \cdots &{{E_{{opt \cdot 1n}}}} \\ \vdots & \ddots & \vdots \\ {{E_{{opt \cdot m1}}}}& \cdots &{{E_{{opt\cdot mn}}}} &\end{array}} \right] \to \\ \left[ {\begin{array}{*{20}{c}} {{{\overline n }_{11}}}& \cdots &{{{\overline n }_{1n}}} \\ \vdots & \ddots & \vdots \\ {{{\overline n }_{m1}}}& \cdots &{{{\overline n }_{mn}}} \end{array}} \right] \to \left[ {\begin{array}{*{20}{c}} {{R_{11}}}& \cdots &{{R_{1n}}} \\ \vdots & \ddots & \vdots \\ {{R_{m1}}}& \cdots &{{R_{mn}}} \end{array}} \right] \end{split}$$ (12) 由于
$ {E_{opt}}$ 通过系统总噪声可以直接影响探测距离大小,因此在进行分区处理后,对不同温度下对系统组件的表面光源在焦平面不同区域的辐射量进行统计,分析各组件表面的影响比重,可得到区域内对探测距离变化的主要影响表面。将主要影响表面制冷前后的辐照度
$ {E_{opt}} $ 通过公式(2)、(3)、(5)代入系统总噪声$ \bar n $ 中,确定目标的辐射强度J和其他参数,然后代入公式(11)中,分析出制冷前后主要影响表面对目标区域探测距离的影响,进而为系统冷光学设计提供针对性指导。为验证该方法的可行性,下面将按照该分析方法对具体的红外光学系统进行分析。
-
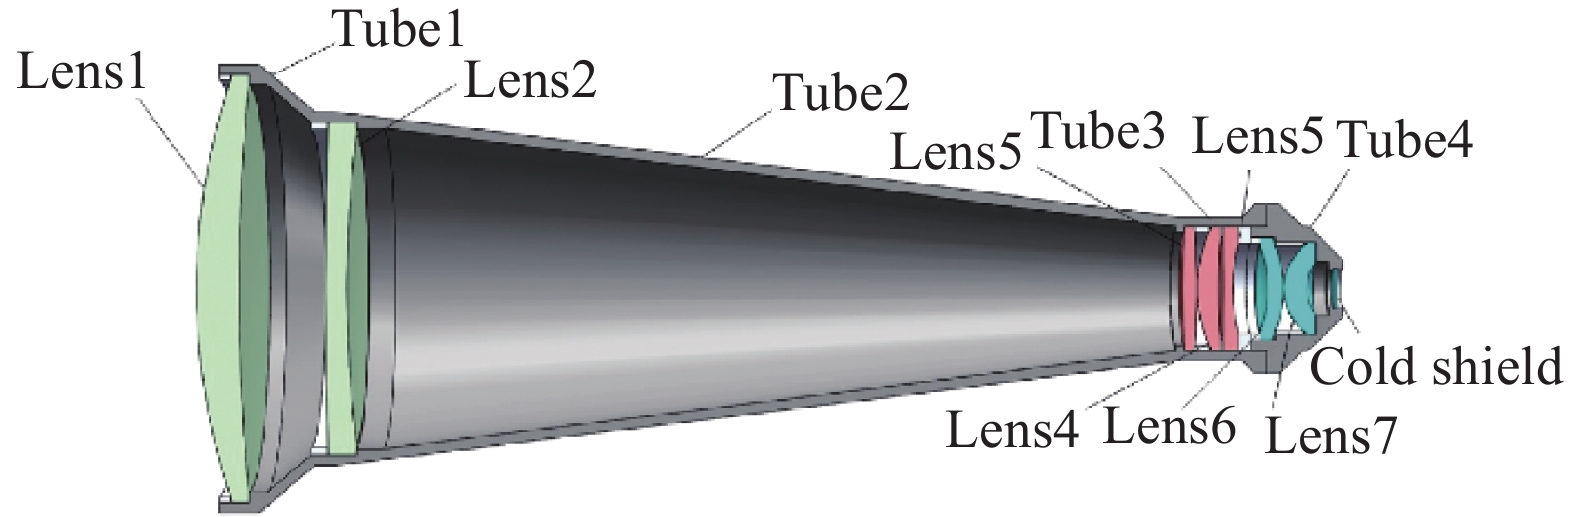
选择如图3所示的中波红外系统作为分析对象,基本参数为:成像谱段为3.7~4.8 μm,焦距
$ f = 400 \;{\rm{mm}} $ ,F数为2,视场角$ 2\theta = 1.44^\circ $ ,焦平面规模为$ 640 \times 512 $ ,像元尺寸为30 μm。
图 3 红外光学系统结构图
Figure 3. Structure diagram of infrared optical system
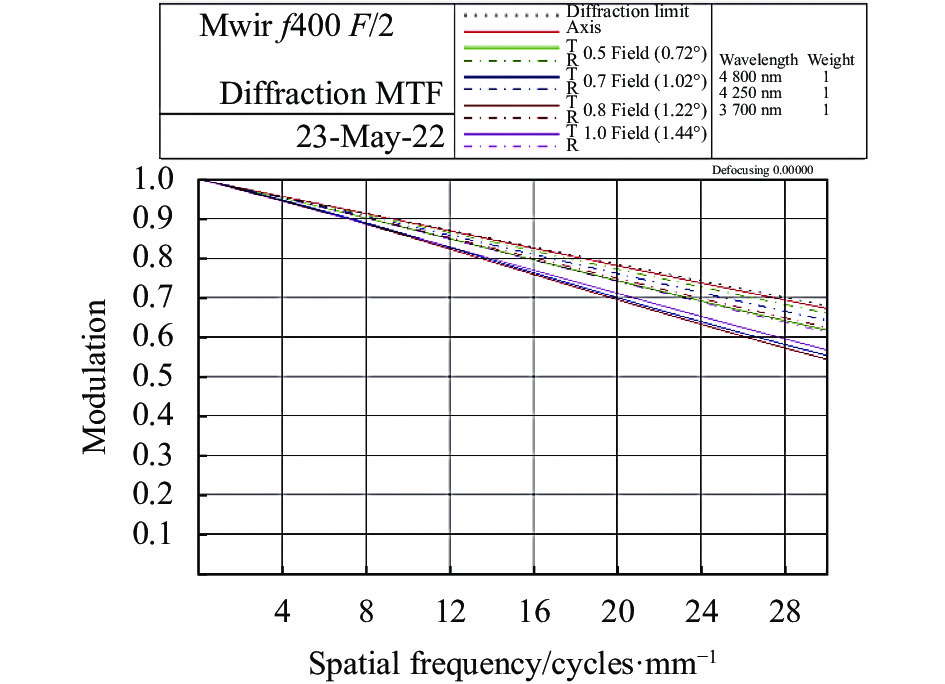
图4给出了系统的MTF曲线图,在空间频率为30 lp/mm时,各个视场的MTF均大于0.5,且靠近光学衍射极限,满足系统成像质量的要求。

图 4 红外光学系统MTF曲线图
Figure 4. MTF curve of infrared optical system
-
建立如图5所示的光机结构模型,将红外光机结构模型导入到FRED软件中,该软件在分析杂散辐射时能建构任何复杂结构分析,在进行系统表面辐射源设置后,进行蒙特卡洛光线追迹即可得到探测器焦平面的辐照度。

图 5 红外光机系统结构示意图
Figure 5. Structure diagram of infrared optomechanical system
因冷光阑后的系统始终处于低温状态,故此部分系统不做讨论。各透镜表面透过率设置为1,镜筒涂层设置为反射率为0.1,透过率为0。各表面光源设置为:温度以10 K为梯度,温度范围控制在当前红外系统常用工作温度范围223.15~313.15 K,通过普朗克辐射定律结合主要表面面积计算相应表面的辐射功率。只从系统软件仿真的角度出发,不进行实际测量,将系统的机械构件表面散射特性设置为朗伯散射,光学元件表面辐射特性设置为Harvey-Shack散射,进行光线追迹得到不同温度下的焦平面辐照度数据,将得到焦平面辐照度数据导入系统总噪声中。
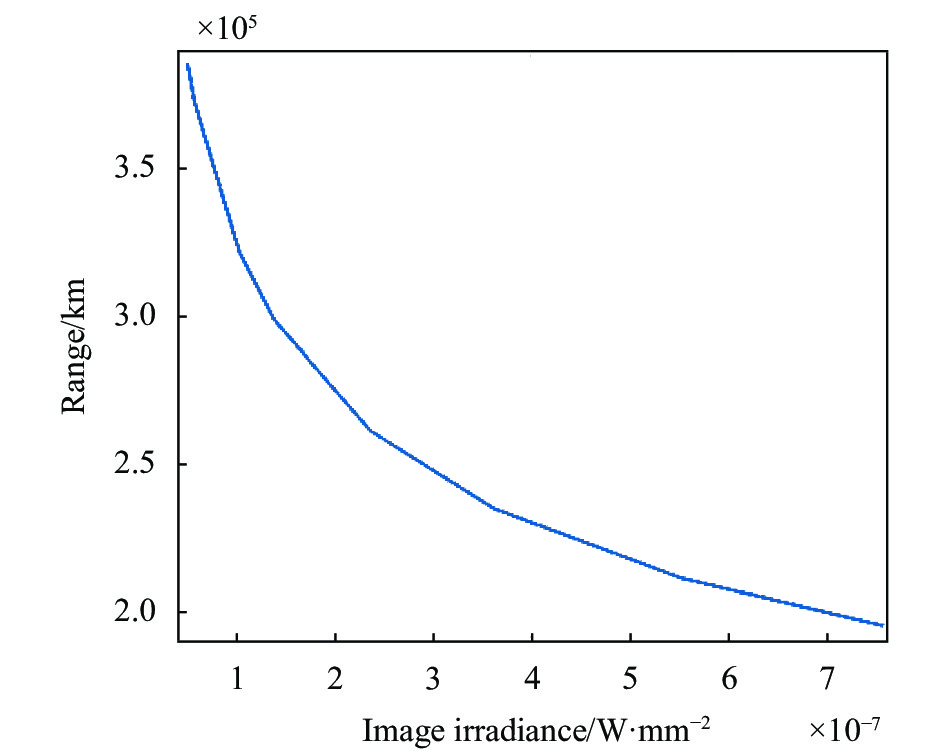
只考虑光机系统自身热辐射影响,目标为理想点目标,温度设置为500 K,探测目标所占像元数N设置为3,不考虑目标的弥散现象,EOD为1。大气透过率为0.8,探测器信号处理信噪比最低要求SNR为6,RNU设置为10%,量子效率
$ \eta $ 为0.8,过程因子$ {\eta _e} $ 为0.8。将上述参数和得到的系统总噪声数据代入探测距离公式(11)中,得到探测距离随探测器焦平面辐照度的变化趋势,如图6所示,可见随着自发热辐射降低,探测距离也随之升高。

图 6 探测距离随像面辐照度变化
Figure 6. Variation of detection distance with image surface irradiance
进一步对分区域辐照度进行分析,系统工作温度在233.15~313.15 K下,只考虑自身热辐射对焦平面辐照度分布的影响,通过实际焦平面辐照度分布数据,根据所确定的焦平面分区原则:在不同的系统工作温度下,当前区域所接收的辐照度大于0的均匀分区。根据分区原则,在焦平面分区为
$ 10 \times 8 $ 个区域时,仍然会有接收到的辐照度为0的区域,不符合分区要求,没有分析价值。因此将焦平面整体分为$ 5 \times 4 $ 个区域,每个区域由$ 128 \times 128 $ 个像元组成,进行分区域辐照度处理,得到探测器焦平面辐照度分区域分布柱状图,如图7所示。图中,工作温度在293.15 K下探测器焦平面辐照度分区域分布,观察到辐照度数据最大在(1,2)区域,最小在(5,1)区域。在不同温度下,进一步统计出不同区域的辐照度占比,如表2所示。通过对各温度下对不同区域的辐照度占比求取平均值,在(1,1)、(3,1)和(2,2)区域上的平均辐照度占比最大,(3,4)、(5,1)、(5,4)区域上的平均辐照度占比最小,在(2,2)~(4,3)区域内,平均辐照度占比为0.06993,其他区域的平均辐照度占比为0.04234,虽然某一周边区域的辐照度占比突出,但在总体上中心区域的辐照度占比高于周边区域。
图 7 293.15 K时探测器焦平面辐照度分区域分布图
Figure 7. Regional distribution map of detector focal plane irradiance at 293.15 K
表 2 探测器焦平面不同区域辐照度占比
Table 2. Proportion of irradiance in different regions of the detector focal plane
Operating temperature/K 233.15 243.15 253.15 263.15 273.15 283.15 293.15 303.15 313.15 (1,1) 0.0873 0.0673 0.0745 0.0998 0.1079 0.0853 0.0539 0.0432 0.0372 (1,2) 0.0346 0.0186 0.0212 0.0280 0.0543 0.0434 0.1226 0.1054 0.0900 (1,3) 0.0674 0.0476 0.0494 0.0430 0.0452 0.0320 0.0264 0.0448 0.0159 (1,4) 0.0149 0.0228 0.0463 0.0314 0.0401 0.0416 0.0357 0.1273 0.0995 (2,1) 0.0734 0.1502 0.0562 0.0353 0.0323 0.0888 0.0612 0.0605 0.0312 (2,2) 0.3846 0.2475 0.2854 0.2743 0.1802 0.1374 0.1051 0.0230 0.0470 (2,3) 0.0004 0.0195 0.0263 0.0382 0.0356 0.0917 0.0755 0.0684 0.0859 (2,4) 0.0530 0.1354 0.0371 0.0256 0.0352 0.0444 0.0362 0.0615 0.0364 (3,1) 0.0534 0.0340 0.0445 0.0381 0.0284 0.0260 0.0607 0.0444 0.0407 (3,2) 0.0053 0.0118 0.0226 0.0164 0.0365 0.0347 0.0360 0.0423 0.0376 (3,3) 0.0369 0.0778 0.0967 0.1215 0.1081 0.0880 0.0768 0.0499 0.0473 (3,4) 0.0207 0.0145 0.0343 0.0253 0.0246 0.0187 0.0113 0.0185 0.0266 (4,1) 0.0005 0.0070 0.0239 0.0231 0.0452 0.0614 0.0648 0.0812 0.1189 (4,2) 0.0609 0.0610 0.0623 0.0338 0.0257 0.0224 0.0348 0.0292 0.0268 (4,3) 0.0507 0.0309 0.0472 0.0324 0.0442 0.0354 0.0278 0.0312 0.0473 (4,4) 0.0018 0.0194 0.0207 0.0243 0.0256 0.0344 0.0338 0.0291 0.0464 (5,1) 0.0007 0.0008 0.0070 0.0051 0.0102 0.0078 0.0100 0.0157 0.0434 (5,2) 0.0029 0.0015 0.0026 0.0423 0.0497 0.0443 0.0476 0.0523 0.0467 (5,3) 0.0465 0.0296 0.0364 0.0298 0.0363 0.0329 0.0531 0.0477 0.0492 (5,4) 0.0042 0.0029 0.0054 0.0322 0.0346 0.0294 0.0268 0.0246 0.0260 接下来将工作温度在293.15 K的分区域辐照度数据导入系统总噪声,保持其他参数不变,代入探测距离公式(10)中,得到工作温度在293.15 K时的分布式探测距离,如图8所示。由于在焦平面不同区域上的辐照度各不相同,探测距离在各区域上也各有不同。在(5,1)区域的探测距离数值最大,在(1,2)区域的探测距离数据最小,其与图7中的辐照度分布成对应关系。

图 8 293.15 K时的分布式探测距离
Figure 8. Distributed detection distance at 293.15 K
将在不同温度下,不同组件自身热辐射到达焦平面的辐照度数据进行分区域处理,统计各组件自发热辐射在不同区域上的辐射量,并计算对不同区域的影响权重。将不同温度下各组件自身热辐射对不同区域的影响权重进行求和,得到各组件自身热辐射对不同区域影响权重的统计结果,如表3所示。
总体上,影响区域最多的是透镜3、透镜5、透镜7、透镜4、镜筒4和镜筒2,且只对周围区域产生影响。对于不同的焦平面区域,主要影响表面各有不同,根据不同温度下各组件对各个区域影响权重的统计结果,得到不同焦平面区域的主要影响表面统计结果,如图9所示。
表 3 各组件自身热辐射对不同区域影响权重的统计结果
Table 3. Statistical results of the influence weight of each component's own thermal radiation on different region
Lens1
surfaceLens2
surfaceLens3
surfaceLens4
surfaceLens5
surfaceLens6
surfaceLens7
surfaceTube2
surfaceTube3
surfaceTube4
surface(1,1) 0.0109 0.4563 0.5829 0.2884 0.2153 0.4592 0.3810 2.8478 0.0188 3.7397 (1,2) 0.0798 0.9770 0.0415 3.8861 0.7863 0.1520 0.9954 0.9895 1.0781 0.0143 (1,3) 0.0630 0.0507 0.3153 0.3776 0.0710 1.1261 2.5766 0.0587 4.2337 0.1275 (1,4) 1.1484 0.0005 0.7566 0.7554 1.4393 1.5327 3.2829 0.0010 0.0004 0.0829 (2,1) 0.4740 0.0060 5.6941 0.5965 0.5211 0.0018 0.6339 0.1194 0.0024 0.9508 (2,2) 5.8813 0.0063 0.0059 0.5306 0.5377 0.9215 0.6269 0.0474 0.1718 0.2708 (2,3) 0.0631 2.2268 3.9299 0.3563 0.5734 0.0595 1.5599 0.0389 0.0077 0.1845 (2,4) 0.0278 0.0664 0.0072 2.2697 3.9957 0.0052 1.8296 0.0466 0.7069 0.0447 (3,1) 0.0111 0.0000 2.1920 0.5886 1.6966 0.0011 0.6582 3.1848 0.0007 0.6668 (3,2) 0.0274 0.0024 0.8975 0.9569 1.0695 0.6771 3.5116 0.0000 1.8523 0.0054 (3,3) 0.0396 0.1057 0.8885 0.0481 0.6657 4.1218 0.3969 0.3068 0.0089 2.4179 (3,4) 0.0470 0.0112 0.1566 3.0758 0.4770 2.9292 1.5795 0.6474 0.0504 0.0259 (4,1) 1.3208 0.0000 0.3538 2.2130 2.4022 0.9429 1.4545 0.0008 0.0011 0.3109 (4,2) 0.0055 0.0055 0.0167 1.0900 1.6308 0.0025 3.4895 0.0000 2.2563 0.5032 (4,3) 0.0355 0.0974 0.0658 2.8746 3.4224 0.0394 1.0559 1.3683 0.0005 0.0402 (4,4) 0.0869 0.1025 4.1475 0.1444 1.3028 0.5009 2.1155 0.0000 0.3436 0.2559 (5,1) 0.5844 0.0504 0.1219 1.8478 1.8203 0.2928 3.7681 0.0000 0.3663 0.1481 (5,2) 0.5876 0.0001 0.0421 0.8498 1.3815 0.5515 2.9160 0.0000 2.6658 0.0056 (5,3) 0.0105 0.0002 2.2807 0.7391 1.7332 0.0764 0.5562 3.0692 0.3640 0.1705 (5,4) 0.0839 0.2977 2.8863 0.3245 0.3405 0.0060 4.2691 0.7484 0.0058 0.0377 
图 9 不同区域对应的主要影响表面
Figure 9. Main influence surfaces corresponding to different regions
-
将主要影响表面中的透镜7和透镜3做低温处理,表面温度设置为173.15 K,其他组件表面温度均保持在293.15 K,系统其他参数设置不变,进行光线追迹。保持探测目标参数和其他参数不变,将追迹得到的辐照度分布结果通过系统总噪声导入探测距离方程,并与在整体工作温度为293.15 K下所得各区域探测距离进行对比。图10和图11中白色为对透镜7,透镜3低温处理后的焦平面各区域探测距离,黑色为整体工作温度为293.15 K下焦平面各区域的探测距离。
图 10 透镜7低温处理前后各区域探测距离对照图
Figure 10. Comparison of detection distances in each area before and after low temperature treatment of lens7

图 11 透镜3低温处理前后各区域探测距离对照图
Figure 11. Comparison of detection distances of each area before and after low temperature treatment of lens3
在对相应组件表面进行低温处理后,从图10和图11可以看出,针对成像在不同焦平面区域的目标探测距离数据都有所提高,特别是透镜7和透镜3所对应的主要影响区域,提升效果更加明显。其中透镜7的主要影响焦平面区域探测距离提升1.76%~17.03%,(4,2)区域提升最明显;透镜3的主要影响焦平面区域探测距离提升7.41%~43.32%,(2,1)区域提升最明显。可观察到在(5,4)区域上,透镜3低温处理后对探测距离提升17.01%,透镜7低温处理对探测距离提升13.99%,透镜3优于透镜7的低温处理结果。因对于不同区域的主要影响表面为统计结果,所以会出现类似情况,但其对主要区域的探测距离影响仍占据重要比重。因此可通过对主要影响表面制冷来达到探测距离提升的目的,在进行红外冷光学设计时更具有针对性。
-
基于自身热辐射和经典探测距离理论,得到了红外光机系统噪声项直接相关的探测距离公式,提出了分布式探测距离的分析方法,给出了在只考虑自身热辐射影响下的焦平面分区原则,并用该方法对某透射式红外光学系统进行分析。
在只考虑自身热辐射影响,目标为理想点目标的前提下,给出了探测距离随着像面辐照度的变化趋势,然后对探测器焦平面进行区域划分,得到不同区域的辐照度占比数据。通过不同组件表面光源在不同焦平面区域产生的辐射量,统计各组件自身热辐射对不同区域影响权重,得到了各个区域的主要影响表面。在此基础上分别对其中的透镜7和透镜3进行低温处理(293.15 K制冷到173.15 K),对其主要影响区域的探测距离最大提升量为17.03%和43.32%,提升效果明显。通过实例验证可见,在根据分析环境和分析条件确定相应的分区原则后,所提出的分布式探测距离分析方法可成为对分布式探测距离计算和红外系统冷光学指标设计的依据。
文中在不考虑其他因素,目标为理想点目标,只考虑自身热辐射影响的前提下,以区域内的辐照度数据大于0作为分区原则,进行了分布式探测距离变化分析,具有一定的局限性。如何在考虑外部杂散辐射,背景影响和目标成像的弥散现象之后进行合理的焦平面分区,以及相应的探测距离计算模型改进,还需进一步讨论。
Analysis of distributed detection range changes caused by infrared system self-thermal radiation
-
摘要: 探测距离是红外系统应用的重要评价指标,随着制冷型红外探测器的发展,红外系统自身热辐射已成为探测距离提升的重要限制性因素,冷光学设计是抑制自身热辐射的必然选择,因此对冷光学制冷温度指标进行评估和优化成为红外系统设计分析的新问题。文中从红外系统自身热辐射和经典探测距离理论出发,推导了包含系统噪声项的红外系统探测距离计算公式,提出了分布式探测距离的分析方法。以透射式光学系统为例,进行了影响因素灵敏度分析。通过对探测器焦平面进行分区域数据处理,得到了对应探测距离的主要影响表面。在此基础上,分析了在对主要影响表面进行低温处理前后(293.15 K制冷到173.15 K)探测距离的变化。结果表明,探测距离最大提升量达到43.32%,提升效果显著。该方法可为红外系统冷光学设计和评估提供参考。Abstract:
Objective Detection range is an important evaluation index of infrared system application. Stray radiation is the main factor limiting the detection distance of infrared system, and the irradiance generated by it shows uneven distribution on the focal plane. Currently, the focal plane of the detector is regarded as a whole or the central region is extracted, and the influence factors such as self-thermal radiation and background radiation are calculated on average. The detection distance is obtained by inputting target parameters, and the overall influence of self-thermal radiation on the focal plane is considered in the cold optical design of the system. When the target imaging is in different focal plane regions, the detection range calculated by the above method is not accurate enough, and the pertinence is not strong in cold optical design. To solve the above problems, a detection range calculation formula including the system noise term is established, and a distributed detection distance analysis method is proposed, which is verified by a transmitted infrared optical system. Methods Based on the self-thermal radiation and the classical detection range theory, this paper deduces the calculation formula of the detection range of the infrared system including the system noise term, and proposes an analysis method of the distributed detection range. Taking the transmitted optical system as an example, the sensitivity analysis of the influencing factors is carried out. By sub-regional data processing on the detector focal plane, the main influence surfaces corresponding to the detection range are obtained. On this basis, the change of the detection range before and after the low temperature treatment of the main affected surface (cooling from 293.15 K to 173.15 K) was analyzed (Fig.10, 11). Results and Discussions Based on the theory of self-thermal radiation and classical detection range theory, a calculation model of detection ability including its own thermal radiation noise is given, and a direct theoretical calculation relationship is established for the influence of the self-thermal radiation on detection ability. When the target imaging is in different focal plane regions, the detection range obtained through traditional calculation is not accurate enough and the pertinence is not strong in cold optical design, and the distributed detection range analysis method is proposed (Fig.1). Under the condition of only considering its self-thermal radiation, a simple partitioning principle is discussed (Fig.2). Taking the transmitted optical system as an example, the main influence surfaces in each area of the focal plane are obtained (Fig.9) through the statistical results of the influence weights of each component's own thermal radiation in different areas (Tab.3). The detection distance of the corresponding main influence region is significantly improved (Fig.10, 11), providing a new idea for the calculation of target detection range. Conclusions Based on the theory of self-thermal radiation and classical detection range theory, the detection range formula directly related to the noise item of infrared optical machine system is obtained, the analysis method of distributed detection distance is proposed, and the principle of focal plane partitioning under the influence of self-heat radiation is given, and a transmitted infrared optical system is analyzed with this method. Under the premise that only the influence of self-thermal radiation is considered and the target is an ideal point target, the variation trend of detection distance along with the irradiance of image plane is given. Then, the focal plane of detector is divided into regions to obtain the irradiance ratio of different regions. Through the radiation amount generated by the surface light source of different components in different focal plane areas, the influence weight of each component self-thermal radiation in different areas was calculated, and the main influence surface of each area was obtained. On this basis, lens 7 and lens 3 were respectively treated with low temperature (293.15 K cooling to 173.15 K), and the maximum increase of detection distance in the main affected areas was 17.03% and 43.32%, with obvious improvement. It can be seen through the example verification that the proposed distributed detection range analysis method can be used as the basis for the calculation of distributed detection range and the design of cold optical index of infrared system after determining the corresponding partition principle according to the analysis environment and analysis conditions. -
图 2 (a) 各区域所接受辐照度大于0的均匀分区;(b) 各区域所接收辐照度相同的不均匀分区
Figure 2. (a) Uniform partitions with irradiance greater than 0 in each region; (b) Nonuniform partitions with the same irradiance in each region
图 6 探测距离随像面辐照度变化
Figure 6. Variation of detection distance with image surface irradiance
图 7 293.15 K时探测器焦平面辐照度分区域分布图
Figure 7. Regional distribution map of detector focal plane irradiance at 293.15 K
图 9 不同区域对应的主要影响表面
Figure 9. Main influence surfaces corresponding to different regions
图 10 透镜7低温处理前后各区域探测距离对照图
Figure 10. Comparison of detection distances in each area before and after low temperature treatment of lens7
图 11 透镜3低温处理前后各区域探测距离对照图
Figure 11. Comparison of detection distances of each area before and after low temperature treatment of lens3
表 1 影响分区原则的主要因素
Table 1. Main factors affecting the zoning principle
Zoning principle main influencing factors Irradiance distribution Irradiance density Irradiance intensity System noise Target temperature Target dispersion size  下载: 导出CSV
表 2 探测器焦平面不同区域辐照度占比
Table 2. Proportion of irradiance in different regions of the detector focal plane
Operating temperature/K 233.15 243.15 253.15 263.15 273.15 283.15 293.15 303.15 313.15 (1,1) 0.0873 0.0673 0.0745 0.0998 0.1079 0.0853 0.0539 0.0432 0.0372 (1,2) 0.0346 0.0186 0.0212 0.0280 0.0543 0.0434 0.1226 0.1054 0.0900 (1,3) 0.0674 0.0476 0.0494 0.0430 0.0452 0.0320 0.0264 0.0448 0.0159 (1,4) 0.0149 0.0228 0.0463 0.0314 0.0401 0.0416 0.0357 0.1273 0.0995 (2,1) 0.0734 0.1502 0.0562 0.0353 0.0323 0.0888 0.0612 0.0605 0.0312 (2,2) 0.3846 0.2475 0.2854 0.2743 0.1802 0.1374 0.1051 0.0230 0.0470 (2,3) 0.0004 0.0195 0.0263 0.0382 0.0356 0.0917 0.0755 0.0684 0.0859 (2,4) 0.0530 0.1354 0.0371 0.0256 0.0352 0.0444 0.0362 0.0615 0.0364 (3,1) 0.0534 0.0340 0.0445 0.0381 0.0284 0.0260 0.0607 0.0444 0.0407 (3,2) 0.0053 0.0118 0.0226 0.0164 0.0365 0.0347 0.0360 0.0423 0.0376 (3,3) 0.0369 0.0778 0.0967 0.1215 0.1081 0.0880 0.0768 0.0499 0.0473 (3,4) 0.0207 0.0145 0.0343 0.0253 0.0246 0.0187 0.0113 0.0185 0.0266 (4,1) 0.0005 0.0070 0.0239 0.0231 0.0452 0.0614 0.0648 0.0812 0.1189 (4,2) 0.0609 0.0610 0.0623 0.0338 0.0257 0.0224 0.0348 0.0292 0.0268 (4,3) 0.0507 0.0309 0.0472 0.0324 0.0442 0.0354 0.0278 0.0312 0.0473 (4,4) 0.0018 0.0194 0.0207 0.0243 0.0256 0.0344 0.0338 0.0291 0.0464 (5,1) 0.0007 0.0008 0.0070 0.0051 0.0102 0.0078 0.0100 0.0157 0.0434 (5,2) 0.0029 0.0015 0.0026 0.0423 0.0497 0.0443 0.0476 0.0523 0.0467 (5,3) 0.0465 0.0296 0.0364 0.0298 0.0363 0.0329 0.0531 0.0477 0.0492 (5,4) 0.0042 0.0029 0.0054 0.0322 0.0346 0.0294 0.0268 0.0246 0.0260
下载: 导出CSV
表 3 各组件自身热辐射对不同区域影响权重的统计结果
Table 3. Statistical results of the influence weight of each component's own thermal radiation on different region
Lens1
surfaceLens2
surfaceLens3
surfaceLens4
surfaceLens5
surfaceLens6
surfaceLens7
surfaceTube2
surfaceTube3
surfaceTube4
surface(1,1) 0.0109 0.4563 0.5829 0.2884 0.2153 0.4592 0.3810 2.8478 0.0188 3.7397 (1,2) 0.0798 0.9770 0.0415 3.8861 0.7863 0.1520 0.9954 0.9895 1.0781 0.0143 (1,3) 0.0630 0.0507 0.3153 0.3776 0.0710 1.1261 2.5766 0.0587 4.2337 0.1275 (1,4) 1.1484 0.0005 0.7566 0.7554 1.4393 1.5327 3.2829 0.0010 0.0004 0.0829 (2,1) 0.4740 0.0060 5.6941 0.5965 0.5211 0.0018 0.6339 0.1194 0.0024 0.9508 (2,2) 5.8813 0.0063 0.0059 0.5306 0.5377 0.9215 0.6269 0.0474 0.1718 0.2708 (2,3) 0.0631 2.2268 3.9299 0.3563 0.5734 0.0595 1.5599 0.0389 0.0077 0.1845 (2,4) 0.0278 0.0664 0.0072 2.2697 3.9957 0.0052 1.8296 0.0466 0.7069 0.0447 (3,1) 0.0111 0.0000 2.1920 0.5886 1.6966 0.0011 0.6582 3.1848 0.0007 0.6668 (3,2) 0.0274 0.0024 0.8975 0.9569 1.0695 0.6771 3.5116 0.0000 1.8523 0.0054 (3,3) 0.0396 0.1057 0.8885 0.0481 0.6657 4.1218 0.3969 0.3068 0.0089 2.4179 (3,4) 0.0470 0.0112 0.1566 3.0758 0.4770 2.9292 1.5795 0.6474 0.0504 0.0259 (4,1) 1.3208 0.0000 0.3538 2.2130 2.4022 0.9429 1.4545 0.0008 0.0011 0.3109 (4,2) 0.0055 0.0055 0.0167 1.0900 1.6308 0.0025 3.4895 0.0000 2.2563 0.5032 (4,3) 0.0355 0.0974 0.0658 2.8746 3.4224 0.0394 1.0559 1.3683 0.0005 0.0402 (4,4) 0.0869 0.1025 4.1475 0.1444 1.3028 0.5009 2.1155 0.0000 0.3436 0.2559 (5,1) 0.5844 0.0504 0.1219 1.8478 1.8203 0.2928 3.7681 0.0000 0.3663 0.1481 (5,2) 0.5876 0.0001 0.0421 0.8498 1.3815 0.5515 2.9160 0.0000 2.6658 0.0056 (5,3) 0.0105 0.0002 2.2807 0.7391 1.7332 0.0764 0.5562 3.0692 0.3640 0.1705 (5,4) 0.0839 0.2977 2.8863 0.3245 0.3405 0.0060 4.2691 0.7484 0.0058 0.0377
下载: 导出CSV
-
[1] Zhang F, Zhang W, Wan W. Research on stray radiation of infrared detection optical system based on ray-tracing [J]. Infrared and Laser Engineering, 2019, 48(9): 0904006. (in Chinese) [2] Pravdivtsev A V, Akram M N. Simulation and assessment of stray light effects in infrared cameras using non-sequential ray tracing [J]. Infrared Physics & Technology, 2013, 60(5): 306-311. [3] Zhu Y, Zhang X, Liu T, et al. Internal and external stray radiation suppression for LWIR catadioptric telescope using non-sequential ray tracing [J]. Infrared Physics & Technology, 2015, 71(3): 163-170. [4] Tian Q, Chang S, He F, et al. Internal stray radiation measurement for cooled infrared imaging systems using ambient temperature [J]. Acta Optica Sinica, 2017, 37(7): 0712002. (in Chinese) doi: 10.3788/AOS201737.0712002 [5] Niu J, Zhou R, Liu Z, et al. Analysis of stray light caused by thermal radiation of infrared detection system [J]. Acta Optica Sinica, 2010, 30(8): 2267-2271. (in Chinese) doi: 10.3788/AOS20103008.2267 [6] Angeli G Z, Dierickx P, Zheng J R, et al. Antarctic Surveying Telescope (AST3-3) NIR camera for the Kunlun Infrared Sky Survey (KISS): Thermal optimization and system performance [C]//Proceedings of SPIE, 2016, 99111: 99111H. [7] Saha S L, Zhang W, Mcclelland J M. Optical design of the STAR-X telescope [C]//Proceedings of SPIE, 2017, 10399: 103990I. [8] Patterson B A, Atad-Ettedgui E, Wells M, et al. Analysis of scattered light for VISTA [C]//Proceedings of SPIE, 2003, 4842: 459469. [9] Rolland J P, Yan C, Kim D W, et al. Stray light analysis of large aperture optical telescope using TracePro [C]//Proceedings of SPIE, 2014, 9298: 92981F. [10] Sholl M J, Grochocki F S, Fleming J C, et al. Stray light design and analysis of the SNAP telescope[C]//Proceedings of SPIE, 2007, 6675: 66750C. [11] Qiang H, Xinhua N, Xuemin S. Stray radiation analysis caused by interior heat radiation in infrared optical systems [J]. Infrared Technology, 2006, 28(6): 348-352. (in Chinese) [12] Song X, Zhang Y, Jia Y, et al. Stray light analysis and suppression structure design of transmissive infrared lens [J]. Infrared Technology, 2018, 40(11): 1065-1070. (in Chinese) [13] Tian Q J, Chang S T, Li Z, et al. A method to measure internal stray radiation of cryogenic infrared imaging systems under various ambient temperatures [J]. Infrared Physics & Technology, 2017, 81(12): 1-6. [14] Lu Q. Thermal radiation stray light integration method of infrared camera in geostationary orbit [J]. Infrared and Laser Engineering, 2020, 49(5): 20190457. (in Chinese) [15] Hu Zhuoyue. Research on key technologies of quantitative measurement of wide-range and high-resolution thermal infrared Imager [D]. Shanghai: University of Chinese Academy of Sciences(Shanghai Institute of Technical Physics of the Chinese Academy of Sciences), 2021. (in Chinese) [16] Shen L M, Li Z G, Liu K. Analysis of the internal stray radiation in infrared imaging system based on ambient temperature [C]//Proceedings of SPIE, 2021, 12061: 120611D . [17] Vijoen J W, Goss T M, Willers C J. MWIR FPA control for optimal NETD [C]//Proceedings of SPIE, 2019, 11043: 110430A. [18] Chen X, Lin C, Yang L. Research on space - based infrared detection probability for sea surface targets [J]. Laser and Infrared, 2017, 47(10): 1254-1258. (in Chinese) [19] Chong Yuan, Ai Wei, Wang Yukun. Operating distance estimation model of infrared point target [J]. Command Control & Simulation, 2020, 42(6): 59-62. (in Chinese) [20] Lei Wuhu, Tang Jinying, Wang Di, et al. Analysis of the influence to the HgCdTe infrared detector performance of the temperature variation [J]. Aerospace Electronic Warfare, 2021, 37(2): 38-42. (in Chinese) [21] Shi X, Xu X. Impact of background radiation on the detection performance of interceptor seekers [J]. Systems Engineering & Electronics, 2010, 32(10): 2053-2056, 2085. (in Chinese) [22] Tener G D, Olson S C, Gaudiosi D M, et al. Staring array infrared search and track performance with dither and stare step [J]. Optical Engineering, 2018, 57(5): 053101. [23] Yu Fei. Research on the influence of the self-thermal radiation on the performance of infrared detection system [D]. Beijing: University of Chinese Academy of Sciences (Institute of Optics and Electronics of Chinese Academy of Sciences), 2017. (in Chinese) [24] Jin He. Study on the influence of background radiation on the performance of infrared detection system [D]. Beijing: University of Chinese Academy of Sciences (Institute of Optics and Electronics of Chinese Academy of Sciences), 2016. (in Chinese) [25] Razeghi M, LaCroix L, Brown G J, et al. Peeling the onion: an heuristic overview of hit-to-kill missile defense in the 21st century [C]//Proceedings of SPIE, 2005, 5732: 225−249. -

 点击查看大图
计量
- 文章访问数: 139
- HTML全文浏览量: 20
- PDF下载量: 69
- 被引次数: 0


